. 2018 Jul;559(7715):627-631.
doi: 10.1038/s41586-018-0345-2. Epub 2018 Jul 18.

Thymic tuft cells promote an IL-4-enriched medulla and shape thymocyte development

Affiliations

Thymic tuft cells promote an IL-4-enriched medulla and shape thymocyte development

Corey N Miller et al. Nature. 2018 Jul.

Abstract

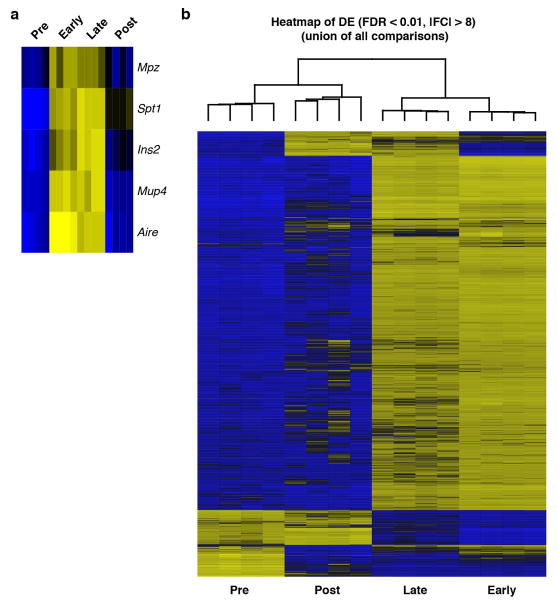
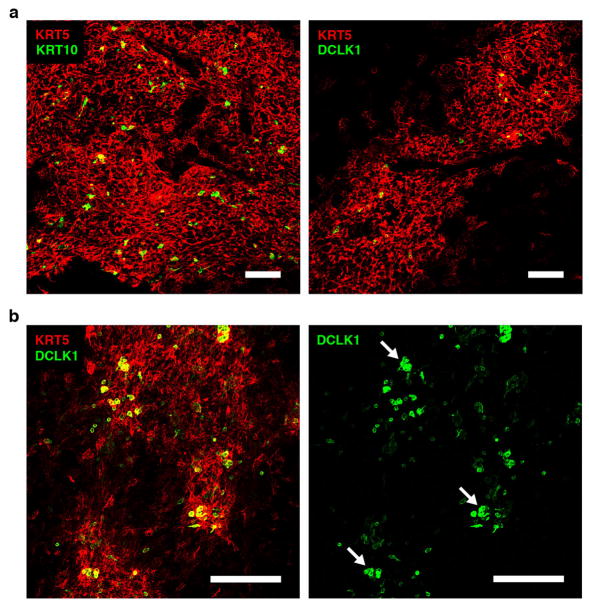
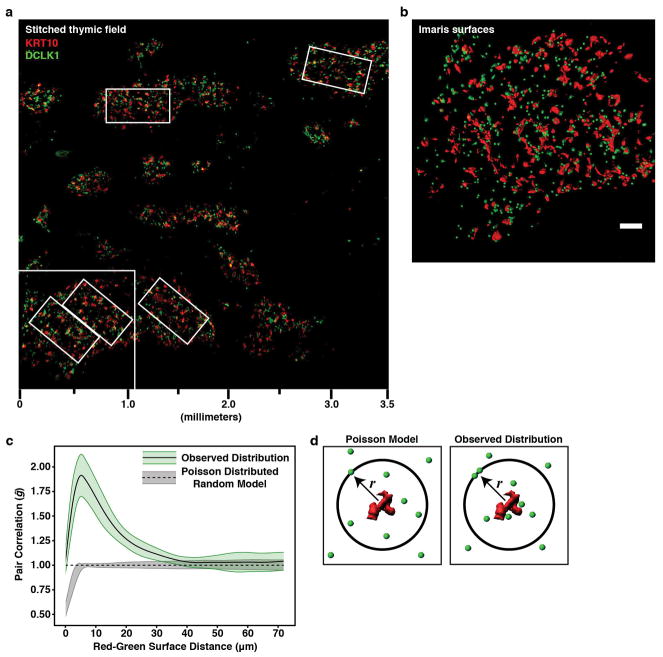
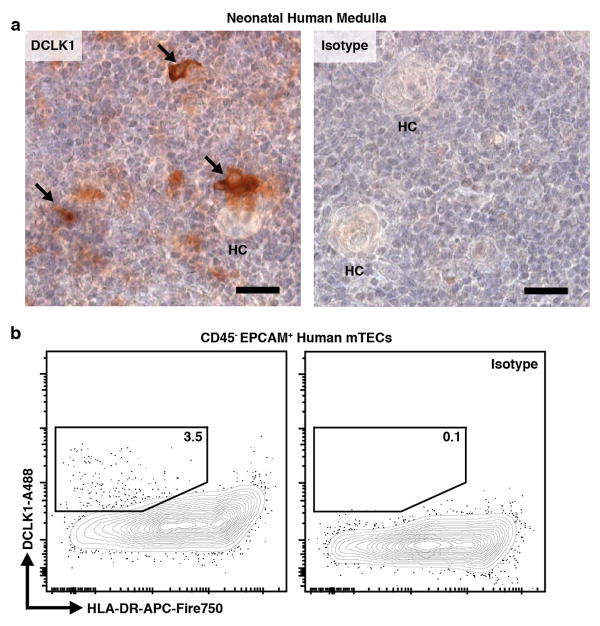
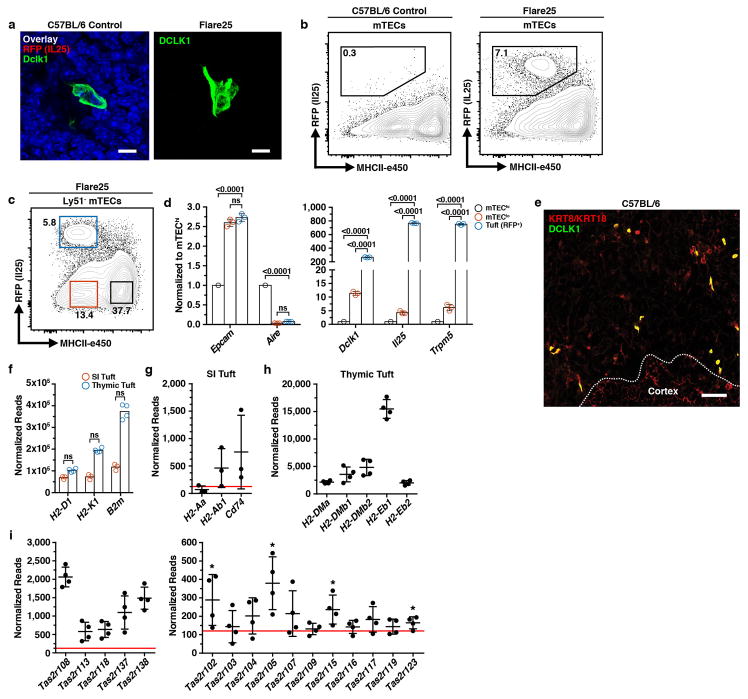
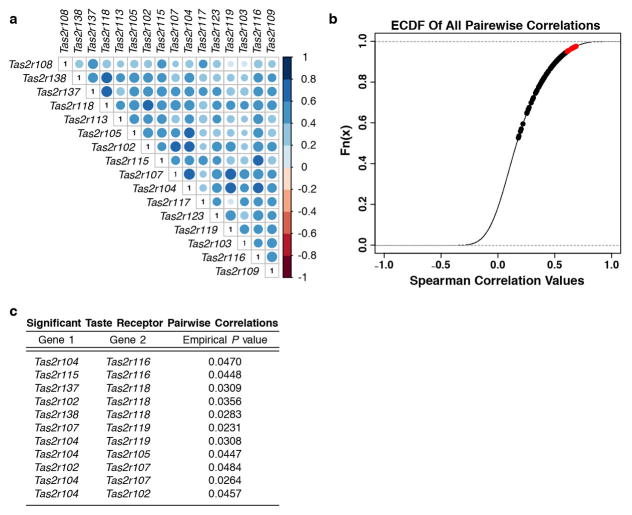
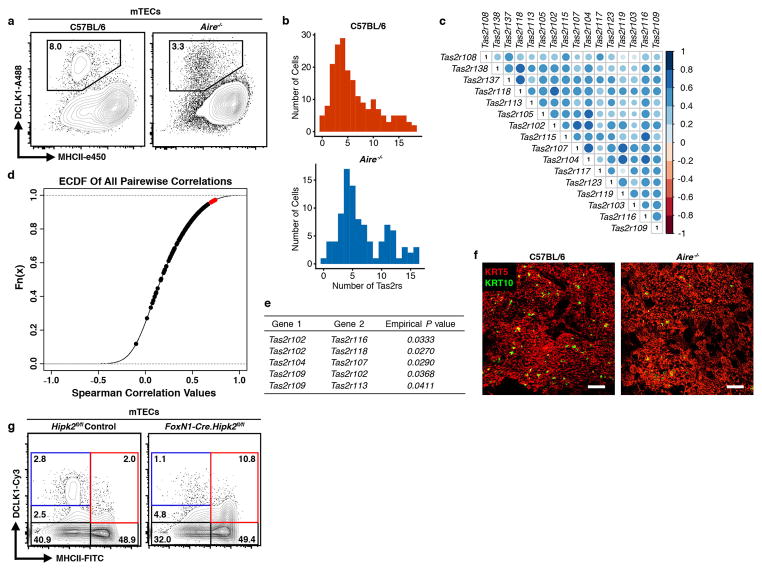
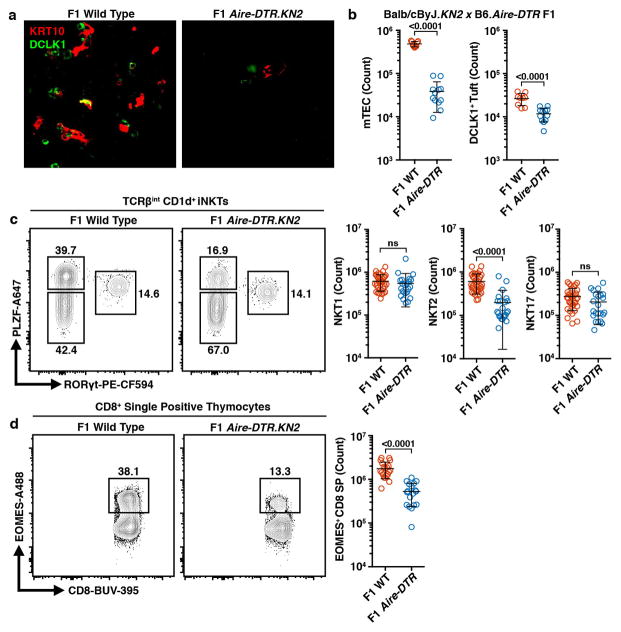
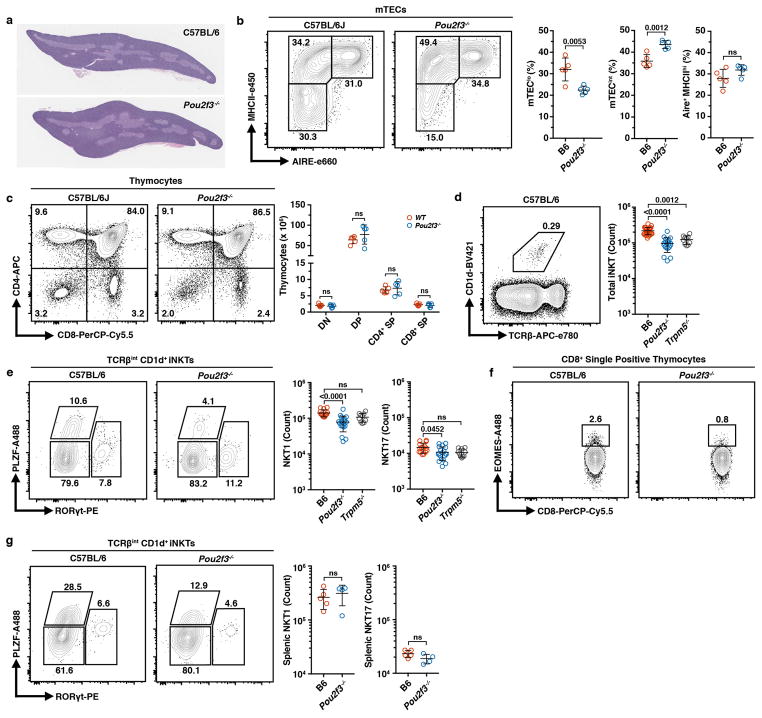
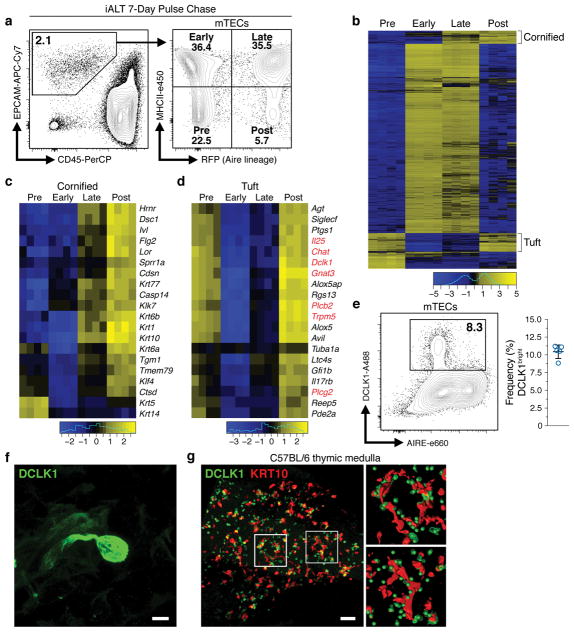
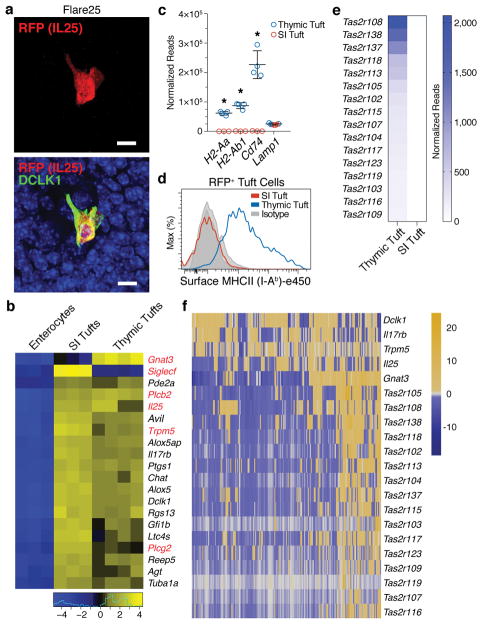
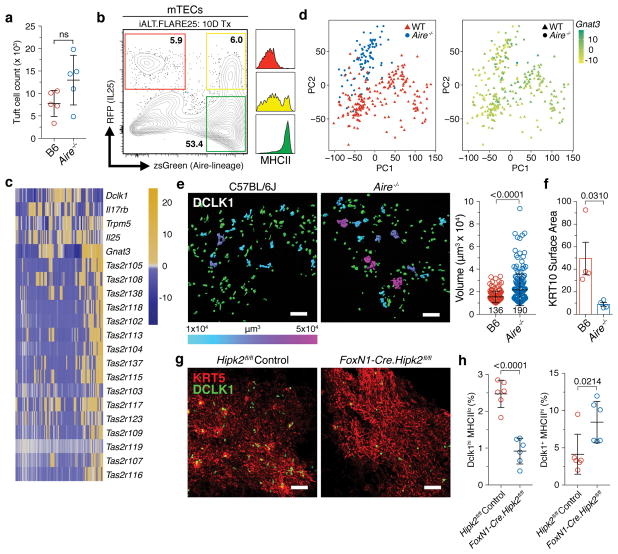
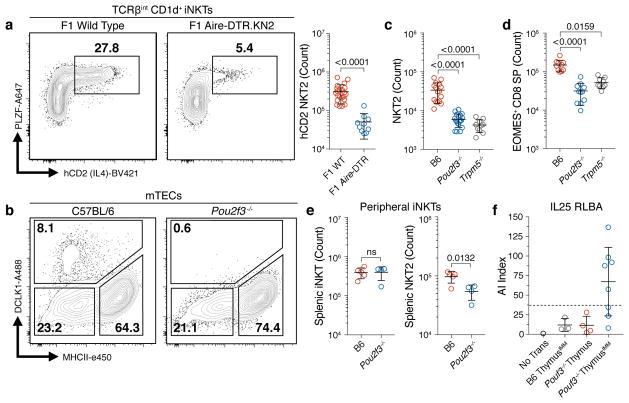
The thymus is responsible for generating a diverse yet self-tolerant pool of T cells1. Although the thymic medulla consists mostly of developing and mature AIRE+ epithelial cells, recent evidence has suggested that there is far greater heterogeneity among medullary thymic epithelial cells than was previously thought2. Here we describe in detail an epithelial subset that is remarkably similar to peripheral tuft cells that are found at mucosal barriers3. Similar to the periphery, thymic tuft cells express the canonical taste transduction pathway and IL-25. However, they are unique in their spatial association with cornified aggregates, ability to present antigens and expression of a broad diversity of taste receptors. Some thymic tuft cells pass through an Aire-expressing stage and depend on a known AIRE-binding partner, HIPK2, for their development. Notably, the taste chemosensory protein TRPM5 is required for their thymic function through which they support the development and polarization of thymic invariant natural killer T cells and act to establish a medullary microenvironment that is enriched in the type 2 cytokine, IL-4. These findings indicate that there is a compartmentalized medullary environment in which differentiation of a minor and highly specialized epithelial subset has a non-redundant role in shaping thymic function.


Conflict of interest statement

The authors declare no competing interests.

Figures

Extended Data Figure 1
Extended Data Figure 1. RNA sequencing of FACS sorted iALT mTEC subsets
a, Heatmap of Aire and representative Aire-dependent TSAs in pre- early- late- and post-Aire populations as defined in Fig. 1a. b, Heatmap of differentially expressed genes with a FDR < 0.01 and |FC| > 8. Columns are organized by unsupervised hierarchical clustering (union of all comparisons) with a dendrogram representing similarity between clustered columns. Note that the early-, and late- Aire-expressing populations are grouped, as expected.
Extended Data Figure 2
Extended Data Figure 2. Medullary localization of DCLK1bright cells and KRT10 bodies
Representative confocal maximum projections (25 μm) of IF staining of thymic slices at low magnification. a, Left, KRT5 (red) and KRT10 (green) and right, KRT5 (red) and DCLK1 (green) showing medullary localization of KRT10 and DCLK1 signal. b, Left, KRT5 (red) and DCKL1 (green) and right, DCLK1 alone. Region was selected for presence of multicellular DCLK1bright cell clumps as indicated by white arrows. Scale bars, 100 μm. n = 3 mice; images are representative of 3 independent experiments.
Extended Data Figure 3
Extended Data Figure 3. Non-random distribution of medullary DCLK1bright cells
a, Stitched confocal maximum projection (77μm) of IF staining of semi-thick (200μm) C57BL/6 thymic slice at low magnification. KRT10 (red) and DCLK1 (green). Field, 3670 × 3670 μm. Small rectangles indicate volumes selected for quantitative image analysis from this slice. b, Expanded area from (a) indicated in lower left corner with KRT10 signal converted into surfaces and DLCK1 signal converted to center of intensity coordinates. Scale bar, 100 μm. c, Pair correlation function analysis (PCF) of 12 identically sized regions of interest (586 × 272 × 77μm) from three different stitched thymic slices (n = 3 thymic slices). Results are presented as a histogram for a range of distances from KRT10 surfaces and are interpreted as follows: g = 1 indicates a spatial distribution that follows a random Poisson distribution, illustrated by a dashed line and gray envelope; g < 1 indicates regularity in the distribution; g > 1 indicates clustering. d, Schematic representation of the PCF analysis. The PCF counts the number of objects from a surface at a radial distance (r) and compares this number to the expected number of events for a random Poisson distributed population at this distance.
Extended Data Figure 4
Extended Data Figure 4. Human thymus contains medullary DCLK1bright cells
a, Representative immunohistochemistry of neonatal (21d) human thymus stained for DCLK1 or isotype control. Arrows point to individual DCLK1bright cells or cluster. HC, Hassall’s Corpuscle. Scale bars, 25 μm. b, Flow plot from enzymatically digested prenatal human thymus (22.3 gestational weeks) gated on CD45 EPCAM+ TECs showing intracellular DCLK1 or isotype control. Note that human DCLK1+ events are approximately 3.5% of prenatal TECs. Data are representative of 2 independent experiments.
Extended Data Figure 5
Extended Data Figure 5. Characterization of thymic tuft cells
a, DCLK1 and RFP (IL25) in C57BL/6 control and Flare25 thymus. Confocal maximal projection. Scale, 5 μm. n = 3 mice, 2 independent experiments. b, RFP (IL25) in C57BL/6 control and Flare25 mTECs (CD11c CD45 EPCAM+). n = 5 mice; 3 independent experiments. c, Gating strategy for FACS sorting of CD11c CD45 Epcam+ Ly51 mTECs from Flare25 reporter mice for qPCR analysis of mTEChi (RFP MHCIIhi), mTEClo (RFP+ MHCIIlo), and thymic tuft (RFP+) populations. d, qPCR analysis of expression of indicated genes of interest on populations sorted in (c) normalized to mTEChi (mean +/− SD). n = 3 mice. Two-way non-parametric ANOVA with multiple comparisons. e, Representative confocal maximum projection (10 μm) stained for KRT8/KRT18 (red) and DCLK1 (green). Scale bars, 50 μm. n = 3 mice, 2 independent experiments. f–i, Expression levels (normalized reads from Fig. 2b) from bulk RNA sequencing of SI (n = 3 mice) and thymic tuft (n = 4 mice) cells. f, Major MHCI genes and B2m. FDR > 0.1. g, Major MHCII genes and CD74 in SI tuft cells. h, Minor MHCII genes in thymic tuft cells. i, Tas2r family members in thymic tuft cells. g–i, Mean +/− SD. g, i, Red line corresponds to a cutoff of 5 reads/million; * mean and SD fall above this cutoff.
Extended Data Figure 6
Extended Data Figure 6. Tas2r expression in single thymic tuft cells is not stochastic
a, Correlation plot of Tas2r genes in single Flare25 tuft cells as analyzed in Fig. 2f. Color and circle size represent pairwise correlation value. b, Empirical Cumulative Distribution Function plot of pairwise gene expression correlation of single Flare25 tuft cells. Red points represent Tas2r genes that were significantly highly correlated compared to the background gene set (P < 0.05). c, List of correlated Tas2r gene pairs from (b) and their corresponding empirical P values.
Extended Data Figure 7
Extended Data Figure 7. Analysis of Tas2r expression in single Flare25 and Flare25Aire−/− thymic tuft cells
a, Intracellular DCLK1 in C57BL/6 control and Aire−/− mTECs (CD11c CD45 EPCAM+). n = 5 mice; 3 independent experiments. b, Histogram showing the number of Tas2r family members expressed per individual thymic tuft cell. Note that the distribution is similar between wild type and Aire−/− cells. c, Correlation plot of Tas2r genes in single Flare25.Aire−/− tuft cells as analyzed in Fig. 3c. Color and circle size represent pairwise correlation value. d, Empirical Cumulative Distribution Function plot of pairwise gene expression correlation of single Flare25.Aire−/− tuft cells. Red points represent Tas2r genes that were significantly highly correlated compared to the background gene set (P < 0.05). e, List of correlated Tas2r gene pairs from (d) and their corresponding empirical P values. f, Representative confocal maximum projections (25 μm) of IF analysis of C57BL/6 and Aire−/− thymi stained for KRT5 (red) and KRT10 (green). Scale bars, 100 μm. n = 3 mice; 2 independent experiments. f, Analysis of DCLK1+ cells in Hipk2fl/fl controls or FoxN1-Cre.Hipk2fl/fl (mTEC Hipk2−/−) thymus gated on CD45 CDR1 EPCAM+ mTECs as quantified in Fig. 3h. n = 6 mice; 3 independent experiments.
Extended Data Figure 8
Extended Data Figure 8. Single cell RNA sequencing data quality and inclusion criteria
a, Histograms of total read counts (left) or features (right) for each single cell. Red represents Flare25 thymic tuft cells and blue represents Flare25.Aire−/− thymic tuft cells. Cells with fewer than 100,000 reads or 750 detected features were discarded from further analysis. b, Scatter plot of total features vs mitochondrial read percent. Red represents Flare25 thymic tuft cells and blue represents Flare25.Aire−/− thymic tuft cells. Triangles and circles denote cells from two separate sorts. Cells with more than 10 percent of their reads mapping to mitochondrial genes were discarded from further analysis as indicated by the black line.
Extended Data Figure 9
Extended Data Figure 9. DT ablation of thymic tuft cells in Balb/cByJ.KN2 x C57BL/6.Aire-DTR F1 mice disrupts the medullary NKT2-IL4 axis
a–d, Analysis of thymus from Balb/cByJ.KN2 x C57BL/6.Aire-DTR F1 mice or Aire-DTR F1 controls treated for 9 days with DT. a, IF staining of thin thymic sections for KRT10 (red) and DCLK1 (green). n = 3 mice; 2 independent experiments. b, Counts of CD11c CD45 EPCAM+ mTECs and DCLK1+ tuft cells in non-Tg controls (n = 9 mice) or F1 thymus (n = 12 mice). c, Flow plots gated on TCRβint CD1d+ iNKTs showing intracellular PLZF and RORγt staining for iNKT subset analysis. Right, counts of NKT1 (PLZFRORγt), NKT2 (PLZF+RORγt), and NKT17 (PLZFRORγt+) in non-Tg controls (n = 35 mice) or F1 thymus (n = 23 mice). d, Flow plots gated on TCRβ+ CD8+ SP thymocytes showing intracellular EOMES. Right, counts of EOMES+ cells in non-Tg controls (n = 20 mice) or F1 thymus (n = 18 mice). b–d, Mean +/− SD. Unpaired, parametric, 2-tailed Student’s t test. Pooled from 3 independent experiments.
Extended Data Figure 10
Extended Data Figure 10. Characterization of Pou2f3−/− mice
a, Representative on-edge, full-face mid-thymic sections (5μm) stained with hematoxylin and eosin showing grossly normal thymic architecture in Pou2f3−/− mice. n = 3 mice; 2 independent experiments. b, Flow plots (left) and frequencies (right) of mTEC subsets from C57BL/6J and Pou2f3−/− mice. n = 5 mice per genotype; 3 independent experiments. c, Flow plots (left) and counts (right) of thymocyte subsets from C57BL/6J and Pou2f3−/− mice. n = 5 mice per genotype; 3 independent experiments. d, Flow plots (left) of TCRβint CD1d+ thymic iNKTs in B6 (n = 26 mice), Pou2f3−/− (n = 19 mice), or Trpm5−/− (n = 10 mice). e, Gating strategy of iNKT subset analysis (left) and counts (right) of NKT1 (PLZFRORγt) and NKT17 (PLZFRORγt+) in B6 (n = 15 mice), Pou2f3−/− (n = 19 mice), or Trpm5−/− (n = 10 mice). f, Flow plots gated on TCRβ+ CD8+ SP thymocytes showing intracellular EOMES. Quantified in Fig. 4d. g, Flow plots gated on splenic TCRβint CD1d+ iNKTs showing intracellular PLZF and RORγt staining for iNKT subset analysis, NKT1 (PLZFRORγt), NKT2 (PLZF+RORγt), and NKT17 (PLZFRORγt+). Right, counts of NKT1 and NKT17 in B6 (n = 5 mice) or Pou2f3−/− (n = 4 mice). 2 independent experiments. b–e, g, Mean +/− SD. b, c, g, Unpaired, parametric, 2-tailed Student’s t test. d, e, One-way, non-parametic ANOVA (Kruskal-Wallis test). Pooled from 3 independent experiments.
Figure 1
Figure 1. Tuft-like cells are closely associated with cornified bodies in the thymic medulla
a, Gating of mTEC subsets within CD11c CD45 EPCAM+ thymic epithelial cells. Sorted in quadruplicate for RNA-seq (12 pooled thymi per replicate, n = 4 sorted replicates). b, Heatmap of differentially expressed genes (FDR < 0.01 and |FC| > 8). c, d, Selected genes from regions marked ‘Cornified’ or ‘Tuft’. Log2 fold change relative to mean expression. e, DCLK1 intracellular staining in mTECs (mean +/− SD). n = 5 mice; 3 independent experiments. f, Confocal maximum projection of a DCLK1bright cell. Scale, 5 μm. n = 5 mice, 3 independent experiments. g, Confocal maximum projection (z = 77 μm) of a medullary region at low magnification. Right, regions of interest (white squares) with KRT10 converted to surfaces and DCLK1 converted to center of intensity coordinates. Scale, 100 μm. n = 3 thymic slices, 2 independent experiments.
Figure 2
Figure 2. Thymic Dclk1bright cells are a novel subset of tuft cells
a, Co-localization of DCLK1 and RFP (IL25) in Flare25 thymus. Confocal maximal projection. Scale, 5 μm. n = 3 mice, 2 independent experiments. b, Differential expression of 20 tuft markers comparing sorted enterocytes and SI tuft cells (n = 3 mice) and thymic tuft cells (n = 4 mice) from Flare25 mice. Log2 fold change relative to mean expression. c, Expression (normalized reads from b) of MHCII genes in SI and thymic tuft cells (mean +/− SD). * FDR < 0.00001. Lamp, FDR = 1. d, MHCII (I-Ab) surface staining on SI and thymic tuft cells. n = 3 mice; 2 independent experiments. e, Heatmap of select Tas2r genes comparing expression (normalized reads from b) between thymic and SI tuft cells. f, Single cell RNA sequencing of RFP+ (IL25+) thymic tuft cells. Heatmap shows selected tuft and Tas2r gene expression. Columns are single cells (n = 195), values are mean-centered log-normalized.
Figure 3
Figure 3. Aire is expressed by some thymic tuft cells but is not required for their development
a, DCLK1bright mTEC counts. n = 5 mice per genotype; 3 independent experiments. b, mTECs from iALT.Flare25 double-reporter mice after 10-day tamoxifen treatment. Right, MHCII (I-Ab) surface expression within each gated population. n = 5 mice; 2 independent experiments. c, Single cell RNA sequencing of RFP+ (IL25) Aire−/− thymic tuft cells. Heatmap shows selected tuft and Tas2r gene expression. Columns are single cells (n = 95), values are mean-centered log-normalized. d, PCA of single cell RNA sequencing data from RFP+ tuft cells. Right, Gnat3 expression overlaid. e, DCLK1 staining with signal converted to Imaris surfaces; volumes > 5x mean single-cell volume (1×104 μm3) are pseudocolored according to size. Right, pooled data. n = 3 mice per genotype. f, KRT10 surface area in thymic medulla (per unit area). Three regions analyzed per thymus. n = 4 mice per genotype; 2 independent experiments. g, h, Analysis of DCLK1bright cells in Hipk2fl/fl controls or FoxN1-Cre.Hipk2fl/fl thymus. g, Confocal imaging of IF staining. h, Frequencies of DCLK1hi MHCIIlo or DCLK1+ MHCIIhi mTECs from flow analysis. n = 6 mice; 3 independent experiments. e, g, Scale, 100 μm. a, e, f, h, Mean +/− SD; unpaired, parametric, 2-tailed Student’s t test.
Fig. 4
Fig. 4. Thymic tuft cells promote an IL4-enriched medullary microenvironment and enforce tolerance
a, DT-treated Balb/cByJ.KN2 x C57BL/6.Aire-DTR F1 thymus (n = 10 mice) or non-Tg controls (n = 22 mice) gated on TCRβint CD1d+ iNKTs. Right, counts of IL4-producing (hCD2+) NKT2s (PLZF+). b, DCLK1 intracellular staining in mTECs. n = 5 mice; 3 independent experiments. c, Thymic NKT2 (TCRβint CD1d+ PLZF+ RORγt) cell counts in B6 (n = 15 mice), Pou2f3−/− (n = 19 mice) and Trpm5−/− (n = 10 mice). d, Thymic EOMES+ TCRβ+ CD8+ SP cell counts in B6 (n = 10 mice), Pou2f3−/− (n = 11 mice) and Trpm5−/− (n = 9 mice). e, Splenic total iNKT and NKT2 cell counts in B6 (n = 5 mice) and Pou2f3−/− (n = 4 mice). f, Serum anti-IL25 autoantibody indices (AI) in nude mice transplanted with C57BL/6 (n = 3 mice) or Pou2f3−/− (n = 12 mice) neonatal thymus and immunized with IL25 protein. IMM = immunized. Dashed line = average of C57BL/6 AI values plus 3 standard deiviations. of a, c–f, Mean +/− SD. a, e, Unpaired, parametric, 2-tailed Student’s t test. c, d, One-way, non-parametic ANOVA (Kruskal-Wallis test). a, c, d, Pooled from 3 independent experiments.

Comment in

  • Introducing … thymic tuft cells.
    Minton K. Minton K. Nat Rev Immunol. 2018 Sep;18(9):542. doi: 10.1038/s41577-018-0047-x. Nat Rev Immunol. 2018. PMID: 30050053 No abstract available.

References

    1. Kyewski B, Klein L. A CENTRAL ROLE FOR CENTRAL TOLERANCE. Annual Review of Immunology. 2006;24:571–606. doi: 10.1146/annurev.immunol.23.021704.115601. - DOI - PubMed
    1. Takahama Y, Ohigashi I, Baik S, Anderson G. Generation of diversity in thymic epithelial cells. Nat Rev Immunol. 2017 doi: 10.1038/nri.2017.12. - DOI - PubMed
    1. Gerbe F, Jay P. Intestinal tuft cells: epithelial sentinels linking luminal cues to the immune system. Mucosal Immunol. 2016;9:1353–1359. doi: 10.1038/mi.2016.68. - DOI - PubMed
    1. Metzger TC, et al. Lineage tracing and cell ablation identify a post-Aire-expressing thymic epithelial cell population. Cell Rep. 2013;5:166–179. doi: 10.1016/j.celrep.2013.08.038. - DOI - PMC - PubMed
    1. Eckhart L, Lippens S, Tschachler E, Declercq W. Cell death by cornification. Biochimica et Biophysica Acta (BBA) - Molecular Cell Research. 2013;1833:3471–3480. doi: 10.1016/j.bbamcr.2013.06.010. - DOI - PubMed

Publication types

MeSH terms