. 2018 Aug;560(7716):107-111.
doi: 10.1038/s41586-018-0341-6. Epub 2018 Jul 18.

Pancreatic islets communicate with lymphoid tissues via exocytosis of insulin peptides

Affiliations

Pancreatic islets communicate with lymphoid tissues via exocytosis of insulin peptides

Xiaoxiao Wan et al. Nature. 2018 Aug.

Abstract

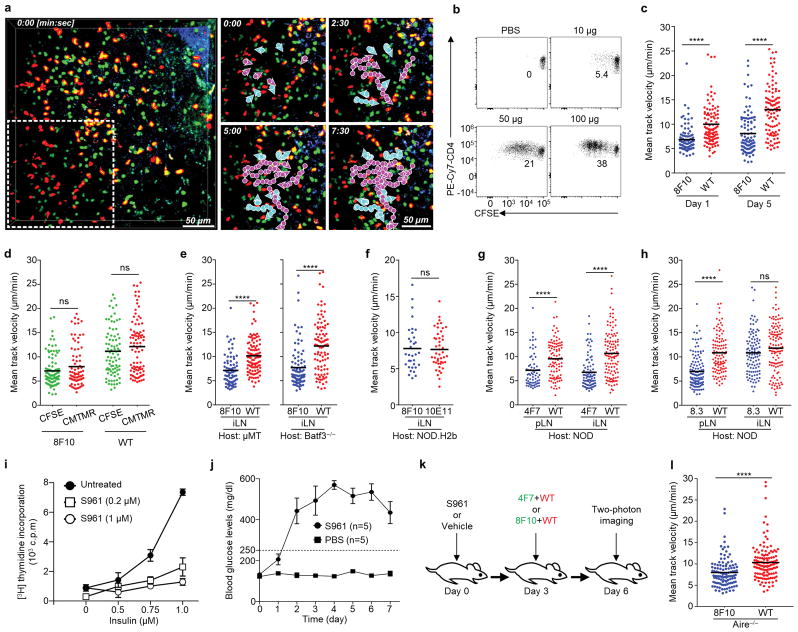
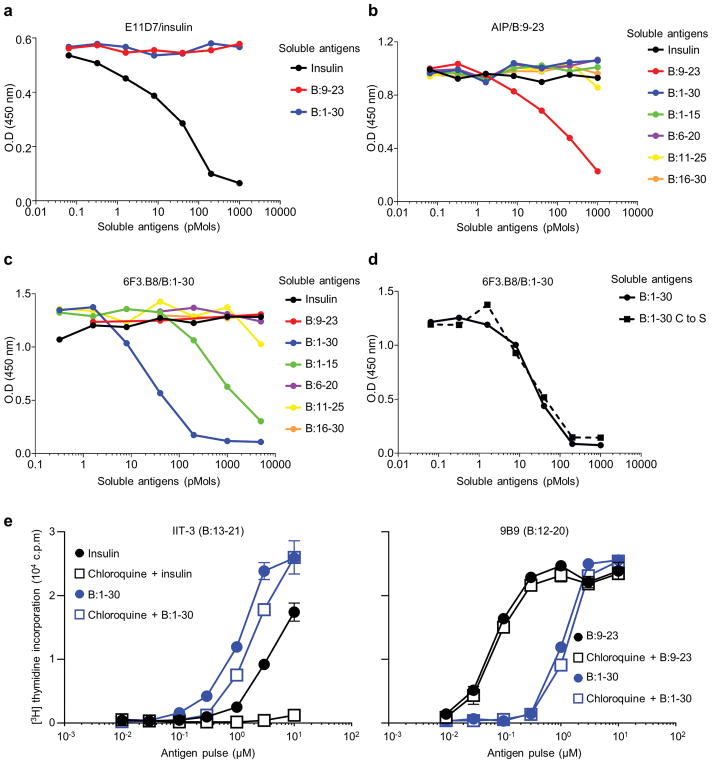
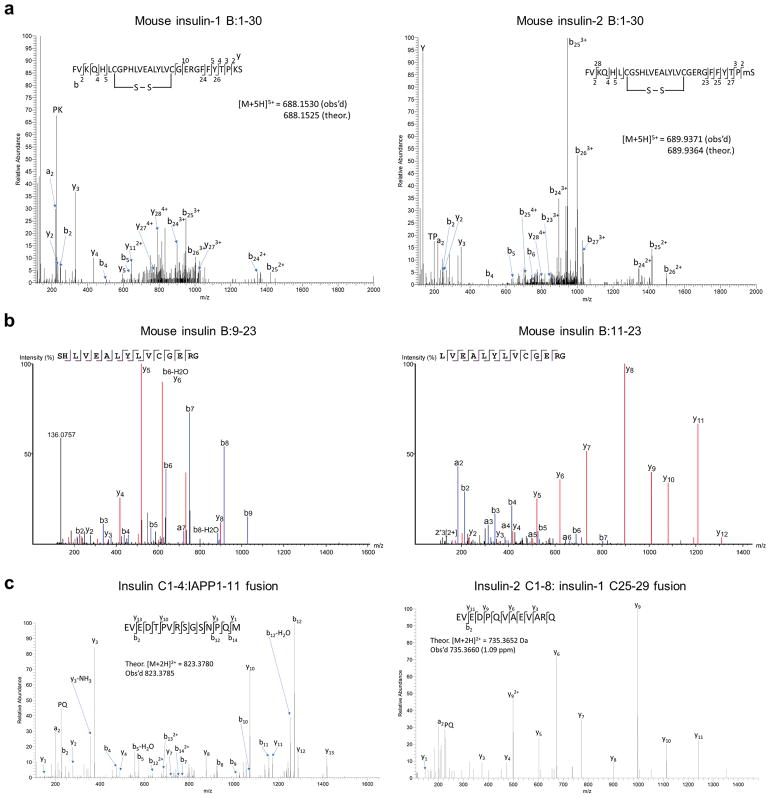
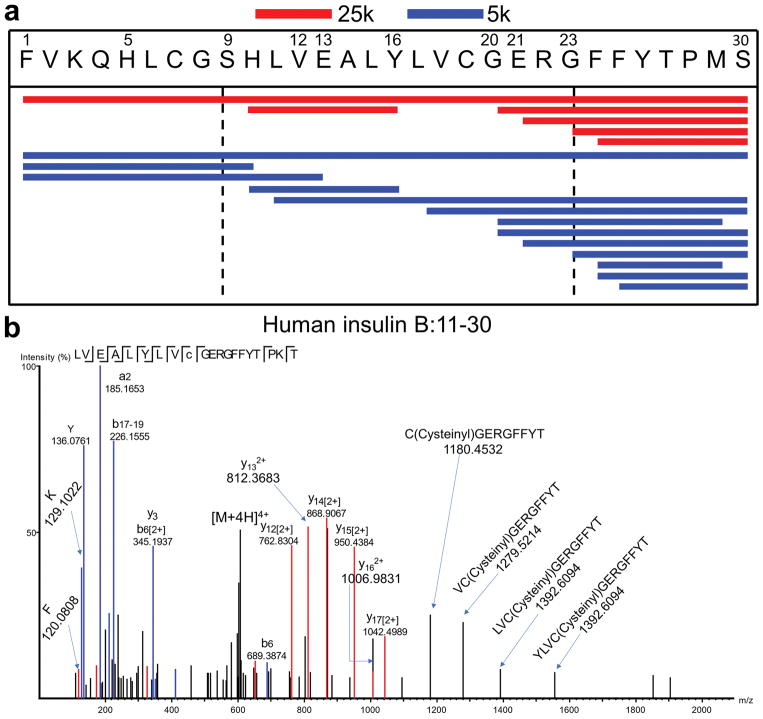
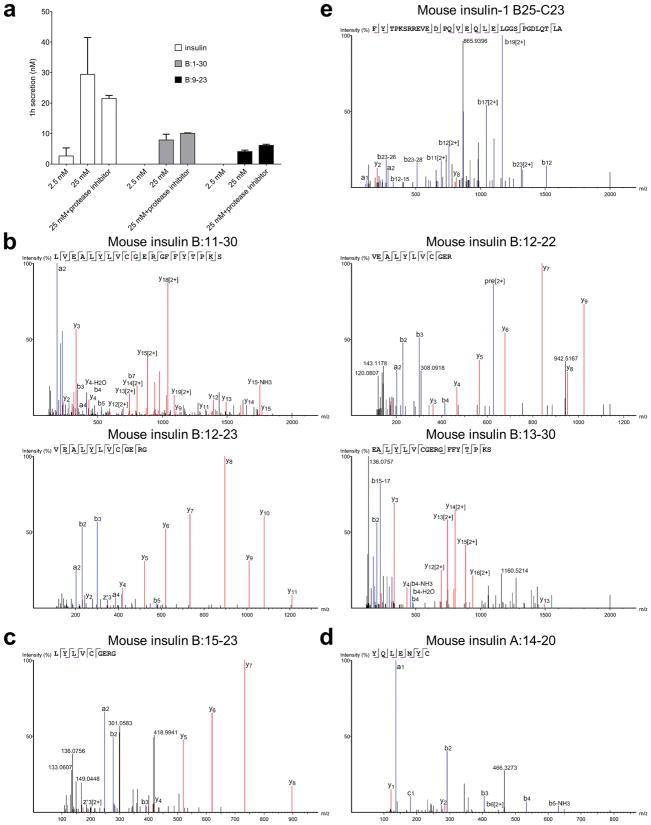
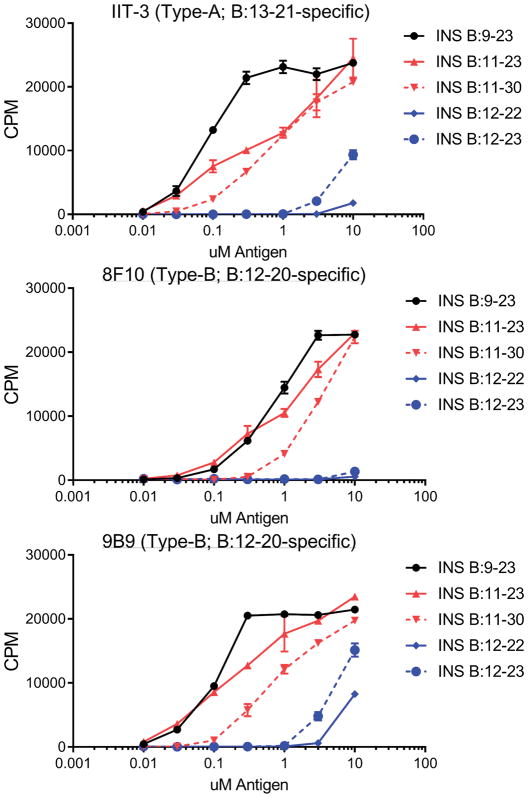
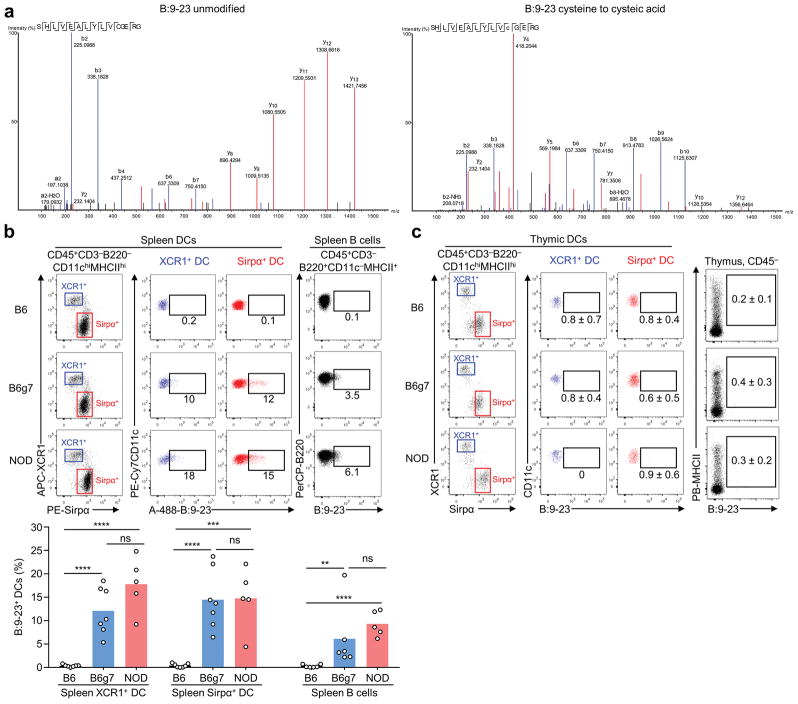
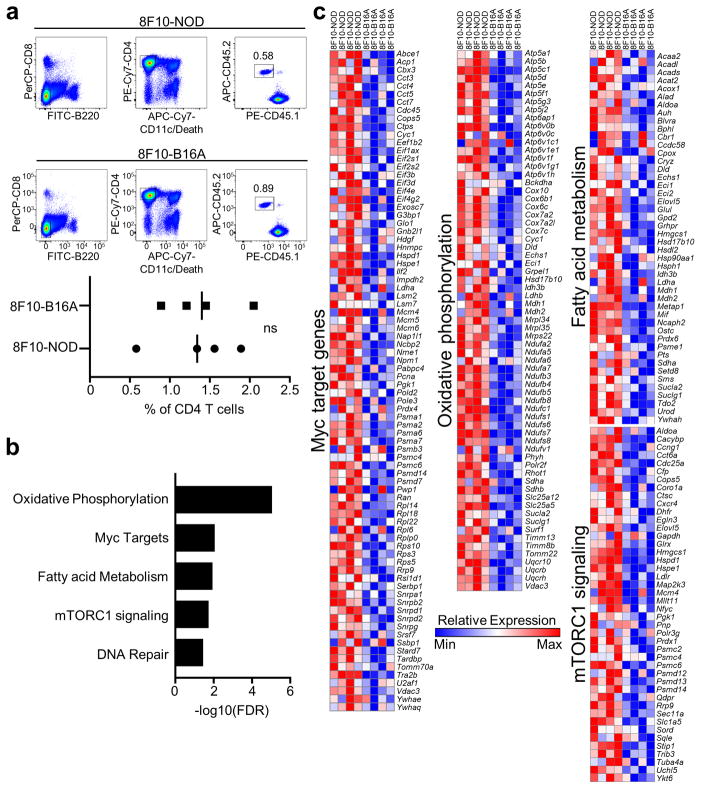
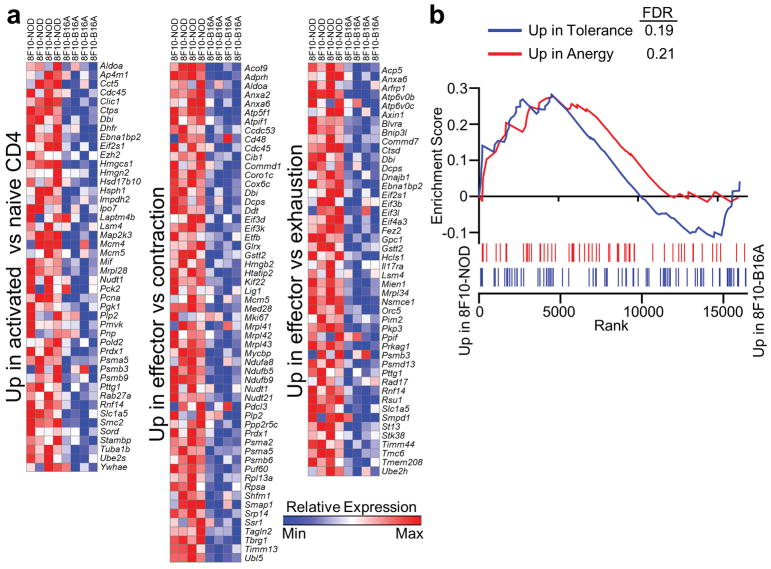
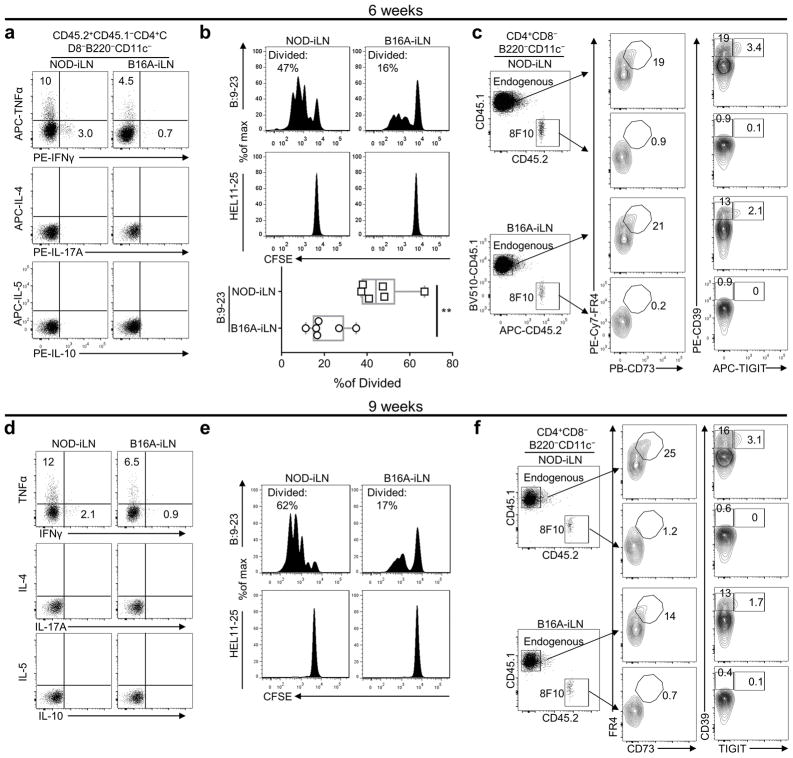
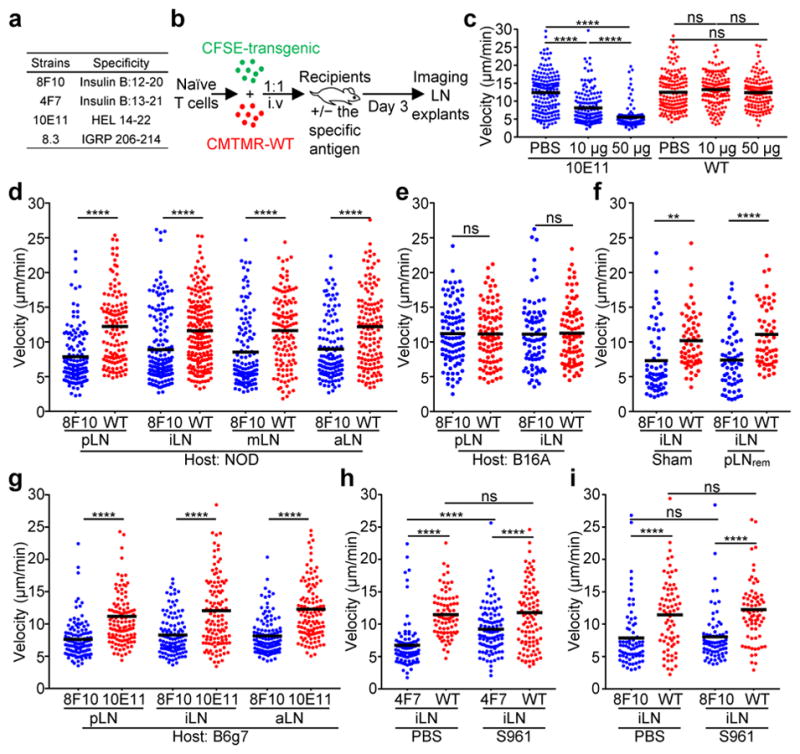
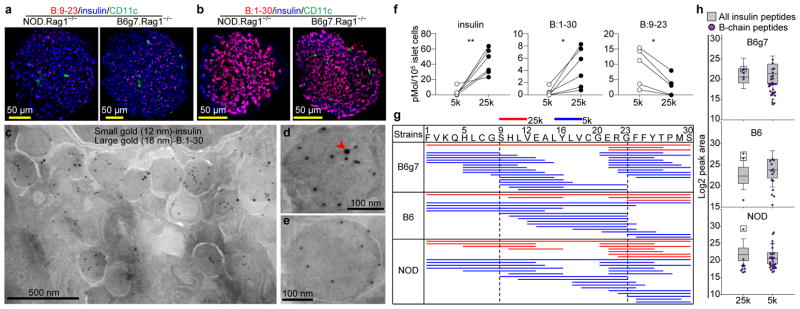
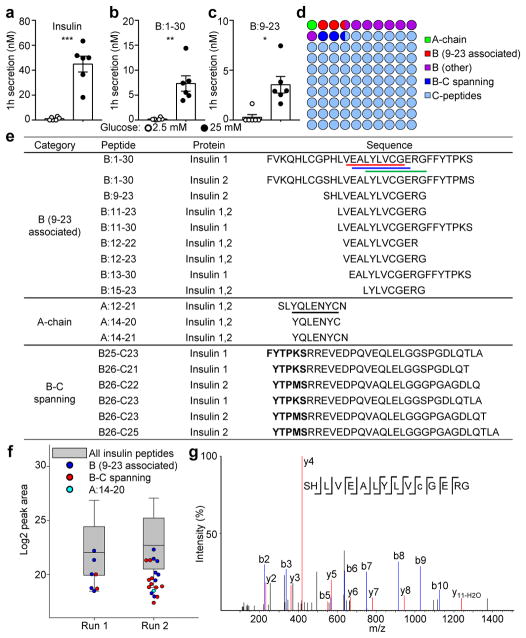
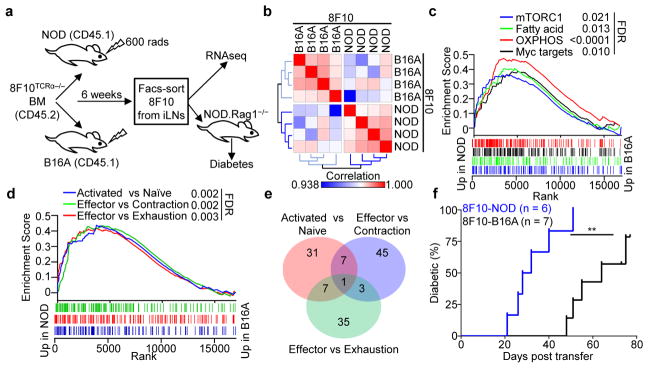
Tissue-specific autoimmunity occurs when selected antigens presented by susceptible alleles of the major histocompatibility complex are recognized by T cells. However, the reason why certain specific self-antigens dominate the response and are indispensable for triggering autoreactivity is unclear. Spontaneous presentation of insulin is essential for initiating autoimmune type 1 diabetes in non-obese diabetic mice1,2. A major set of pathogenic CD4 T cells specifically recognizes the 12-20 segment of the insulin B-chain (B:12-20), an epitope that is generated from direct presentation of insulin peptides by antigen-presenting cells3,4. These T cells do not respond to antigen-presenting cells that have taken up insulin that, after processing, leads to presentation of a different segment representing a one-residue shift, B:13-214. CD4 T cells that recognize B:12-20 escape negative selection in the thymus and cause diabetes, whereas those that recognize B:13-21 have only a minor role in autoimmunity3-5. Although presentation of B:12-20 is evident in the islets3,6, insulin-specific germinal centres can be formed in various lymphoid tissues, suggesting that insulin presentation is widespread7,8. Here we use live imaging to document the distribution of insulin recognition by CD4 T cells throughout various lymph nodes. Furthermore, we identify catabolized insulin peptide fragments containing defined pathogenic epitopes in β-cell granules from mice and humans. Upon glucose challenge, these fragments are released into the circulation and are recognized by CD4 T cells, leading to an activation state that results in transcriptional reprogramming and enhanced diabetogenicity. Therefore, a tissue such as pancreatic islets, by releasing catabolized products, imposes a constant threat to self-tolerance. These findings reveal a self-recognition pathway underlying a primary autoantigen and provide a foundation for assessing antigenic targets that precipitate pathogenic outcomes by systemically sensitizing lymphoid tissues.


Conflict of interest statement

The authors declare no competing financial interests.

Figures

Extended Data Figure 1
Extended Data Figure 1. Probing peripheral antigen presentation by two-photon imaging
The Figure contains further information of the motility assay. a, Representative 3D reconstructions of two-photon z-stacks visualizing CFSE-labelled anti-HEL 10E11 TCR transgenic and CMTMR-labelled WT CD4 T cells in an iLN explant on day 3 post transfer. The dashed-line box depicts a region in which individual T cells were tracked. This region is magnified in panels (right) showing the T cell movement over a 7.5-min time interval, and the quantification was performed over a 5-min interval. The cyan and purple tracks denote 10E11 and WT T cells, respectively. Mice were injected with 10 μg HEL. b, NOD mice (CD45.1) were injected i.p with indicated amounts of HEL, and 6h later, naïve CFSE-labelled 10E11 (CD45.2) T cells were transferred. On day 3, CFSE dilution of the transferred T cells (CD45.2+CD45.1CD4+Vβ8.1/8.2+) in the iLNs was measured by flow cytometry. Data are representative of two independent experiments. c, Mean track velocities (μm/min) of 8F10 and WT CD4 T cells in iLNs from NOD recipients on day 1 or day 5 post transfer. d, CFSE-8F10 plus CMTMR-WT or CMTMR-8F10 plus CFSE-WT T cells were separately transferred into two cohorts of NOD recipients, and their mean track velocities in iLNs on day 3 were compared in paired two-photon imaging analysis. e, Mean track velocities of 8F10 and WT CD4 T cells in NOD.μMT or NOD.Batf3−/− recipients on day 3 post transfer. f, Mean track velocities of 8F10 and 10E11 T cells in NOD.H2b recipients 24 h post transfer. g, h, Mean track velocities of 4F7 and WT CD4 (g) or 8.3 and WT CD8 (h) T cells in NOD recipients on day 3 post transfer. i, Response (mean ± s.e.m) of the B:13-21-specific IIT-3 T cells to ConA-activated peritoneal macrophages treated with or without S961 prior to insulin pulse. j, Blood glucose levels (mean ± s.e.m) of 3-week old NOD mice infused with S961 or PBS via osmotic pumps. k, The scheme of the experiments in Fig. 1h and i. l, Mean track velocities of 8F10 and WT CD4 T cells in iLNs of Aire−/− recipients. Data summarize two (c, d, f, l) or three (e, g, h) independent experiments. Each dot represents individual T cell tracks, and the bar denotes the mean. ns, not significant; ****, P < 0.0001; one-way ANOVA with Sidak’s multiple comparisons test (c, d, g, h) or two-tailed unpaired Student’s t-test (e, f, l).
Extended Data Figure 2
Extended Data Figure 2. Analysis of insulin peptide-specific monoclonal antibodies and presentation of the intact B-chain
a–c, Competitive ELISA responses depicting the binding of the anti-insulin MoAb (E11D7) to plate-bound insulin (a), anti-B:9-23 MoAb (AIP) to plate-bound B:9-23 (b), and anti-B:1-30 MoAb (6F3.B8) to plate-bound B:1-30 (c) in the presence of serially-diluted amounts of the indicated soluble antigens as a competitive inhibitor. The inhibition by a specific soluble antigen indicates the specificity of the MoAb to this antigen. d, Competitive ELISA responses depicting the binding of 6F3.B8 to plate-bound B:1-30 in the presence of soluble unmodified B:1-30 or B:1-30 in which the two cysteines were changed into serines (B:1-30 C to S). The results indicate the intrachain between the two cysteines does not influence the specificity of the 6F3.B8 MoAb. Data (mean) are representative of two independent experiments. e, Responses of the B:13-21-specific IIT-3 (left) or the B:12-20-specific 9B9 (right) T cell hybridoma to C3g7 APCs treated with or without 100 μM chloroquine for 2h and pulsed with indicated antigens after extensive wash. The C3g7 cell is a B cell lymphoma line expressing I-Ag7 used as APCs. The results of the effects of chloroquine indicate that reactivity to insulin, but neither to B:9-23 nor B:1-30 require internal processing. Data (mean ± s.e.m) are representative of two independent experiments.
Extended Data Figure 3
Extended Data Figure 3. nLC-MS/MS analysis of mouse beta-cell granules
a, MS spectra of mouse insulin-1 B:1-30 with intramolecular disulphide bonds (left) and mouse insulin-2 B:1-30 with oxidized methionine on the 29th position (right). b, MS spectra of mouse insulin B:9-23 (left) and B:11-23 (right) which were exclusively identified in the 5k granules of B6g7, B6 and NOD mice. c, MS spectra of two hybrid peptides identified in the 5k granules. The sequence (EVEDTPVRSGSNPQM, left) represents a C-peptide (underlined)-islet amyloid polypeptide (IAPP) fusion, and the sequence (EVEDPQVAEVARQ, right) represents a fusion of insulin-2 C-peptide N-terminus (underlined) with the C-terminus of insulin-1 C-peptide.
Extended Data Figure 4
Extended Data Figure 4. nLC-MS/MS analysis of human beta-cell granules
a, Peptide coverage of insulin B-chain identified in human 25k (red) and 5k (blue) beta-cell granules using nLC-MS/MS analysis. Shown is the alignment o1f individual peptides (each line) with the human insulin B:1-30 segment. Data summarizes results from four independent runs using human islets from three individual donors. b, An MS spectrum showing a sequence representing human insulin B:11-30 identified in the 5k granules. The cysteinylation on the 19th position is noted.
Extended Data Figure 5
Extended Data Figure 5. Analysis of insulin peptides secreted from islets upon glucose challenge
a, Insulin secretion assay was performed as described in Fig. 3a–c, except that the Complete Protease Inhibitor cocktail (Sigma) was added during the 25 mM glucose challenge. The supernatants were then collected for the competitive ELISA assay. Data (mean ± s.e.m) are from two independent experiments. b, MS spectra of four secreted peptides that contain the B:12-20 and/or B:13-21 epitope as listed in Fig. 3e. Secreted B:1-30 sequences are identical to those in Extended Data Fig. 3a, and B:9-23 and B:11-23 share identical sequences with those in Extended Data Fig. 3b. c, An MS spectrum of the secreted insulin B:15-23 MHC-I (Kd)-binding peptide. d, An MS spectrum of the secreted insulin A:14-20 MHC-I (Db)-binding peptide. e, An MS spectrum showing a representative B-C spanning peptide (B25-C23).
Extended Data Figure 6
Extended Data Figure 6. T cell responses to B:9-23-associated peptides
Responses (mean ± s.e.m) of three insulin-reactive T cell hybridomas to insulin peptides associated with the 9-23 region of the B-chain as identified in Fig. 3e. The C3g7 cells were used as APCs.
Extended Data Figure 7
Extended Data Figure 7. Characterization of circulating B:9-23 and its localization into lymphoid organs
a, Unmodified synthetic B:9-23 (3 pmoles) was spiked into 1 ml PBS, purified by C18 tips, lyophilized, and analyzed by nLC-MS/MS. The data show the appearance of unmodified B:9-23 (left) together with oxidation of the cysteine on the 19th position to cysteic acid (right). b,c, Alexa Fluor 488-conjugated B:9-23 peptide (100 μg) was injected intravenously into 4-week old B6, B6g7 and NOD mice. 1h later, the spleens and thymi were harvested, digested by liberase and DNase, and the binding to splenic and thymic APCs was measured by flow cytometry. b, Representative FACS plots showing the binding of B:9-23 to splenic XCR1+ and Sirpα+ DC subsets as well as the B cells (upper). The bar graph summarizes cumulative results from individual mice (each point) pooled from three independent experiments. ns, not significant; **, P < 0.05; ***, P < 0.01; ****, P < 0.005, two-tailed unpaired Student’s t-test. c, Representative FACS plots showing the binding of B:9-23 to thymic XCR1+ and Sirpα+ DC subsets as well as to the CD45 cells expressing MHCII. Data (mean ± S.D) were calculated using five individual mice per strain from two independent experiments.
Extended Data Figure 8
Extended Data Figure 8. RNAseq analysis of 8F10 T cells developed in NOD or B16A hosts
a, Representative FACS plots (upper) showing the sorting strategy and the level of recovery of the 8F10 T cells from iLNs of NOD or B16A recipient mice 6 weeks post BM chimera. The scatter plot (lower) shows the percentage of recovered 8F10 T cells among total CD4 T cells from four independent experiments. ns, not significant; two-tailed paired Student’s t-test. b, Biological pathways that are significantly enriched in the 8F10-NOD versus 8F10-B16A samples using GSEA and Hallmark database. c, Heatmaps of all the enriched genes in individual metabolism pathways depicted in Fig. 4c.
Extended Data Figure 9
Extended Data Figure 9. 8F10 T cells exhibit an effector but not anergy or exhaustion phenotype at the transcription level during peripheral antigen recognition
a, Heat maps showing all the enriched genes of the three immunological pathways illustrated in Fig. 4d. b, Enrichment plots of GSEA performed on differentially expressed genes in 8F10 T cells from NOD-iLN versus B16A-iLN condition using datasets characterizing CD4 T cell anergy and CD8 T cell tolerance.
Extended Data Figure 10
Extended Data Figure 10. Functional analysis of 8F10 T cells developed in NOD or B16A hosts
BM chimera was constructed as in Fig. 4a, and the T cells were examined after 6 (a-c) or 9 (d-f) weeks. (a, b, d, e) Bulk CD4+ T cells were purified from iLNs of individual NOD or B16A mice (3/group) by two rounds of MACS negative selection. For examining cytokine repertoire (a, d), half of the individual T cell samples were combined. The rest were kept as individual samples, labelled with CFSE (1.5 μM), and used for measuring cell proliferation (b, e). In either case, T cells were mixed with NOD.Rag1−/− splenocytes (1:2 ratio) and stimulated with B:9-23 for 16 (a, d) or 72 (b, e) hours. a, Representative FACS plots showing intracellular cytokine staining of the 8F10 T cells from NOD-iLN or B16A-iLN, after stimulation with B:9-23 for 16h (Brefeldin A was added for the last 4h). Production of IL-4, IL-17A, IL-5, and IL-10 was not detected. Data are representative of two independent experiments with 3 mice combined per experiment. b, Representative FACS plots (upper) showing CFSE dilution of the 8F10 T cells stimulated by B:9-23 or the control HEL11-25 peptide for 72h. The results of 6 individual mice from 2 independent experiments were summarized in the Box and whiskers plot (lower). **, P < 0.01, two-tailed unpaired Student’s t-test. c, Representative FACS plots showing ex vivo surface staining of FR4 and CD73 as well as CD39 and TIGIT on endogenous CD4+ or 8F10 T cells in the iLNs of NOD or B16A mice. Data are representative of three individual mice analyzed in two independent experiments. d–f, Experiments were performed in week 9 following the procedures described in a–c. The data (d–f) are from a single experiment.
Figure 1
Figure 1. Peripheral insulin presentation is systemic, epitope-specific, and occurs physiologically
a, Summary of the antigen-specific T cells examined. b, The scheme of the two-photon imaging model. The panels (c–i) show mean track velocities (μm/min) of: c, 10E11 and WT CD4 T cells in recipients given the indicated amounts of HEL. d, e, 8F10 and WT CD4 T cells in NOD (d) or B16A (e) recipients. f, 8F10 and WT CD4 T cells in NOD mice after surgical removal of the pLNs (pLNrem) or control surgery (sham). g, 8F10 and 10E11 CD4 T cells in B6g7 recipients 24h post transfer. h, i, 4F7 and WT (h) or 8F10 and WT (i) CD4 T cells in NOD mice infused with S961 or PBS. Data are pooled results from at least three independent experiments. Each dot represents individual T cell tracks, and the bar denotes the mean. ns, not significant; **, P < 0.001; ****, P < 0.0001; one-way ANOVA with Sidak’s multiple comparisons test.
Figure 2
Figure 2. Intrinsic generation of insulin peptides in beta-cell granules
a, b, Immunofluorescence microscopy of isolated islets stained for B:9-23 (a) or B:1-30 (b), as well as CD11c and insulin. Data are representative of 50 islets per group in three independent experiments. c, Immunogold electron microscopy showing anti-B:1-30 (large gold) and anti-insulin (small gold) in a representative beta-cell. A representative granule that contains both B:1-30 and insulin (d) or insulin only (e) is depicted. The arrowhead in (d) denote the B:1-30 peptide. Data are representative of 317 granules analyzed in three independent experiments. f, Competitive ELISA showing quantification of insulin, B:1-30 and B:9-23 in granules isolated by 5,000 xG (5k) or 25,000 xG (25k) centrifugation; islets were from B6g7 mice. Each line represents one paired experiment using 4–8 mice. ns, not significant; *, P < 0.05, **, P < 0.01; two-tailed paired Student’s t-test. g, Peptide coverage of insulin B-chain by sequences identified in 25k (red) and 5k (blue) beta-cell granules using nLC-MS/MS analysis. Shown is the alignment of individual peptides (each line) with the insulin-2 B:1-30 segment. Data are from four independent analyses using islets from 8–10 1mice per strain. h, Log2 peak area showing the relative abundance of individual insulin B-chain peptides (purple) identified in the 25k and 5k granules among all the insulin peptides including the C-peptides (box). The dashed-line boxes denote B:1-30 with a high abundance.
Figure 3
Figure 3. Secretion of insulin peptides into the circulation upon glucose stimulation
a–c, Competitive ELISA showing quantification of insulin (a), B:1-30 (b) and B:9-23 (c) secreted from islets of B6g7 mice after stimulation with 2.5 mM or 25 mM glucose. Each point represents an independent experiment. ns, not significant; *, P < 0.05, **, P < 0.01; ***, P < 0.005; two-tailed paired Student’s t-test. d, A 10×10 dot plot representing the coverage of insulin peptide sequences identified by nLC-MS/MS in culture supernatants of islets stimulated with 25 mM glucose. Each dot represents 1% coverage of the total. e, Summary of selected insulin peptides containing defined immunogenic epitopes. The underlined epitopes include B:12-20 (red), B:13-21 (blue), B:15-23 (green), and A:14-20 (black). In B–C spanning peptides, the residues of the B-chain were in bold. f, Log2 peak area showing the relative abundance of individual B:9-23-associated peptides (blue), B–C spanning peptides (red) and the A:14-20 peptide (cyan) among all insulin peptides (box). g, The MS spectrum of a peptide sequence identified in mouse urine containing all residues of the insulin B:9-23 peptide with oxidation of the cysteine to cysteic acid (lower case c).
Figure 4
Figure 4. Acquisition of an effector-like phenotype by 8F10 T cells during antigen recognition
a, The scheme of the experimental design for bf. b, Pearson’s correlation matrix showing hierarchical clustering of the 8F10-NOD and 8F10-B16A T cell RNAseq samples. c, GSEA enrichment plots showing a significant correlation (determined by false discovery rate [FDR] q < 0.05) of genes upregulated in the 8F10-NOD samples with four Hallmark datasets associated with metabolism pathways. d, GSEA enrichment plots showing a significant correlation of genes upregulated in the 8F10-NOD samples with three immunological signature datasets depicting T cell activation and effector function. e, A Venn diagram showing the number of overlapping genes of three gene sets in (d). f, Diabetes incidence of NOD.Rag1−/− recipients adoptively transferred with 8F10 T cells isolated from the iLNs of NOD or B16A mice 6 weeks after BM chimera. **, P < 0.005; log-rank test. Data represent cumulative results of three independent transfers.

Comment in

References

    1. Nakayama M, et al. Prime role for an insulin epitope in the development of type 1 diabetes in NOD mice. Nature. 2005;435:220–223. - PMC - PubMed
    1. Unanue ER. Antigen presentation in the autoimmune diabetes of the NOD mouse. Annu Rev Immunol. 2014;32:579–608. - PubMed
    1. Mohan JF, et al. Unique autoreactive T cells recognize insulin peptides generated within the islets of Langerhans in autoimmune diabetes. Nat Immunol. 2010;11:350–354. - PMC - PubMed
    1. Mohan JF, Petzold SJ, Unanue ER. Register shifting of an insulin peptide-MHC complex allows diabetogenic T cells to escape thymic deletion. J Exp Med. 2011;208:2375–2383. - PMC - PubMed
    1. Mohan JF, Calderon B, Anderson MS, Unanue ER. Pathogenic CD4+ T cells recognizing an unstable peptide of insulin are directly recruited into islets bypassing local lymph nodes. J Exp Med. 2013;210:2403–2414. - PMC - PubMed

Publication types

MeSH terms