. 2018 Aug;560(7716):55-60.
doi: 10.1038/s41586-018-0342-5. Epub 2018 Jul 18.

Leukaemia hijacks a neural mechanism to invade the central nervous system

Affiliations

Leukaemia hijacks a neural mechanism to invade the central nervous system

Hisayuki Yao et al. Nature. 2018 Aug.

Abstract

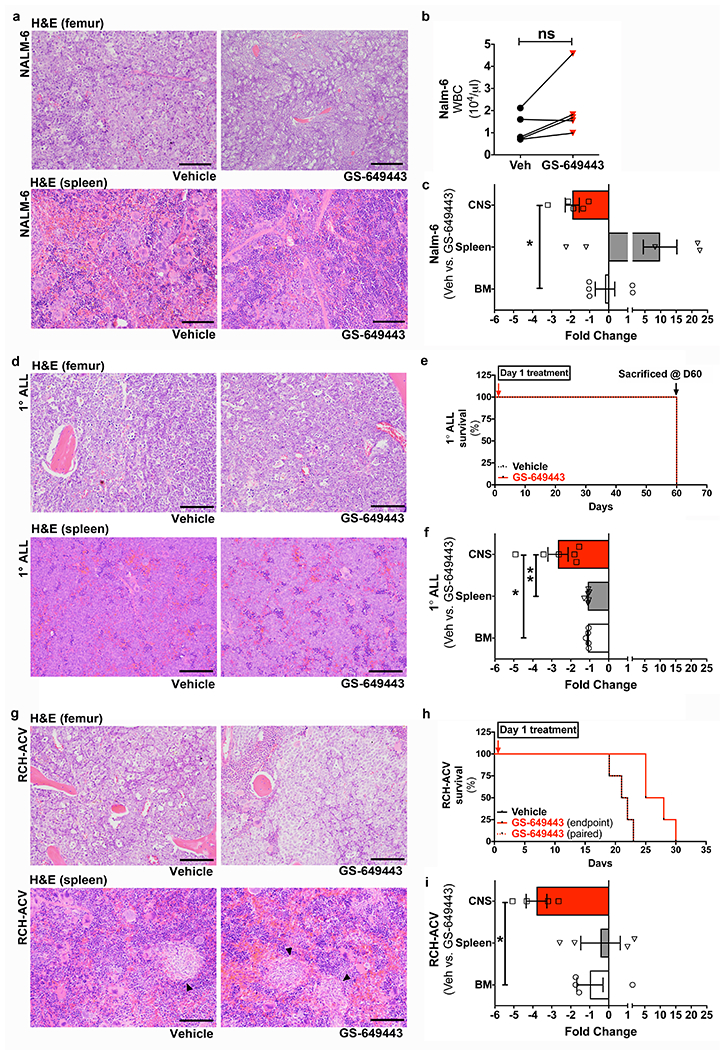
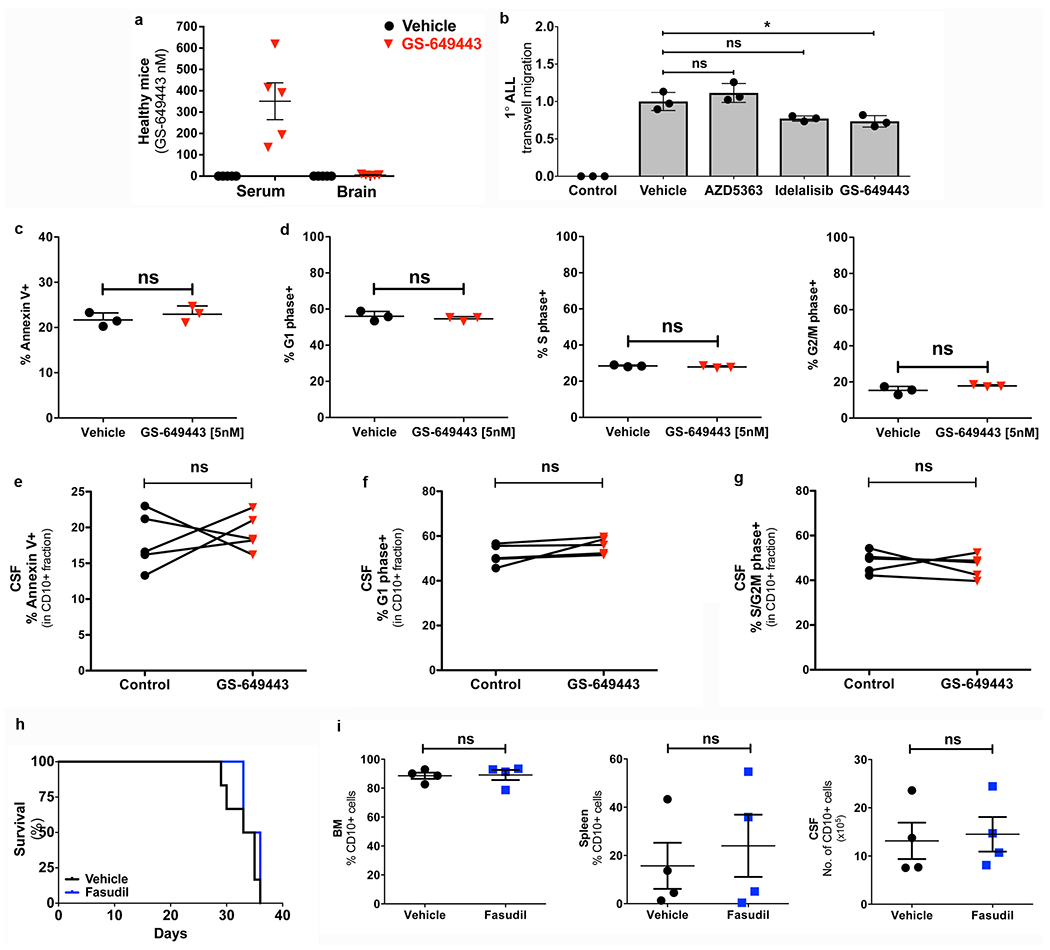
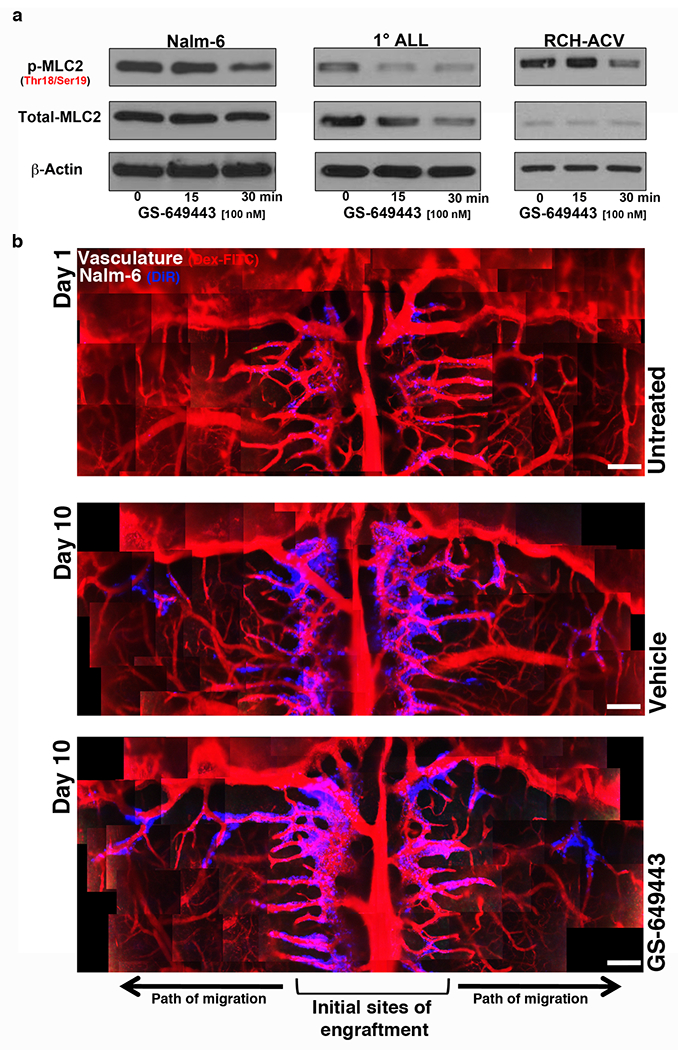
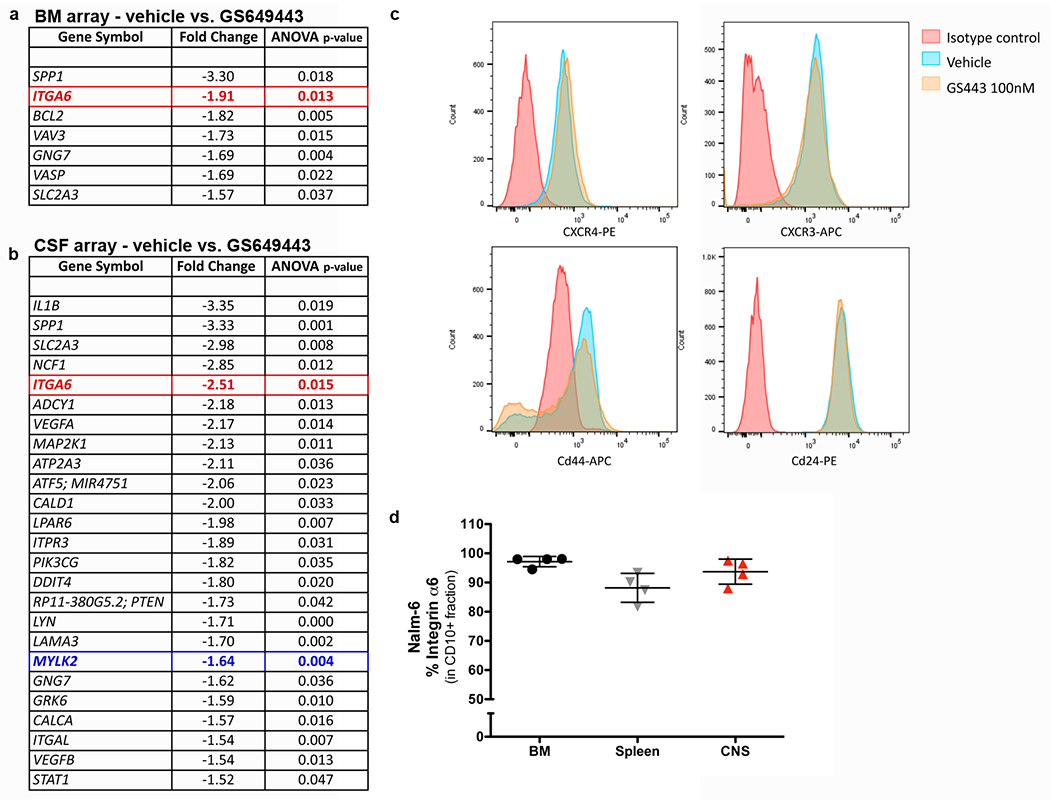
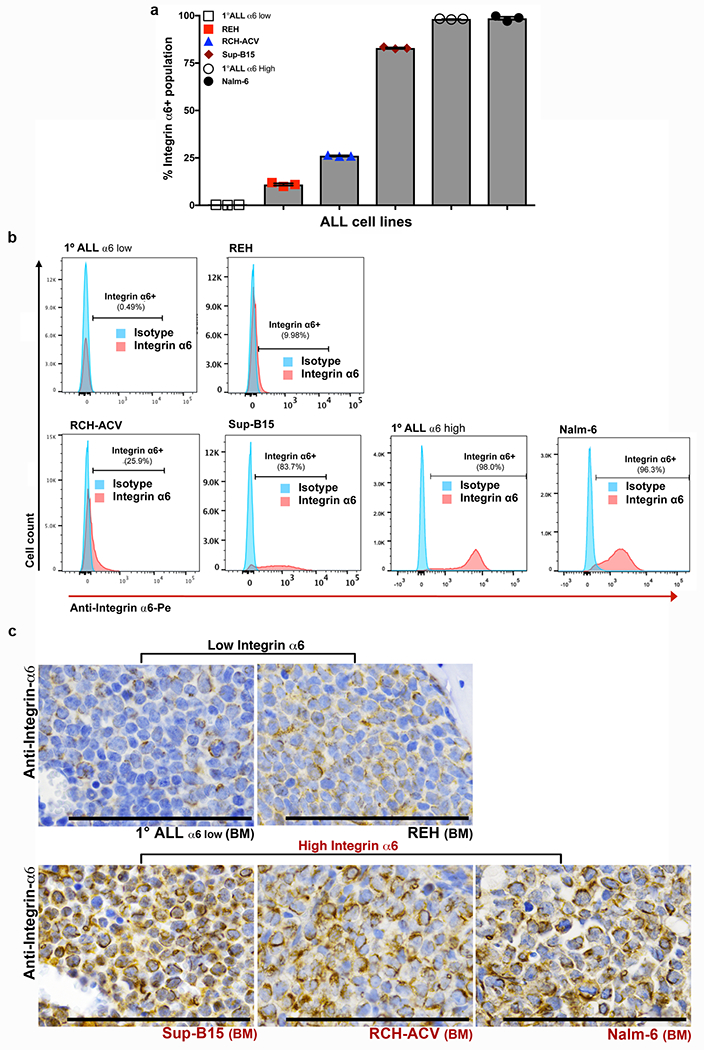
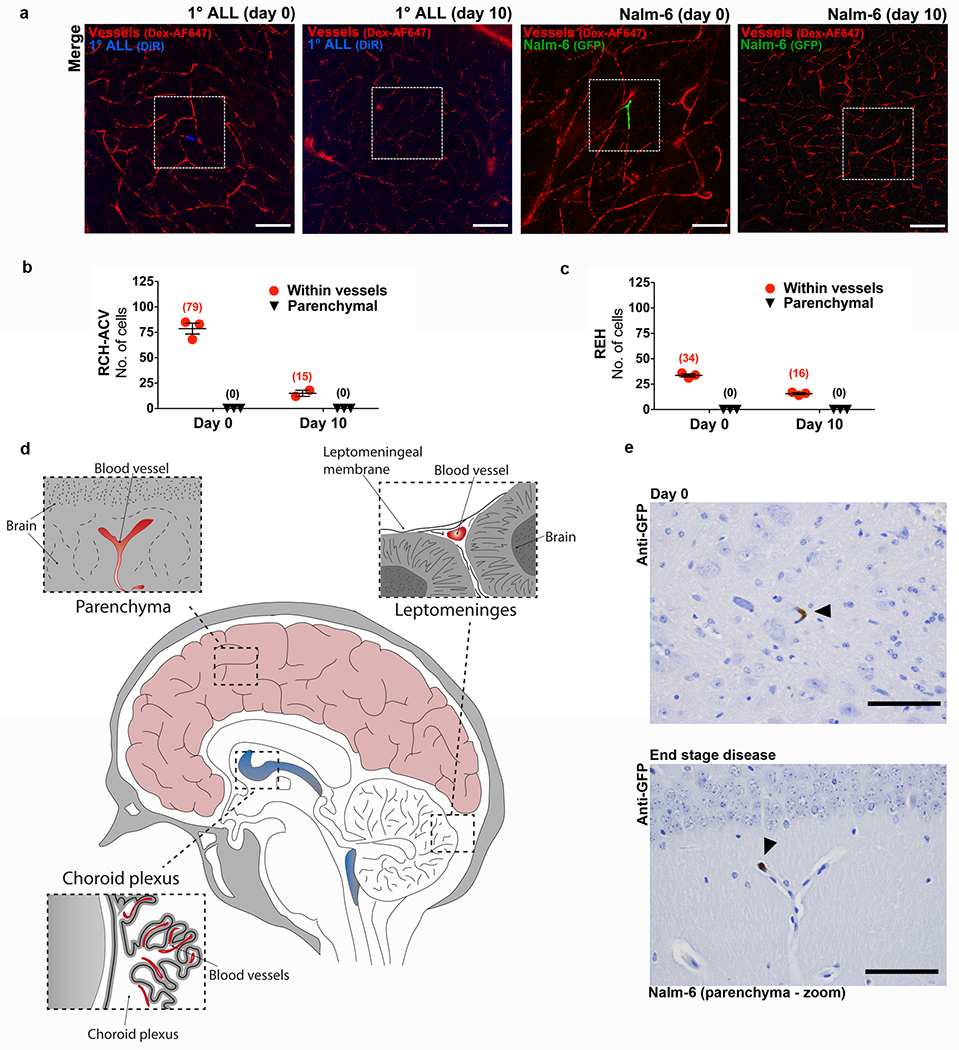
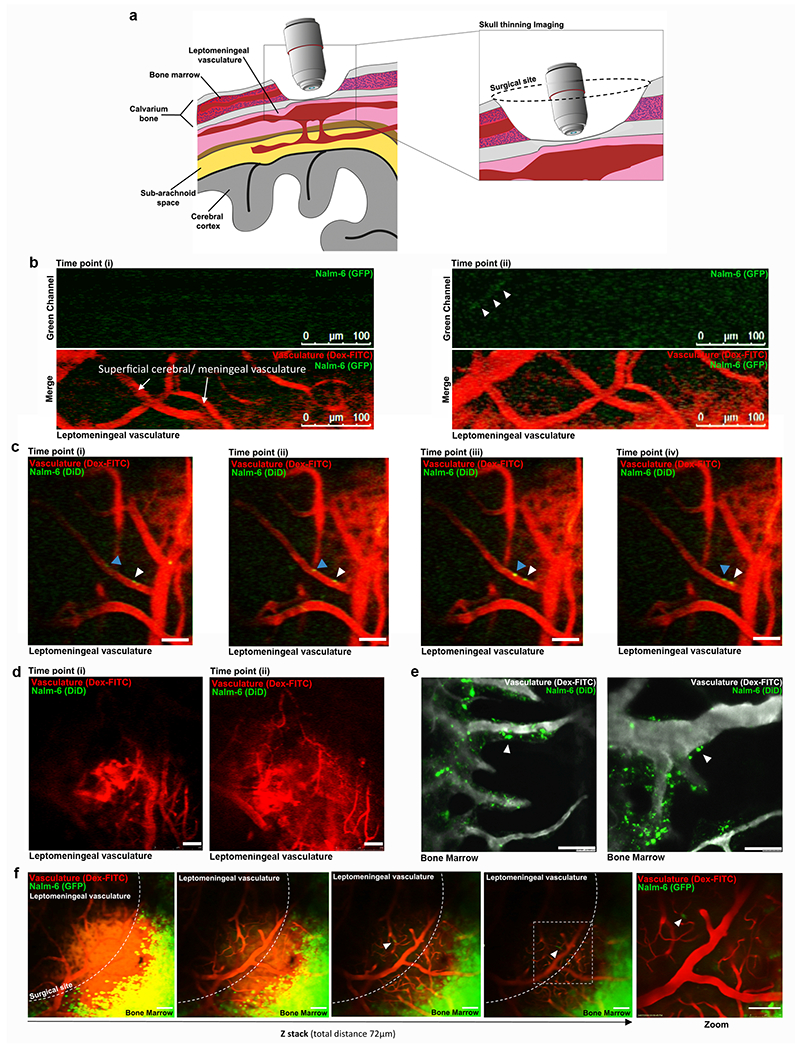
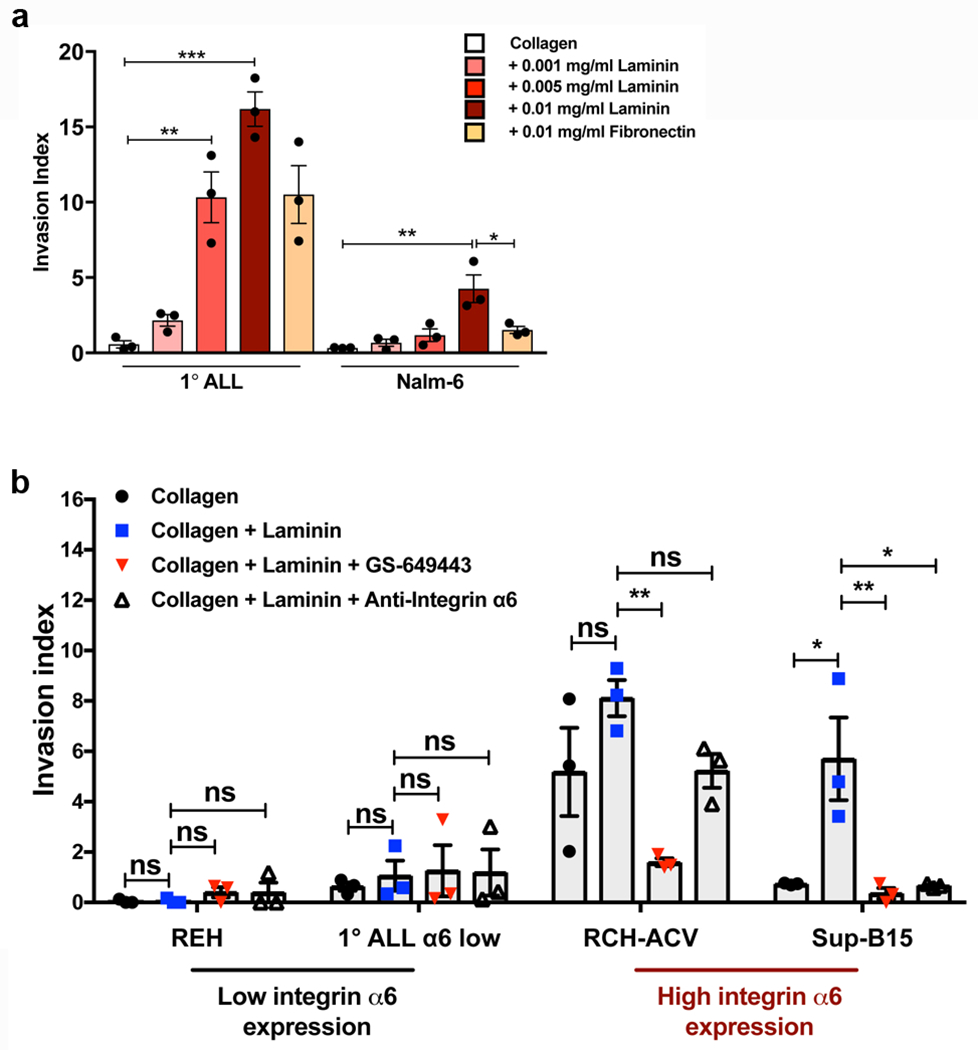
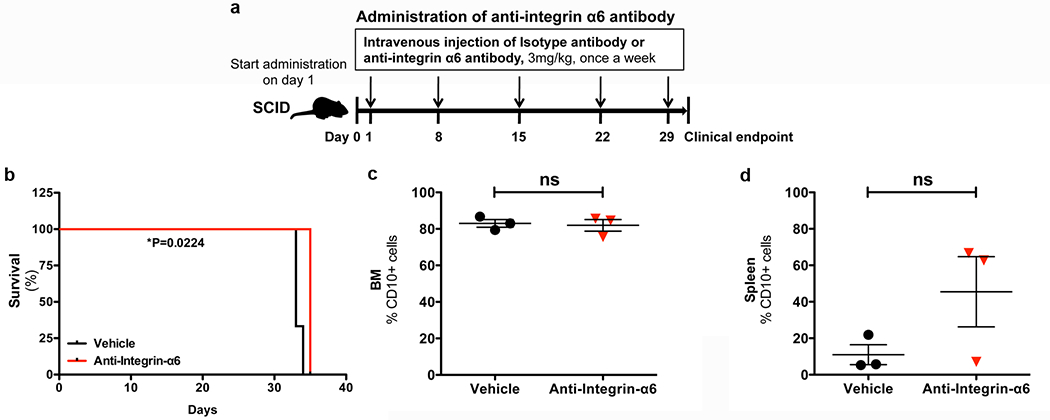
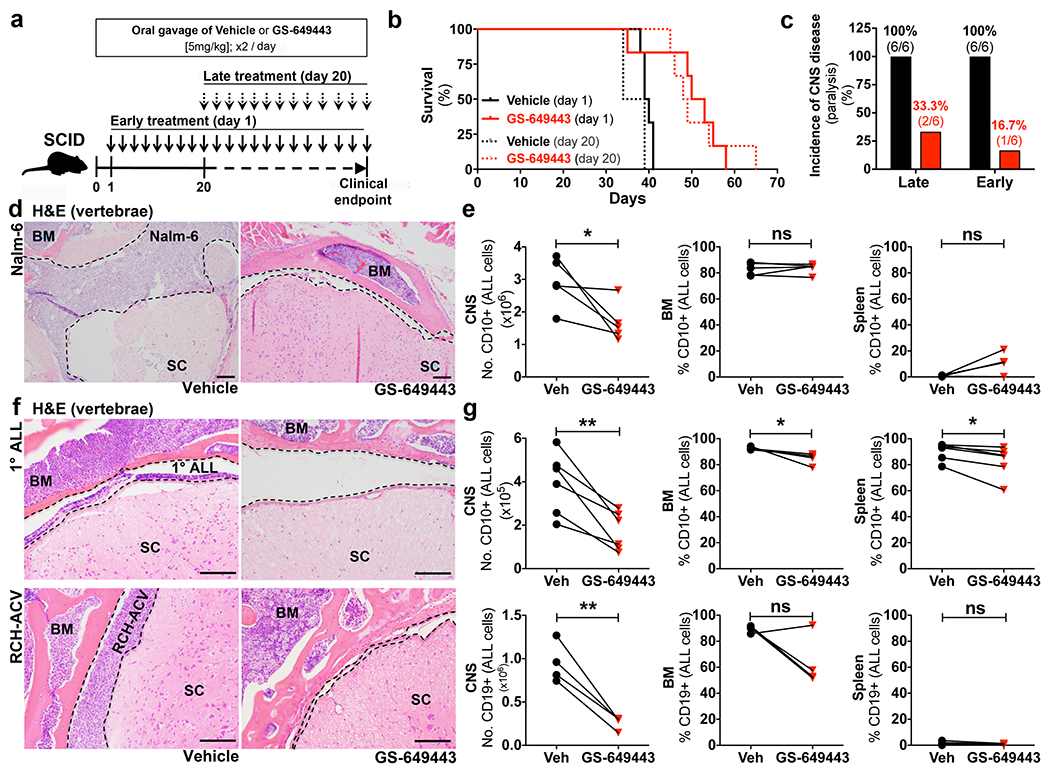
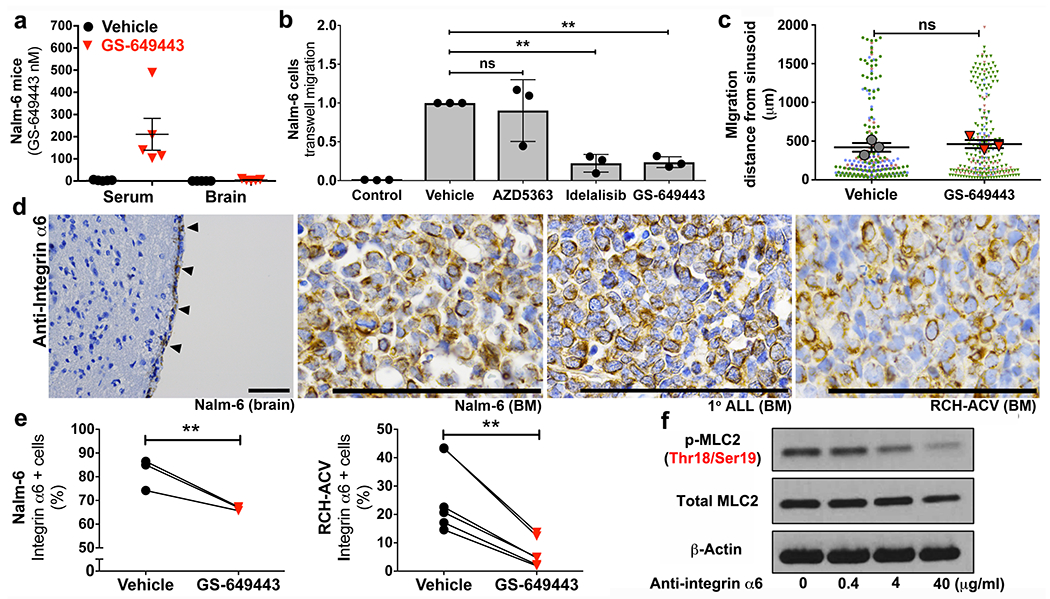
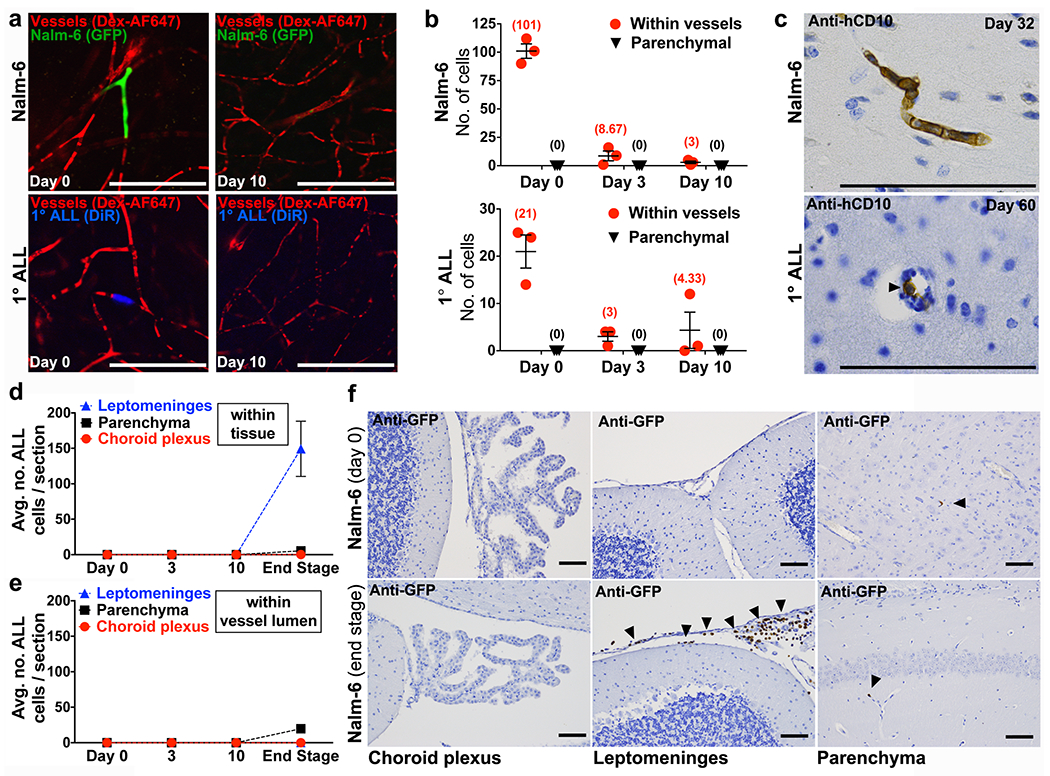
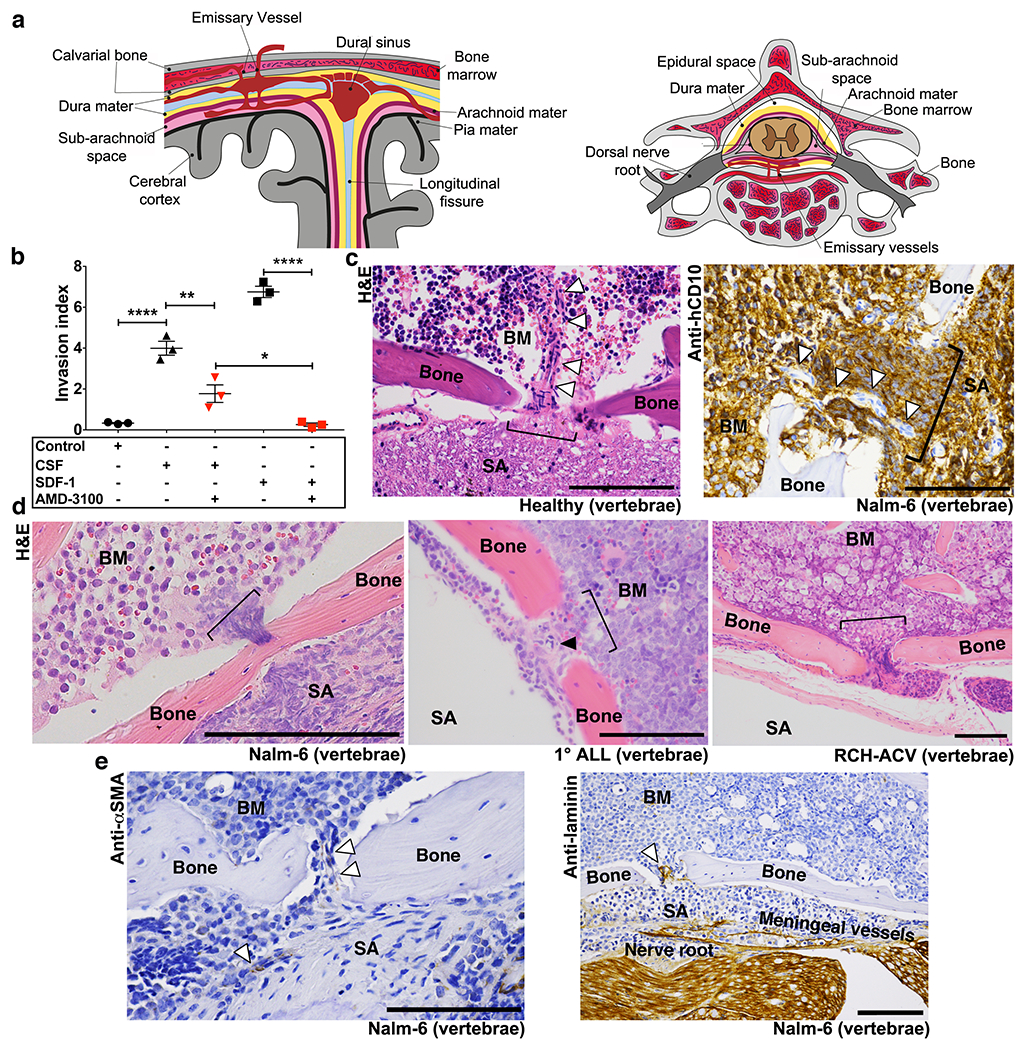
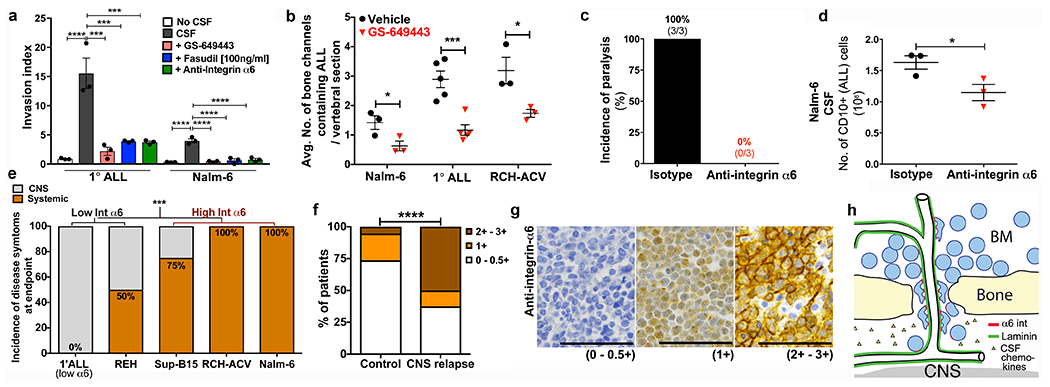
Acute lymphoblastic leukaemia (ALL) has a marked propensity to metastasize to the central nervous system (CNS). In contrast to brain metastases from solid tumours, metastases of ALL seldom involve the parenchyma but are isolated to the leptomeninges, which is an infrequent site for carcinomatous invasion. Although metastasis to the CNS occurs across all subtypes of ALL, a unifying mechanism for invasion has not yet been determined. Here we show that ALL cells in the circulation are unable to breach the blood-brain barrier in mice; instead, they migrate into the CNS along vessels that pass directly between vertebral or calvarial bone marrow and the subarachnoid space. The basement membrane of these bridging vessels is enriched in laminin, which is known to coordinate pathfinding of neuronal progenitor cells in the CNS. The laminin receptor α6 integrin is expressed in most cases of ALL. We found that α6 integrin-laminin interactions mediated the migration of ALL cells towards the cerebrospinal fluid in vitro. Mice with ALL xenografts were treated with either a PI3Kδ inhibitor, which decreased α6 integrin expression on ALL cells, or specific α6 integrin-neutralizing antibodies and showed significant reductions in ALL transit along bridging vessels, blast counts in the cerebrospinal fluid and CNS disease symptoms despite minimally decreased bone marrow disease burden. Our data suggest that α6 integrin expression, which is common in ALL, allows cells to use neural migratory pathways to invade the CNS.


Figures

Extended Data Figure 1:
Extended Data Figure 1:. PI3Kδ inhibition minimally decreases ALL peripheral disease burden.
a, Representative H&E stained histologic sections showing Nalm-6 disease burden in the femoral BM and spleen of mice treated with vehicle or GS-649443, at matched time points (n = 6 mice per treatment group). b, Complete blood counts of vehicle and GS-649443-treated mice, at matched timepoints (paired two-tailed Student’s t-test, n = 5 mice per treatment group, P = 0.2158). c, Fold changes in CNS vs. systemic disease burden in vehicle and GS-649443-treated Nalm-6 mice (mean ± s.e.m., ANOVA with Tukey’s multiple comparison test, n = 5 mice per treatment group, P = 0.0314). d, Representative histologic sections showing 1°ALL disease burden in the femoral BM and spleen of mice treated with vehicle or GS-649443, at matched time points (n = 5 mice per treatment group). e, 1°ALL mice experimental plan. f, Fold changes in CNS vs. systemic disease burden in vehicle and GS-649443-treated 1°ALL mice (mean ± s.e.m., ANOVA with Tukey, n = 5 mice per treatment group, P = 0.00128 (CNS vs. BM), P = 0.0098 (CNS vs. spleen)). g, Representative histologic sections showing RCH-ACV disease burden in the femoral BM and spleen of mice treated with vehicle or GS-649443 (n = 4 mice per treatment group). Arrowheads indicate RCH-ACV blasts. h, Kaplan-Meier survival curve for RCH-ACV mice (two-sided log rank Mantel-Cox, n = 5 mice per treatment group, P = 0.0067). i, Fold changes in CNS vs. systemic disease burden in vehicle and GS-649443-treated RCH-ACV mice (mean ± s.e.m., ANOVA with Tukey, n = 4 mice per treatment group, P = 0.0244). Scale bars, 100 μm.
Extended Data Figure 2:
Extended Data Figure 2:. PI3Kδ inhibition at levels achievable in murine CSF does not affect the apoptotic or cell cycle index of Nalm-6 cells; ROCK inhibition does not alter survival or disease burden in Nalm-6 leukemic mice, though .
a, Serum and brain tissue concentrations of GS-649443 in healthy SCID mice (mean ± s.e.m., n = 5 mice per group). b, Effect of PI3Kδ and Akt inhibition on TW migration of 1° ALL (mean ± s.e.m., ANOVA with Tukey, n = 3 technical replicates per group, P = 0.5228 (vehicle vs AZD5363), P = 0.0549 (vehicle vs. idelalisib), P = 0.0245 (vehicle vs. GS649443). c, Percentage Annexin-V+ Nalm-6 cells following in vitro treatment (72h) with vehicle or GS-649443 (mean ± s.e.m., unpaired two-sided Student’s t-test, n = 3 biological replicates, P = 0.2038). d, Proportion of Nalm-6 cells in the G1, S or G2/M phase of the cell cycle following in vitro treatment (72h) with vehicle or GS-649443 (mean ± s.e.m., unpaired two-sided Student’s t-test, n = 3 biological replicates, P = 0.2216 (G1), P = 0.1405 (S), P = 0.0661 (G2/M)). e, Percentage Annexin-V+ cells in the CD10+ fraction of the CSF in vehicle or GS-649443 treated mice (paired two-sided Student’s t-test, n = 5 mice per treatment group, P = 0.6672). f, Percentage G1 phase cells in the CD10+ fraction of the CSF in vehicle or GS-649443 treated mice (paired two-sided Student’s t-test, n = 5 mice per treatment group, P = 0.1477). g, Percentage S/G2M phase cells in the CD10+ fraction of the CSF in vehicle or GS-649443 treated mice (paired two-sided Student’s t-test, n = 5 mice per treatment group, P = 0.5687). h, Kaplan-Meier survival curves for Nalm-6 mice treated +/− fasudil Rho-kinase (ROCK) inhibitor (two-sided log rank Mantel-Cox, P = 0.2843; n = 6 per treatment group). i, Disease burden (CD10+ cells) at endpoint in the BM, spleen and CSF of vehicle and fasudil treated SCID mice engrafted with Nalm-6 (mean ± s.e.m., paired two-sided Student’s t-test, n = 4 mice per treatment group, P = 0.4534 (BM), P = 0.3119 (spleen), P = 0.8026 (CSF)).
Extended Data Figure 3:
Extended Data Figure 3:. PI3Kδ inhibition reduces myosin light chain activity but does not affect intra-bone marrow migration of Nalm-6 cells.
a, WB of MLC2 levels in ALL following GS-649443 treatment. For gel source data, see Supplementary Figure 1 (Nalm-6: n = 3 independent experiments, 1° ALL: n = 2 independent experiments, RCH-ACV: n = 3 independent experiments). b, Representative intravital microscopy images of ALL cell intra-BM migration over time in vehicle vs. GS-649443-treated mice (n = 3 mice per treatment group). Scale bars, 250 μm.
Extended Data Figure 4:
Extended Data Figure 4:. Microarray analysis of focal adhesion and motility pathway genes in blasts from vehicle vs. GS-649443-treated mice and validation of key candidate.
a-b, Differentially expressed focal adhesion and motility pathway genes identified by microarray analysis of blasts from vehicle vs. GS-649443-treated mice (n = 6 mice per treatment group). c, Microarray negative control validation: Representative flow cytometry analysis of Nalm-6 expression of CXCR4, CXCR3, CD44, CD24 following treatment with vehicle or GS-649443 (n = 3 independent experiments). d, ALL α6 integrin expression in vivo by flow cytometry (mean ± s.e.m, n = 4 mice).
Extended Data Figure 5:
Extended Data Figure 5:. α 6 integrin cell surface expression is variable across a panel of ALL cell lines and primary human ALL cells in vitro and in vivo.
a, Flow cytometry analysis of the percentage α6 integrin+ populations in ALL cell lines and primary ALL cells (mean ± s.e.m., n = 3 independent experiments per cell line). b, Representative flow cytometry histograms of α6 integrin expression in ALL cell lines and primary ALL cells (n = 3 independent experiments). c, Representative α6 integrin IHC of femoral BM from mice engrafted with low α6 integrin-expressing vs. high α6 integrin-expressing ALL cells (α6 low 1° human ALL: n = 6 mice, REH: n = 6 mice, SUP-B15: n = 3 mice, RCH-ACV: n = 6 mice, Nalm-6: n = 10 mice).
Extended Data Figure 6:
Extended Data Figure 6:. ALL cells do not diapedese through brain microvasculature.
a, Representative confocal microscopy images of ALL cells located within brain microvessels at various time points post-intravenous engraftment (n = 3 mice per each cell line and time point, 12 micrographs per mouse). White boxes outline areas shown at higher magnification in Fig. 3a. b, Quantification of the number of ALL cells located in brain parenchymal tissue or within brain parenchymal microvessels at various time points post-intravenous engraftment of RCH-ACV and c, REH ALL cells (mean ± s.e.m., n = 3 biological replicates for each time point). d, Cartoon showing vasculature within the choroid plexus, leptomeninges, and brain parenchyma. e, Representative GFP IHC staining of brain parenchyma of Nalm-6-GFP mice on day 0 post-intravenous engraftment (n = 3 mice) or at end stage disease (n = 5 mice). Images show close-ups of the ALL cells that are highlighted by arrowheads in Fig. 3F. Scale bars, 100 μm.
Extended Data Figure 7:
Extended Data Figure 7:. Nalm-6 cells do not diapedese through the leptomeningeal blood brain barrier.
a, Graphic of thinned skull window and video-rate intravital confocal microscopy approach used to image the leptomeningeal vasculature at various time points post-ALL cell engraftment. b, Representative still images from video-rate intravital microscopy analysis of leptomeningeal and superficial cerebral vasculature (red) at 10 minutes post-intravenous Nalm-6 engraftment (full video presented in supplementary video 1 & 2). Nalm-6 cells (green) are observed in circulation (n = 12 mice imaged on day 0 post-engraftment). c, Series of still images of leptomeningeal and superficial cerebral vasculature at 45 min post-intravenous Nalm-6 engraftment. A Nalm-6 cell is observed adherent to the luminal side of a leptomeningeal vessel (white arrowhead). A second Nalm-6 cell is observed rolling along the luminal wall of a leptomeningeal vessel (blue arrowhead) (see Supplementary Video 3). No diapedesis was observed during the entirety of each 2-4 hour long imaging session on the day of engraftment (n = 12 mice imaged on day 0 post-engraftment). d, Still images of the leptomeningeal and superficial cerebral vasculature 12 days post-Nalm-6 engraftment. No Nalm-6 cells were observed in circulation or within the leptomeningeal tissue (see Supplementary Video 4; n = 4 mice, days 2, 4, 7 and 12 post-engraftment) e, Representative images from intravital confocal microscopy of the calvarial BM at 2 hours post Nalm-6 engraftment. Numerous Nalm-6 cells (white arrowheads) are seen to have diapedesed through the BM vasculature soon after intravenous engraftment (n = 15 mice). f, Series of still images of the Z-plane of the leptomeningeal and superficial cerebral vasculature of a Nalm-6 leukemic mouse at disease endpoint (n = 7 mice, days 37-39 post-engraftment). Nalm-6 cells are observed in circulation (white arrowheads), but no cells are observed to diapedese (see Supplementary Video 5).
Extended Data Figure 8:
Extended Data Figure 8:. ALL cell invasion along laminin matrices is regulated by PI3K signaling and α6 integrin.
a, 1° ALL and Nalm-6 in vitro invasion toward hCSF along collagen, collagen + laminin, or collagen + fibronectin matrices (mean ± s.e.m., ANOVA with Tukey, n = 3 biologically independent experiments, 1° ALL: P = 0.8937 (collagen vs. 0.001mg/ml laminin), P = 0.0020 (collagen vs. 0.005 mg/ml laminin), P < 0.0001 (collagen vs. 0.01 mg/ml laminin), P = 0.0604 (0.01 mg/ml laminin vs. fibronectin), Nalm-6: P = 0.0012 (collagen vs. 0.01 mg/ml laminin), P = 0.0150 (0.01 mg/ml laminin vs. fibronectin). b, Comparative in vitro invasion of low α6 integrin-expressing ALL cells vs. high α6 integrin-expressing ALL cells towards hCSF along laminin matrices and effects of PI3Kδ inhibition or α6 integrin blockade (mean ± s.e.m., ANOVA with Tukey, n = 3 biologically independent experiments, REH: P > 0.9999 (collagen vs. laminin), P = 0.6967 (collagen+laminin vs. collagen+laminin+GS649443), P > 0.9999 (collagen+laminin vs. collagen+laminin+anti-α6), 1° ALL: P = 0.9758 (collagen vs. laminin), P = 0.9974 (collagen+laminin vs. collagen+laminin+GS649443), P = 0.9993 (collagen+laminin vs. collagen+laminin+anti-α6), RCH: P = 0.2446 (collagen vs. laminin), P = 0.0079 (collagen+laminin vs. collagen+laminin+GS649443), P = 0.2549 (collagen+laminin vs. collagen+laminin+anti-α6), SUP-B15: P = 0.0122 (collagen vs. laminin), P = 0.0080 (collagen+laminin vs. collagen+laminin+GS649443), P = 0.0112 (collagen+laminin vs. collagen+laminin+anti-α6). *P < 0.05, ** < 0.01, *** <0.001.
Extended Data Figure 9:
Extended Data Figure 9:. Anti-α6 integrin blocking antibody treatment prolongs survival, but does not alter disease burden in the BM or spleen of Nalm-6 leukemic mice.
a, α6 integrin neutralizing antibody treatment schema. b, Kaplan-Meier survival curves for Nalm-6 mice treated +/− anti-integrin-α6 blocking antibodies (two-sided log rank Mantel-Cox, n = 3 mice per treatment group, P=0.0224). c-d, Disease burden at endpoint in the BM and spleen of vehicle and anti-integrin α6 antibody-treated Nalm-6 leukemic mice (mean ± s.e.m., paired two-sided Student’s t-test, n = 3 mice per treatment group, P = 0.7874 (BM), P = 0.1595 (spleen)).
Figure 1:
Figure 1:. PI3Kδ inhibition blocks ALL CNS progression in vivo.
a, GS-649443 treatment schema. b, Kaplan-Meier survival curves (two-sided log rank Mantel-Cox, n = 6 mice per treatment group, Late treatment: P=0.0039, Early: P = 0.0146). c, Incidence of hind limb paralysis at time of sacrifice (n = 6 mice per treatment group). d, Nalm-6 ALL in subarachnoid space (dashed line) of spinal cord (SC) (n = 14 treated mice, 7 vehicle mice). e, Disease burden in vehicle and GS-649443-treated Nalm-6 mice sacrificed at matched time points (paired two-sided Student’s t-test, n = 5 mice per treatment group, P = 0.0473). f, Primary human and RCH-ACV ALL in subarachnoid space of SC (1° ALL: n = 6 treated mice, 7 vehicle mice, RCH-ACV: n = 4 mice per treatment group). g, Disease burden in vehicle or GS-649443-treated 1° human and RCH-ACV ALL-engrafted mice (paired two-sided Student’s t-test, 1° human: n = 5 mice per treatment group, RCH-ACV: n = 4 mice per treatment group, * P = <0.05, ** < 0.01). Scale bars, 100μm.
Figure 2:
Figure 2:. PI3Kδ regulates aspects of ALL cell motility and expression of the laminin receptor α6 integrin.
a, Serum and brain tissue concentrations of GS-649443 in leukemic mice (mean ± s.e.m., n = 5 mice per group). b, Effect of PI3Kδ and Akt inhibition on TW migration of ALL (mean ± s.e.m., ANOVA with Tukey, n = 3 biologically independent experiments, *P < 0.05, ** < 0.01). c, Nalm-6 migration in calvarial BM over 10 days in vehicle vs. GS-649443-treated mice (mean of the sample means ± s.e.m., n = 3 mice per treatment group, data points from individual mice distinguished by color, paired two-sided Student’s t-test). d, ALL α6 integrin expression in vivo by IHC (ALL in meninges, arrowheads) (Nalm-6 brain: n = 7 mice, Nalm-6 BM: n = 12 mice, 1° ALL BM: n = 4 mice, RCH-ACV BM: n = 11 mice). e, Flow cytometry of ALL α6 integrin expression following in vitro treatment with PI3Kδ inhibitors (paired two-sided Student’s t-test, Nalm-6: n = 3 biological replicates, P = 0.0088, RCH-ACV: n = 6 biological replicates, P = 0.0026). f, WB of MLC2 levels in Nalm-6 following treatment with α6 integrin neutralizing antibodies (n = 3 independent experiments). For gel source data, see Supplementary Figure 1. Scale bars, 100μm.
Figure 3:
Figure 3:. ALL cells fail to breach the BBB.
a, Representative confocal microscopy images and b, quantification of ALL cells located within brain microvessels or parenchyma at various time points post-intravenous engraftment (mean of sample means (cells per mouse) ± s.e.m., n = 3 mice per each cell line and time point, 12 micrographs per mouse). c, ALL cells (arrowhead) detected inside lumen of brain parenchymal vessels by IHC (Nalm-6: n = 4 mice, 1° ALL: n = 10 mice). e, Quantification of Nalm-6-GFP+ ALL cells within tissue or d, inside the lumen of blood vessels in the choroid plexus, leptomeninges, or brain parenchyma at various time points post-intravenous engraftment (mean of sample means (cells per section per mouse) ± s.e.m.; day 0, n = 3 mice, 19 sections; day 3, n = 3 mice, 20 sections; day 10, n = 3 mice, 17 sections; end stage disease, n = 5 mice, 46 sections). f, Representative GFP IHC staining of choroid plexus, leptomeninges, and brain parenchyma from Nalm-6-GFP mice on day 0 post-intravenous engraftment (n = 3 mice) or at end stage disease (n = 5 mice). Arrowheads indicate Nalm-6 ALL cells within leptomeninges or inside the lumen of brain parenchymal microvessels. Scale bars, 100μm.
Figure 4:
Figure 4:. ALL cells passage to the CNS subarachnoid space along the abluminal surface of laminin+ BM emissary vessels.
a, Anatomy of emissary vessels in calvarial and vertebral BM. b, ALL in vitro invasion toward hCSF or CXCL12 +/− CXCR4 blockade (mean ± s.e.m., ANOVA with Tukey, n = 3 biological replicates, * P <0.05, ** < 0.01, **** <0.0001). c, Bone channel (bracket) containing emissary vessel (arrowheads) connecting vertebral BM with subarachnoid space (SA) in histologic sections from healthy (n = 4 mice) and Nalm-6 (CD10+) leukemic mice (n = 3 mice). d, ALL in transit to CNS through bone channels (Nalm-6: n = 27 mice, 1° ALL: n = 13 mice, RCH-ACV: n = 10 mice). e, αSMA (vascular smooth muscle, n = 26 mice) and laminin (n = 7 mice) IHC staining of emissary vessels. Scale bars, 100μm.
Figure 5:
Figure 5:. ALL cells use α6 integrin-laminin dependent interactions to invade the CNS.
a, ALL invasion toward hCSF along laminin/collagen matrices following treatment with α6 integrin neutralizing antibodies, fasudil Rho-kinase inhibitor (at MLCK inhibitory dose), or GS-649443 (mean ± s.e.m., ANOVA with Tukey, n = 3 biological replicates, ***P < 0.001, **** < 0.0001). b, Frequency of ALL infiltrates within bony channels of spine in vehicle vs. GS-649443-treated mice (mean ± s.e.m., unpaired two-sided Student’s t-test, Nalm-6: n = 3 vehicle mice, 4 treated mice, minimum 24 vertebral sections per mouse, P = 0.0198, 1° human ALL: n = 5 mice per treatment group, minimum 10 vertebral sections per mouse, P = 0.0009, RCH-ACV: n = 4 mice per treatment group, minimum 8 vertebral sections per mouse, P = 0.0149). c, Incidence of hind limb paralysis at time of sacrifice. d, CNS disease burden in isotype control and α6 integrin neutralizing antibody-treated mice sacrificed at matched time points (mean ± s.e.m., unpaired two-sided Student’s t-test, n = 3 mice per treatment group, P = 0.0234). e, Incidence of CNS disease symptoms (hindlimb paralysis) at clinical endpoint in mice engrafted with ALL cells expressing low vs. high levels of integrin α6 (Fisher’s exact test, 1° human ALL α6 low, REH and RCH-ACV: n = 6 mice each, SUP-B15: n = 3 mice, Nalm-6: n = 10 mice, P = 0.0008). f, Association between BM blast α6 integrin expression and CNS disease relapse in ALL patients (Freeman-Halton extension of Fisher’s exact test, No CNS relapse n = 18 patients, CNS relapse n = 8 patients, P = 0.0282). g, Representative α6 integrin IHC of patient BM biopsy samples (0-0.5+: n = 17 patients, 1+: n = 4 patients, 2+-3+: n = 5 patients). h, Schematic of ALL CNS invasion model. Scale bars, 50μm.

Comment in

References

    1. Garcia-Manero G, Kantarjian HM & Schiffer CA in Holland-Frei Cancer Medicine (eds Kufe DW et al.) (BC Decker, 2003).
    1. Surapaneni UR et al. Central nervous system relapse in adults with acute lymphoblastic leukemia. Cancer 94, 773–779 (2002). - PubMed
    1. Vanhaesebroeck B, Guillermet-Guibert J, Graupera M & Bilanges B The emerging mechanisms of isoform-specific PI3K signalling. Nat Rev Mol Cell Biol 11, 329–341 (2010). - PubMed
    1. Lanutti BJ et al. CAL-101, a p110delta selective phosphatidylinositol-3-kinase inhibitor for the treatment of B-cell malignancies, inhibits PI3K signaling and cellular viability. Blood 117, 591–594 (2011). - PMC - PubMed
    1. Furman RR et al. Idelalisib and rituximab in relapsed chronic lymphocytic leukemia. N Engl J Med 370 (2014). - PMC - PubMed

MeSH terms