. 2018 Aug;560(7716):117-121.
doi: 10.1038/s41586-018-0340-7. Epub 2018 Jul 18.

The shieldin complex mediates 53BP1-dependent DNA repair

Affiliations

The shieldin complex mediates 53BP1-dependent DNA repair

Sylvie M Noordermeer et al. Nature. 2018 Aug.

Abstract

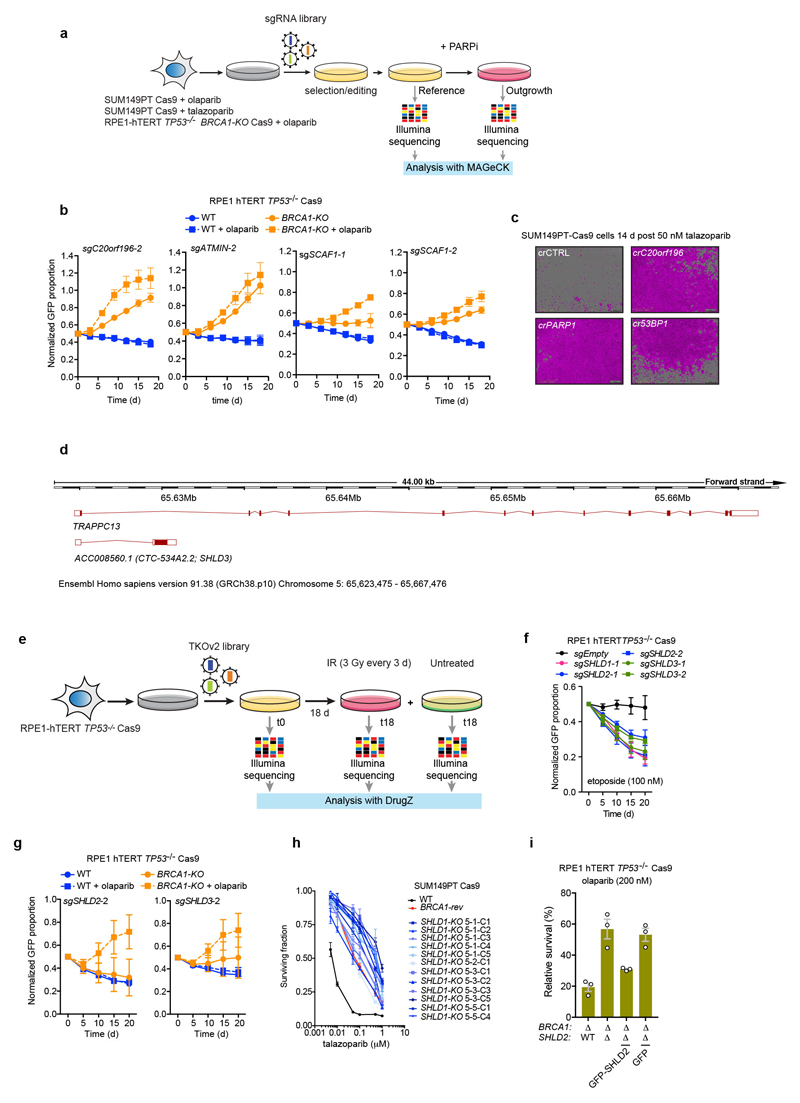
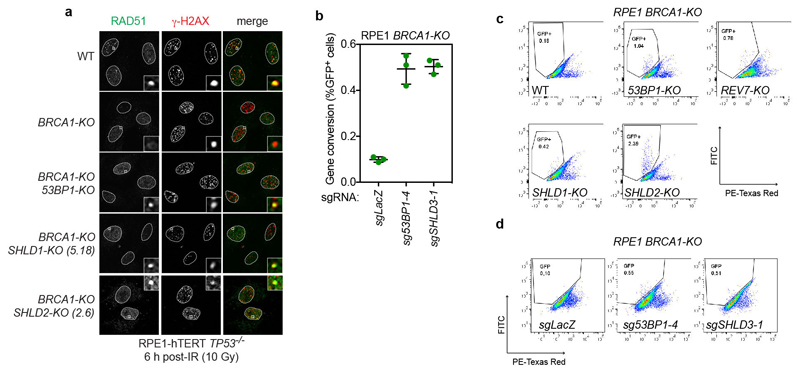
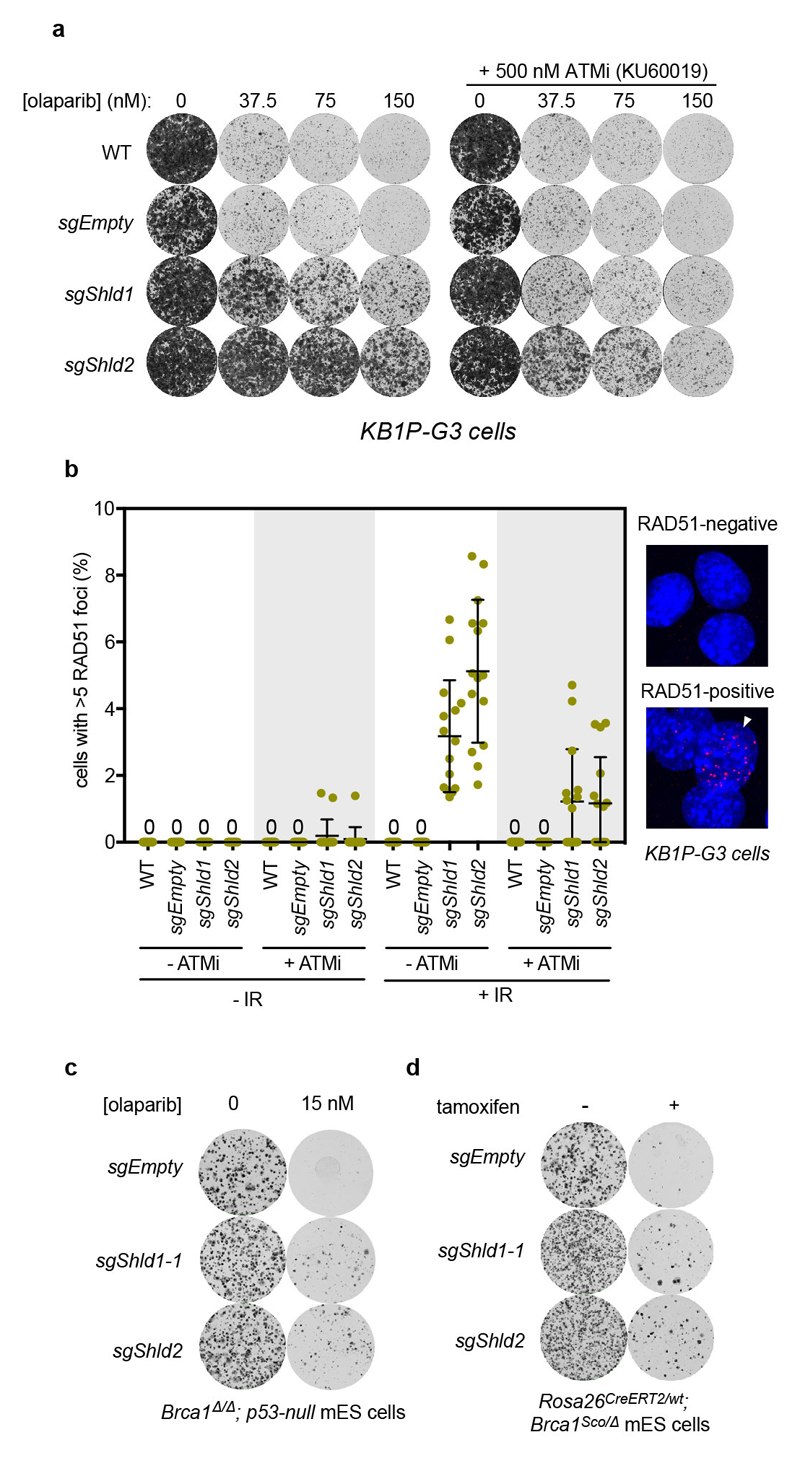
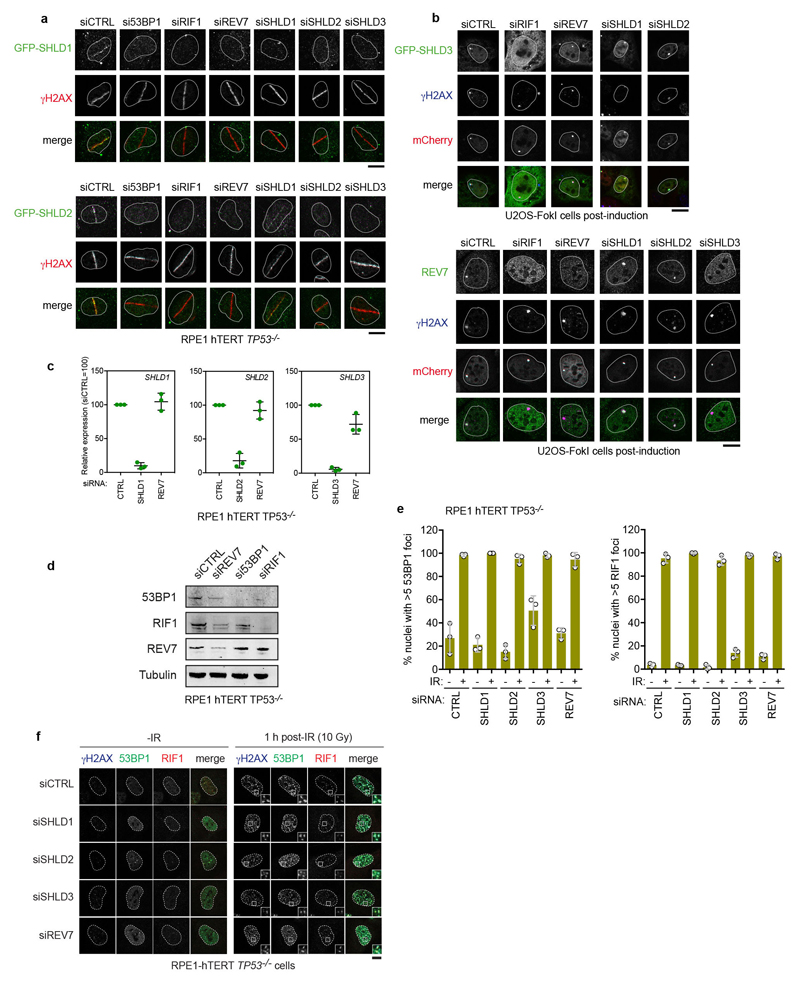
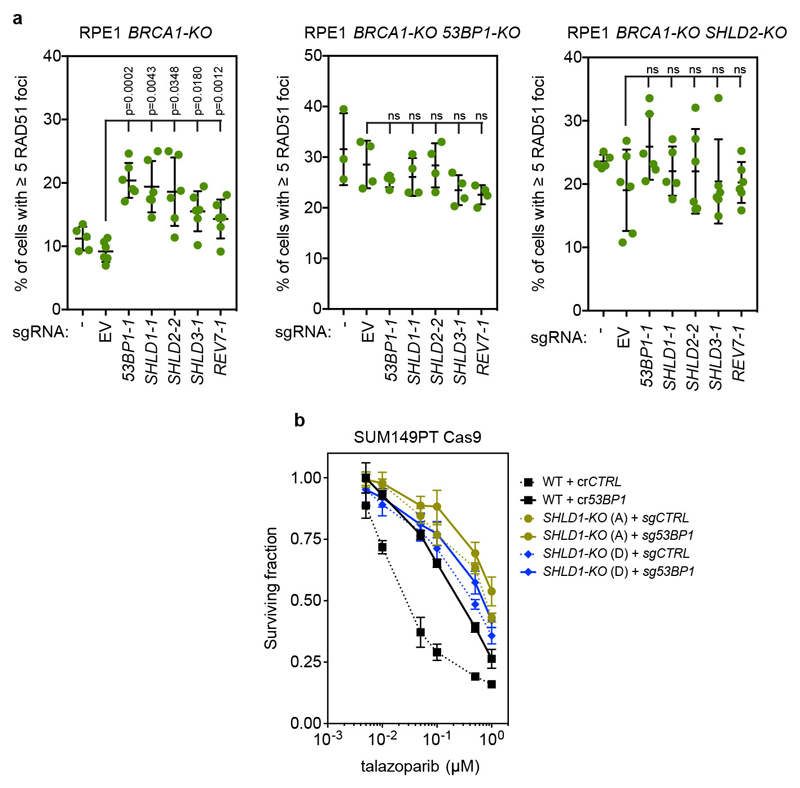
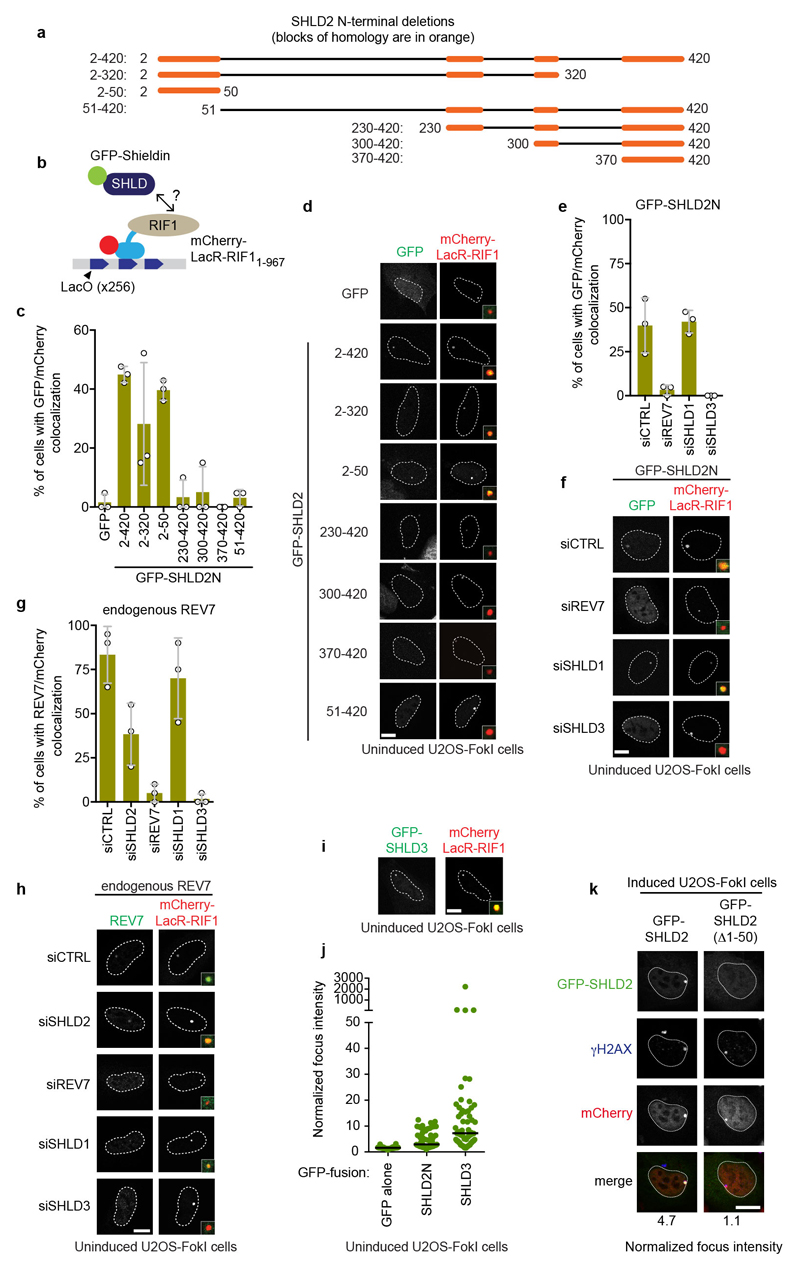
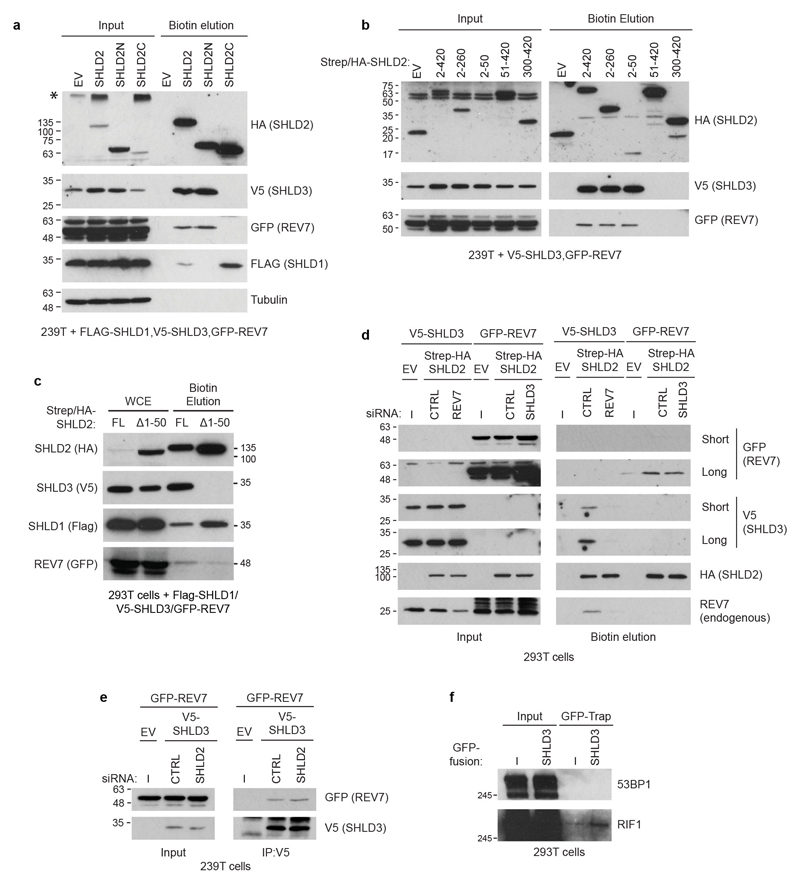
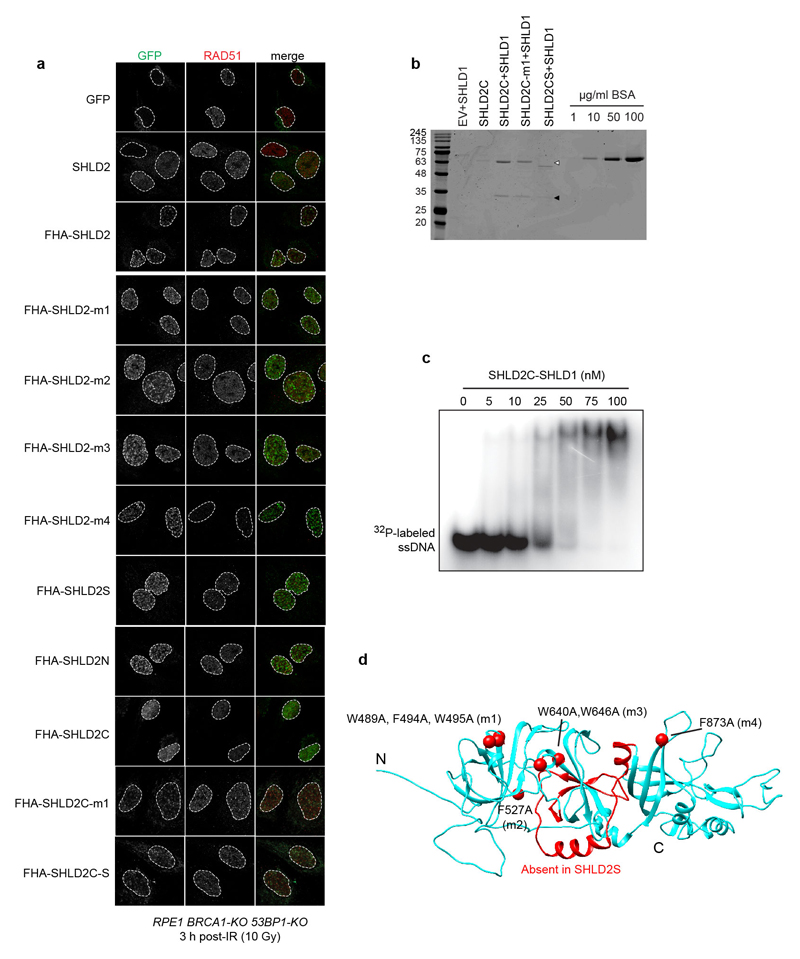
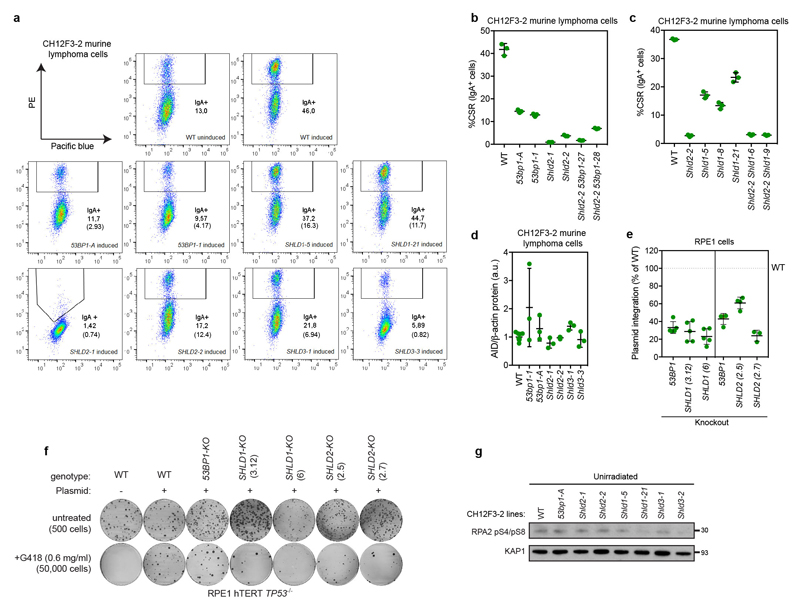
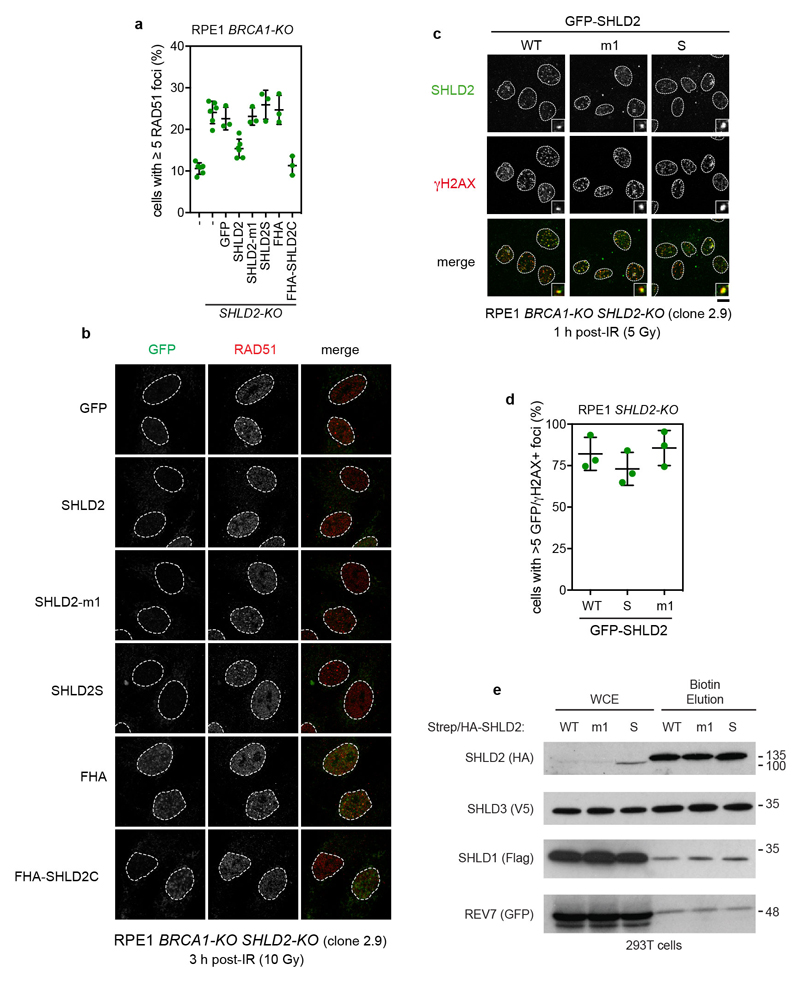
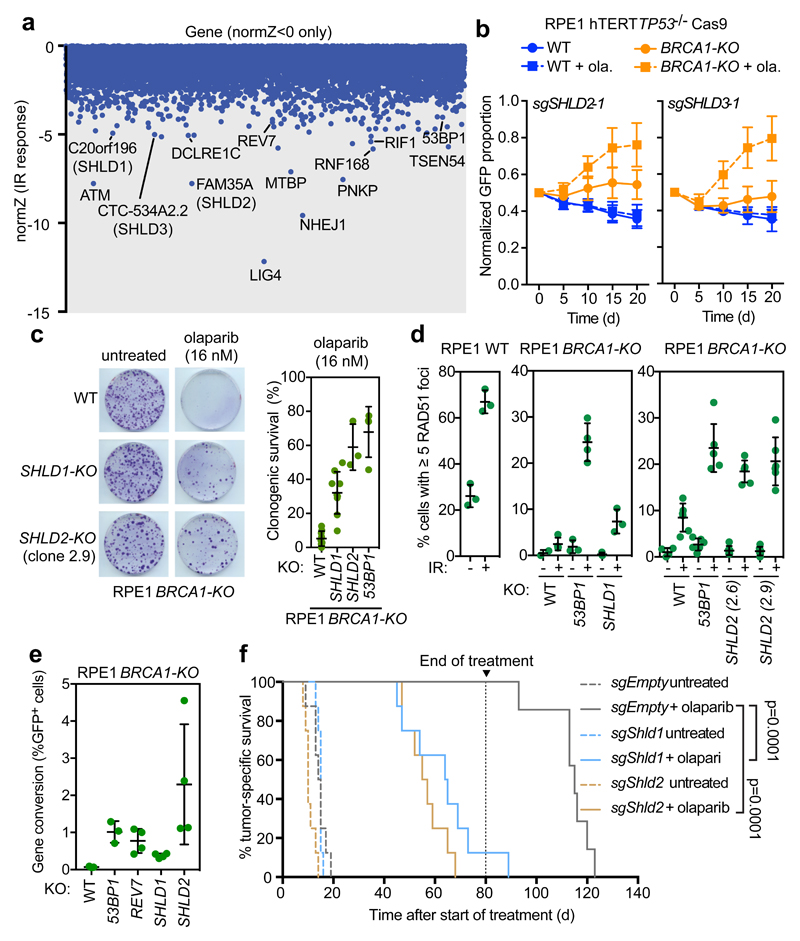
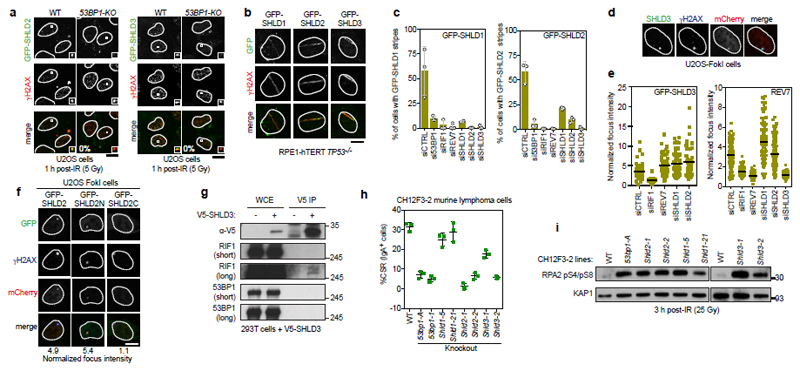
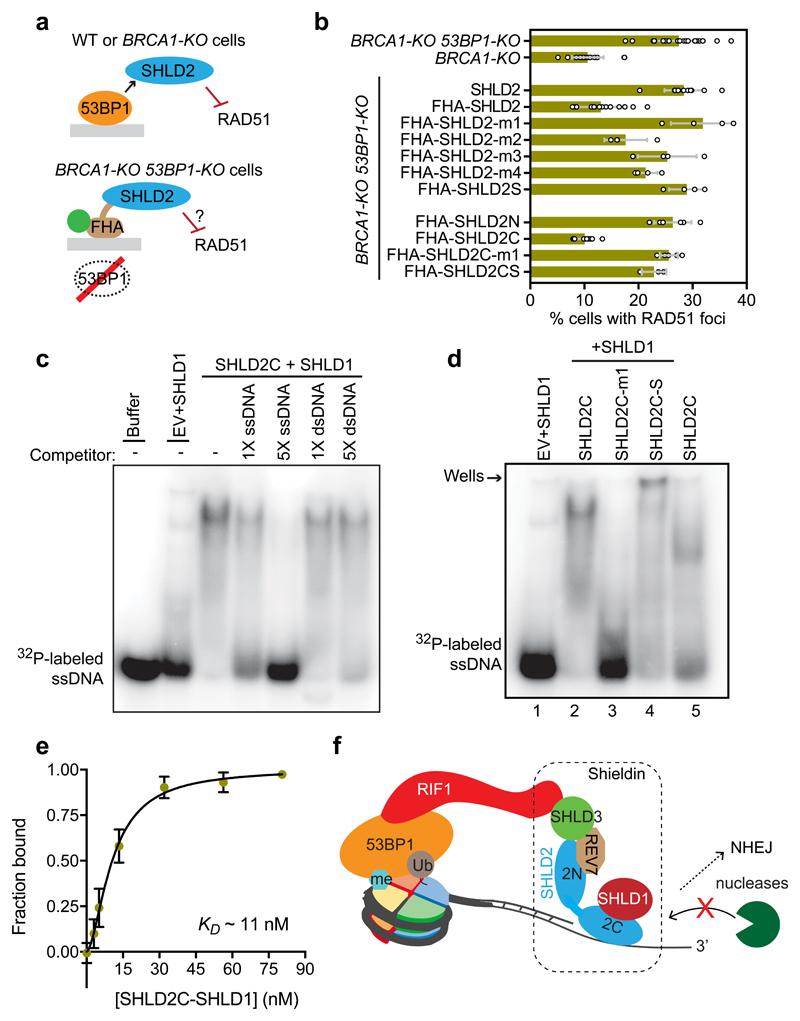
53BP1 is a chromatin-binding protein that regulates the repair of DNA double-strand breaks by suppressing the nucleolytic resection of DNA termini1,2. This function of 53BP1 requires interactions with PTIP3 and RIF14-9, the latter of which recruits REV7 (also known as MAD2L2) to break sites10,11. How 53BP1-pathway proteins shield DNA ends is currently unknown, but there are two models that provide the best potential explanation of their action. In one model the 53BP1 complex strengthens the nucleosomal barrier to end-resection nucleases12,13, and in the other 53BP1 recruits effector proteins with end-protection activity. Here we identify a 53BP1 effector complex, shieldin, that includes C20orf196 (also known as SHLD1), FAM35A (SHLD2), CTC-534A2.2 (SHLD3) and REV7. Shieldin localizes to double-strand-break sites in a 53BP1- and RIF1-dependent manner, and its SHLD2 subunit binds to single-stranded DNA via OB-fold domains that are analogous to those of RPA1 and POT1. Loss of shieldin impairs non-homologous end-joining, leads to defective immunoglobulin class switching and causes hyper-resection. Mutations in genes that encode shieldin subunits also cause resistance to poly(ADP-ribose) polymerase inhibition in BRCA1-deficient cells and tumours, owing to restoration of homologous recombination. Finally, we show that binding of single-stranded DNA by SHLD2 is critical for shieldin function, consistent with a model in which shieldin protects DNA ends to mediate 53BP1-dependent DNA repair.


Conflict of interest statement

Conflict of interest statement

DD and TH are advisors to Repare Therapeutics. CJL is a named inventor on patents describing the use of PARP inhibitors (DK3044221 (T3), ES2611504 (T3), US2014378525 (A1), WO2008020180 (A2), WO2009027650 (A1)) and stands to gain from their use as part of the ICR “Rewards to Inventors” scheme.

Figures

ED Figure 1
ED Figure 1. Supporting data for the identification of the Shieldin complex and its role in the response to genotoxic treatments.
a, Schematic of the PARPi resistance screens. b, Competitive growth assays determining the capacity of the indicated sgRNAs to cause resistance to PARP inhibitors in RPE1 BRCA1-KO cells. Data is presented as the mean fraction of GFP-positive cells ± SEM, normalized to day 0 (n = 3, independent viral transductions). Gene editing efficiencies of the sgRNAs can be found in Supplementary Table 2. Note that we have not been able to obtain TIDE data for the ATMIN-targeting sgRNAs. c, Representative images of SUM149PT-Cas9 cells transfected with indicated crRNAs (see Methods) and exposed to 50 nM talazoparib for 14 d. Purple coloration indicates cells detected by Incucyte live-cell imaging. Scale bar represents 100 μm. The data is a representative set of images from two biologically independent experiments. d, Screenshot of the genomic locus surrounding human CTC-534A2.2 taken from ENSEMBL. e, Schematic of the screen performed in RPE1-hTERT TP53-/- cells stably expressing Cas9 to study genes mediating IR-sensitivity. f-g, Competitive growth assays measuring the capacity of the indicated sgRNAs to cause resistance to etoposide (100 nM) in RPE1 WT cells (f) or PARP inhibitors (16 nM) in RPE1 BRCA1-KO cells (g). Data is presented as the mean fraction of GFP-positive cells ± SD, normalized to day 0 (n = 3, independent viral transductions). Gene editing efficiencies of the sgRNAs can be found in Supplementary Table 2. h, Talazoparib sensitivity in 11 SHLD1-KO SUM149PT clones obtained after co-transfection of tracrRNA and one of four distinct SHLD1 crRNAs (5-1, 5-2, 5-3 or 5-5). Each clone was exposed to talazoparib in a 384-well plate format for five days. As a comparison, talazoparib sensitivity in parental SUM149PT cells with WT SHLD1 (WT) is shown, as is talazoparib resistance in a BRCA1 revertant subclone (BRCA1-rev) of SUM149PT. Bars represent the mean ± SD (n=4 biologically independent experiments). ANOVA was performed for each SHLD1-KO clone vs. WT using Dunnett correction for multiple comparisons, p<10-15. Gene editing efficiencies can be found in Supplementary Table 2. i, BRCA1-KO and BRCA1-KO/SHLD2-KO cells were virally transduced with expression vectors for GFP alone or GFP-SHLD2. Sensitivity to olaparib (200 nM) was determined by a short-term survival assay in the presence of 1 µg/mL doxycycline to induce protein expression. Data is represented as dots for every individual experiment with the bar representing the mean ± SD (n=3).
ED Figure 2
ED Figure 2. Supporting data that Shieldin inhibits HR.
a, Representative micrographs of RAD51 focus formation in the indicated RPE1 cell lines (data quantitated in Fig 2d, n ≥ 3). b, Traffic light reporter (TLR) assay testing RPE1 BRCA-KO cells virally transduced with sgRNAs targeting 53BP1 or SHLD3. Data is represented as dots for individual experiments with the bar representing the mean ± SD (n=3). Gene editing efficiencies of the sgRNAs can be found in Supplementary Table 2). c, Representative flow cytometry plots of cells analysed with the TLR assay (data quantitated in Fig 2e, n ≥ 3). d, Representative flow cytometry plots of cells analysed with the TLR assay (data quantitated in ED Fig 2b).
ED Figure 3
ED Figure 3. Supporting data that mouse Shieldin promotes resistance to PARP inhibition in Brca1-mutated cells and tumours.
a, Clonogenic survival assays of transduced KB1P-G3 cells treated with indicated olaparib doses ± ATM inhibitor (ATMi) KU60019 (500 nM). On day 6, the ATMi alone and untreated groups were stopped and stained with 0.1% crystal violet; the other groups were stopped and stained on day 9. Data shown is a representative set from 3 biologically independent experiments (with 3 technical replicates each). b, Left, quantitation of Rad51 focus formation in parental KB1P-G3 (Brca1-/-; Trp53-/-) cells or KB1P-G3 cells that were transduced with the indicated lentiviral sgRNA vectors. Cells were fixed without treatment or 4 h after irradiation (10 Gy dose). Each data point represents a microscopy field containing a minimum of 50 cells; the bar represents the mean ± SD (n=15). Right, representative micrographs of Rad51-negative and -positive cells (the latter is indicated by an arrowhead). DNA was stained with DAPI. c, Clonogenic survival assay of Rosa26CreERT2/wt; Brca1Δ/Δ; p53-null mES-cells virally transduced with the indicated sgRNA and treated without or with 15 nM olaparib for 7 d. Gene editing efficiencies of the sgRNAs can be found in Supplementary Table 2. Data shown is a representative set from 3 biologically independent experiments (with ≥ 2 technical replicates each). d, Clonogenic survival assay of Rosa26CreERT2/wt;Brca1Sco/Δ mES-cells virally transduced with the indicated sgRNA and treated without or with 0.5 µM tamoxifen to induce BRCA1 depletion. Gene editing efficiencies of the sgRNAs can be found in Supplementary Table 2. Data shown is a representative set from 2 biologically independent experiments (with 3 technical replicates each).
ED Figure 4
ED Figure 4. Supporting data that Shieldin localizes to DSB sites
a, Representative micrographs of the experiments quantitated in Fig 3c. b, Representative micrographs of the experiments quantitated in Fig 3e. c, Quantitation of mRNAs for SHLD1, SHLD2 and SHLD3. RPE1 cells were transfected with siCTRL (non-targeting control siRNA) or siRNA targeting the indicated Shieldin subunits. 48 h post-transfection, mRNA was purified and reverse transcribed before being assayed by quantitative real-time PCR. Data were normalized to the amount of GAPDH mRNA and expressed relative to the corresponding value for cells transfected with siCTRL. Data is presented as the mean ± SD (n=3, independent siRNA transfections). d, Whole cell extracts from RPE1 WT cells transfected with the indicated siRNAs were processed for immunoblotting with the indicated antibodies. Tubulin is used as a loading control (n=1 experiment; siRNA efficiency is also monitored by immunofluorescence). e, Quantitation of 53BP1 and RIF1 recruitment to IR-induced DSBs (1 h post-irradiation with 10 Gy) following depletion of the indicated Shieldin components. Data is represented as the mean ± SD (n=3, independent siRNA transfections). f, Representative micrographs of the experiments quantitated in ED Fig 4e.
ED Figure 5
ED Figure 5. Data supporting epistasis between 53BP1 and Shieldin factors.
a, Quantitation of RAD51 focus formation 3 h post-irradiation (10 Gy) in RPE1 BRCA1-KO (left panel), BRCA1-KO/53BP1-KO (middle panel) and BRCA1-KO/SHLD2-KO (right panel) cells after viral transduction with the indicated sgRNAs (editing efficiency can be found in Supplementary Table 2) or empty vector (EV). Data is represented as the mean ± SD (for BRCA1-KO 53BP1-KO, n=4 biologically independent IF experiments; for BRCA1-KO and BRCA1-KO SHLD2-KO, n=6 biologically independent IF experiments). P-values were calculated using a two tailed unpaired t-test. Left panel: BRCA1-KO EV vs sg53BP1-1 p=0.0002; EV vs sgSHLD1-1 p=0.0043; EV vs sgSHLD2-2 p=0.0348; EV vs sgSHLD3-1 p=0.0180; EV vs sgREV7-1 p=0.0012). Middle and right panel: all comparisons to the EV condition were non-significant (ns). Values for BRCA1-KO 53BP1-KO EV vs sg53BP1-1 p=0.2332; EV vs sgSHLD1-1 p=0.4451; EV vs sgSHLD2-2 p=0.9632; EV vs sgSHLD3-1 p=0.1187; EV vs sgREV7-1 p=0.0568. Values for BRCA1-KO SHLD2-KO: EV vs sg53BP1-1 p=0.0550; EV vs sgSHLD1-1 p=0.1864; EV vs sgSHLD2-2 p=0.3568; EV vs sgSHLD3-1 p=0.4641; EV vs sgREV7-1 p=0.2888. b, Talazoparib sensitivity of WT or two independent SHLD1-KO SUM149PT-dox-Cas9 clones (A and D) virally transduced with an sgRNA targeting 53BP1 (sg53BP1) or a control non-targeting sgRNA (sgCTRL), following induction of Cas9. Data is presented as the mean ± SD (n=3 biologically independent experiments).
ED Figure 6
ED Figure 6. Data supporting the co-localization of Shieldin with RIF1 on chromatin.
a, Representation of the deletion mutants of SHLD2N used in ED Fig 6cd. The orange shading indicates blocks of homology. b, Schematic of the LacR-RIF1 chromatin recruitment assay. c, Quantitation of the experiment shown in ED Fig 6d. Colocalization was considered positive when the average GFP intensity at the mCherry focus was 3-fold over background nuclear intensity. A minimum of 20 cells were imaged per biological replicate (circles); the bar represents the mean ± SD (n=3). d, Representative images of the data quantitated in ED Fig 6c. The main focus is shown in inset and the scale bar = 10 μm. e-h, Quantitation (e,g) and representative micrographs (f,h) of overexpressed GFP-SHLD2N and mCherry-LacR-RIF1(1-967) co-transfected into uninduced U2OS-FokI cells along with siRNA against Shieldin complex subunits after processing for mCherry and GFP (e,f) or mCherry and REV7 (g,h) immunofluorescence. Colocalization was considered positive when the average GFP or REV7 intensity at the mCherry focus was 3-fold over background nuclear intensity. A minimum of 20 cells were imaged per condition (circles); the bar represents the mean ± SD (n=3 biologically independent experiments). i, Representative images of the data quantitated in ED Fig 6j. The main focus is shown in inset and the scale bar = 10 μm. j, Quantitation of GFP intensity at the mCherry-LacR-RIF1(1-967) focus, normalized to nuclear background. Each data point represents a cell transfected with the vector coding for the indicated GFP fusion. The line is at the median. The data is an aggregate of three independent experiments with a minimum of 20 cells counted (total cells counted: 62, 60, and 61 for GFP, GFP-SHLD2C, and GFP-SHLD3, respectively). k, mCherry-LacR-FokI colocalization with full length or N-terminally truncated (Δ1-50) GFP-SHLD2. Mean normalized focus intensity is shown from a total of 59 (SHLD2 full length) or 56 (SHLD2 Δ1-50) cells counted (n=2 biologically independent experiments).
ED Figure 7
ED Figure 7. Mapping the architecture of the Shieldin complex.
a, Streptavidin pulldown analysis determining which region of SHLD2 associates with the other Shieldin subunits. Whole cell extracts (WCEs) of 293T cells transfected with an expression vector for FLAG-SHLD1, V5-SHLD3, GFP-REV7 and Strep/HA-tagged SHLD2, SHLD2N (residues 2-420), SHLD2C (residues 421-904), or empty Strep/HA vector (EV) were incubated with streptavidin resin and bound proteins were eluted with biotin. WCEs and elutions were analysed by SDS-PAGE and immunoblotting with the indicated antibodies. Tubulin was used as a loading control. Results are representative set of immunoblots from 2 independent experiments. * denotes a non-specific band. b, Mapping the SHLD3 and REV7 binding sites on the SHLD2 N-terminus through streptavidin pulldowns with different SHLD2 constructs (detailed in ED Fig 6a) and immunoblotting. Results are a representative of a set of immunoblots from 3 independent experiments. c, Affinity purification of Shieldin complex components using N-terminally truncated SHLD2(Δ1-50) analyzed by immunoblotting (representative of three independent experiments). d, Streptavidin pulldown analysis of SHLD2 association with REV7 and SHLD3. 293T cells were transfected with siRNAs and expression vectors for epitope-tagged Shieldin components as indicated (EV, empty Strep/HA vector). WCEs were incubated with streptavidin resin and bound proteins were eluted with biotin. WCEs and elutions were analysed by SDS-PAGE and immunoblotted with the indicated antibodies. Short and long exposures are shown for GFP and V5 immunoblots (n=1). e, Dependency of V5-SHLD3 co-immunoprecipitation with GFP-REV7. 293T cells were transfected with siRNAs and expression vectors for epitope-tagged REV7 and SHLD3 as indicated (EV, empty V5 vector). WCEs were incubated with anti-V5 antibody and protein G resin. Bound proteins were boiled in SDS sample buffer and analysed by immunoblotting with GFP and V5 antibodies (n=1). f, Association between SHLD3 and RIF1. WCEs of 293T cells transfected with an expression vector for unfused GFP (-) or GFP-SHLD3 (SHLD3) were incubated with GFP-Trap resin. Bound proteins were boiled in SDS sample buffer and analysed by SDS-PAGE and immunoblotting against 53BP1 and RIF1. Results are representative of 2 SHLD3 IPs, utilizing SHLD3 fused to GFP (shown here) and V5 (show in Fig 3g) affinity tags.
ED Figure 8
ED Figure 8. Controls supporting the role of Shieldin in promoting physiological NHEJ.
a, Representative dot plots of the flow cytometry data obtained (of n=3 biologically independent experiments) to assess class switching in Fig 3h. CSR was determined as the percentage of IgA+ cells following stimulation after subtracting the baseline percentage of IgA+ cells in the indicated clones (values in brackets). b, c, Epistasis analysis of Shieldin and 53BP1 in CSR. Shown is the percentage of class switching in CH12F3-2 wild type, single knockout, or double knockout cells (as indicated) following stimulation. Each data point represents a biological replicate; the line represents the mean ± SD (n=3). Genomic editing efficiencies of the sgRNAs can be found in Supplementary Table 2. d, Whole cell extracts of the indicated CH12F2-3 clones were probed for AID and β-actin (loading control) by immunoblotting and were quantitated by densitometry. Each data point represents a biological replicate; the line represents the mean ± SD (n=9 for WT, n=3 for other samples). e, Random plasmid integration of linearized pcGFP-c1 conferring G418 resistance. Resistant colonies were quantified after 14 d. Bar represents the mean ± SD with WT cells set at 100% (left panel: n=5, right panel n=4 except SHLD2-KO (2.7) n=3 biologically independent experiments). f, Representative images of the plasmid integration assays quantitated in ED Fig 3e. g, Unirradiated CH12F3-2 clones (25 Gy) were immunoblotted for RPA2 phosphorylation (a representative set from n=3 biological replicates; data relates to Fig 3i).
ED Figure 9
ED Figure 9. Data supporting the role of DSB-targeted SHLD2 in the suppression of HR and the mapping of the SHLD2C-SHLD1 complex binding to ssDNA.
a, Representative micrographs of RPE1 BRCA1-KO/53BP1-KO cells transduced with the indicated GFP-fusion proteins, pre-extracted, fixed and stained for RAD51 and GFP 3 h post-IR (10 Gy). Protein expression was induced for 24 h before IR using 1 µg/mL doxycycline. Data relates to Fig 4b. Note that due to the pre-extraction required for visualization of RAD51 foci, the visualization of non-FHA tagged SHLD2 is lost. b, SDS-PAGE analysis of purified SHLD2C-SHLD1 complexes. Strep/HA-SHLD2(421-904)–Flag-SHLD1 complexes were purified from transiently transfected 293T cells. Concentrations of purified proteins were estimated by Coomassie staining and comparison to a standard curve of known BSA concentrations visualized by fluorescence at 700 nm. SHLD2C-m1 and SHLD2CS denote SHLD2C constructs carrying the OB fold m1 mutation and the internal deletion (Δ655-723) corresponding to the naturally occurring splice variant of SHLD2, respectively. Open and filled arrowheads mark the bands corresponding to SHLD2C and SHLD1, respectively. EV refers to empty Strep/HA vector. Shown is a representative stained gel from 2 independent experiments. c, Representative image of the [32P]-labeled ssDNA EMSA with SHLD2C-SHLD1 for KD determination shown in Fig 4e. d, Model of the SHLD2-OB fold domains and the engineered mutations (red spheres, point mutations; red ribbons, splice variant deletion). Model relates to Fig 4bd.
ED Figure 10
ED Figure 10. SHLD2 OB-folds are required for suppression of RAD51 IR-induced focus formation.
a, Quantitation of RAD51 foci 3 h following 10 Gy irradiation in RPE1 BRCA1-KO/SHLD2-KO cells complemented with the indicated GFP-tagged SHLD2 constructs via viral transduction. Protein expression was induced with 1 µg/mL doxycycline for 24 h prior to IR. Each data point is a biological replicate; the bar represents the mean ± SD (n=6 for BRCA1-KO untransduced cells, BRCA1-KO / SHLD2-KO untransduced and GFP-SHLD2 cells, n=3 for remaining cell lines, biologically independent experiments). b, Representative micrographs of the data shown in ED Fig 10a. Note that due to the pre-extraction required for visualization of RAD51 foci, the visualization of non-FHA tagged SHLD2 foci is lost. c, Representative micrographs of RPE1 BRCA1-KO/SHLD2-KO cells virally transduced with vectors expressing GFP-tagged SHLD2 WT or its OB-fold m1 mutant (m1), or short splice variant (S), 1 h post 5 Gy IR. Scale bar = 10 μm. d, Quantitation of the data shown in ED Fig 10c. Each data point represents an independent biological replicate counting ≥100 cells. Data is represented as mean ± SD (n=3). e, Whole cell extracts (WCE) of 293T cells co-transfected with Strep/HA-SHLD2 WT, -SHLD2-m1, or -SHLD2-S mutants, and other Shieldin subunits (Flag-SHLD1, V5-SHLD3, and GFP-REV7) were incubated with streptavidin resin and bound proteins were eluted with biotin. WCEs and eluted proteins were visualized by SDS-PAGE and immunoblotting with the indicated antibodies. Results shown are a representative set from 2 independent experiments.
Figure 1
Figure 1. Identification of Shieldin.
a, Venn diagram of the top 20 hits in each screen. b, Schematic of the competitive growth assays. c, Competitive growth assays ± olaparib (16 nM) in RPE1 BRCA1-KO cells. Data represents mean fraction of GFP positive cells ± SEM, normalized to day 0 (n = 3, independent transductions). d, PARPi resistance caused by mutation of C20orf196. SUM149PT cells transfected with indicated crRNAs were treated with 50 nM talazoparib for 14 d. Relative growth was normalized to a non-targeting crRNA (CTRL). Bars represent mean ± SD of multiple crRNAs per gene (shown is a representative plot of 2 biologically independent experiments). e, Domain architecture of Shieldin subunits. SHLD3 contains a REV7-binding PXXXPP motif. f, Protein interaction network surrounding REV7, C20orf196, FAM35A and CTC-534A2.2. Solid and dashed arrows represent interactions at an FDR of ≤1% and ≤5%, respectively. g, Sequential affinity purifications from 293T cell lysates expressing the indicated proteins. Bound proteins were immunoblotted with the indicated antibodies (n = 2 independent experiments).
Figure 2
Figure 2. Shieldin loss promotes PARPi resistance in cell and tumor models of BRCA1-deficiency.
a, CRISPR dropout screen results in RPE1 WT cells exposed to IR. Shown are gene-level normZ scores <0. b, Competitive growth assays using olaparib (16 nM) in RPE1 BRCA1-KO cells. Data is presented as mean ± SD, normalized to day 0 (n = 3, independent transductions). c Clonogenic survival in response to 16 nM olaparib. Representative images are shown (left) and quantified (right). Bars represent mean ± SD (n=9: RPE1 WT and BRCA1-KO SHLD1-KO; n=3: BRCA1-KO SHLD2-KO, n=4: BRCA1-KO 53BP1-KO; biologically independent experiments). d, Quantitation of cells with ≥5 RAD51 foci ± 10 Gy IR (6 h recovery). Biologically independent experiments are shown and the bar represents the mean ± SD. From left to right, the number of replicates was n=3 and n=3 (left panel); n=3, n=4, n=3, n=4, n=3 and n=3 (middle panel); and n=4, n=6, n=6, n=6, n=6, n=6, n= 6 and n=6 (right panel) e, Assessment of gene conversion by traffic light reporter assay. Biologically independent experiments are shown and the bar represents the mean ± SD (n=3 for WT and 53BP1-KO; n=4 for SHLD1-KO, SHLD2-KO, and REV7-KO). f, Kaplan-Meier curve showing tumor-specific survival of mice transplanted with KB1P4 tumor organoids ± olaparib treatment for 80 d (n = 8 per treatment; editing efficiencies found in Supplementary Table 2). P-values were calculated using a log-rank test (Mantel-Cox).
Figure 3
Figure 3. Shieldin accumulates at DSB sites downstream of 53BP1-RIF1 and promotes class switch recombination.
a-b, Representative micrographs of Shieldin subunit accumulation into IR-induced foci in U2OS cells (a) or at laser-microirradiation sites in RPE1 cells (b) (n=3 biologically independent experiments). c, Quantitation of (b). Points represent individual experiments counting ≥100 cells. Bar represents mean ± SD. d, Colocalization of GFP-tagged Shieldin subunits with mCherry foci in U2OS-FokI cells upon mCherry-LacR-FokI expression. e, Quantitation of GFP-SHLD3 or endogenous REV7 focus intensity. Each point represents a cell. Line represents the mean. Data is the aggregate of two biological replicates with a total of 50 and 120 (GFP-SHLD3 and REV7, respectively), 45 and 122, 48 and 112, 54 and 116, 49 and 111, and 117 cells counted for siCTRL, siRIF1, siREV7, siSHLD1, siSHLD2 and siSHLD3, respectively. f, mCherry-LacR-FokI colocalization with GFP-SHLD2, SHLD2N, and SHLD2C. Mean normalized focus intensity is shown with a total of 52 (SHLD2 and SHLD2N) or 53 (SHLD2C) cells counted (n=2, biologically independent experiments). g, RIF1 co-immunoprecipitation with V5-SHLD3 (representative of two independent experiments). h, CSR analysis of CH12F3-2 cells following stimulation. Data is represented as the mean ± SD (n=3 biologically independent replicates). i, Irradiated (25 Gy) CH12F3-2 clones were immunoblotted for RPA2 phosphorylation (representative of three biological replicates).
Figure 4
Figure 4. Shieldin is an effector of 53BP1 by binding ssDNA.
a, Schematic for artificially targeting Shieldin to DSB sites. b, RAD51 IRIF formation 3 h following 10 Gy irradiation in BRCA1-KO 53BP1-KO cells expressing the indicated fusion proteins. The bar represents the mean ± SD. From top to bottom the number of biologically independent experiments was n=20, n=22, n=12, n=12, n=16, n=4, n=4, n=4, n=4, n=4, n=6, n=6 and n=3. c, EMSA of the SHLD2C-SHLD1 complex isolated from 293T cells (see ED Fig 9b) incubated with radiolabeled ssDNA ± unlabelled oligonucleotides (n=2 independent experiments). EV refers to empty vector. d, EMSA of SHLD2C WT and variants (n=4 independent experiments). e, Determination of SHLD2C-SHLD1 ssDNA binding dissociation constant (Kd). Mean values are presented ± SD (n=3 independent experiments). Representative EMSA shown in ED Fig 9c. f, Model of Shieldin function. We speculate that the SHLD2 OB-fold domains bind to ssDNA at DSB sites to suppress resection and favour NHEJ.

References

    1. Panier S, Boulton SJ. Double-strand break repair: 53BP1 comes into focus. Nat Rev Mol Cell Biol. 2014;15:7–18. doi: 10.1038/nrm3719. - DOI - PubMed
    1. Hustedt N, Durocher D. The control of DNA repair by the cell cycle. Nat Cell Biol. 2016;19:1–9. doi: 10.1038/ncb3452. - DOI - PubMed
    1. Munoz IM, Jowsey PA, Toth R, Rouse J. Phospho-epitope binding by the BRCT domains of hPTIP controls multiple aspects of the cellular response to DNA damage. Nucleic acids research. 2007;35:5312–5322. doi: 10.1093/nar/gkm493. - DOI - PMC - PubMed
    1. Zimmermann M, Lottersberger F, Buonomo SB, Sfeir A, de Lange T. 53BP1 Regulates DSB Repair Using Rif1 to Control 5' End Resection. Science. 2013 doi: 10.1126/science.1231573. science.1231573 [pii] - DOI - PMC - PubMed
    1. Feng L, Fong KW, Wang J, Wang W, Chen J. RIF1 counteracts BRCA1-mediated end resection during DNA repair. The Journal of biological chemistry. 2013;288:11135–11143. doi: 10.1074/jbc.M113.457440. - DOI - PMC - PubMed

Publication types

MeSH terms

Substances