Review
. 2018 Jan-Dec:22:2331216518784822.
doi: 10.1177/2331216518784822.

The Neuronal Basis of Predictive Coding Along the Auditory Pathway: From the Subcortical Roots to Cortical Deviance Detection

Affiliations
Review

The Neuronal Basis of Predictive Coding Along the Auditory Pathway: From the Subcortical Roots to Cortical Deviance Detection

Guillermo V Carbajal et al. Trends Hear. 2018 Jan-Dec.

Abstract

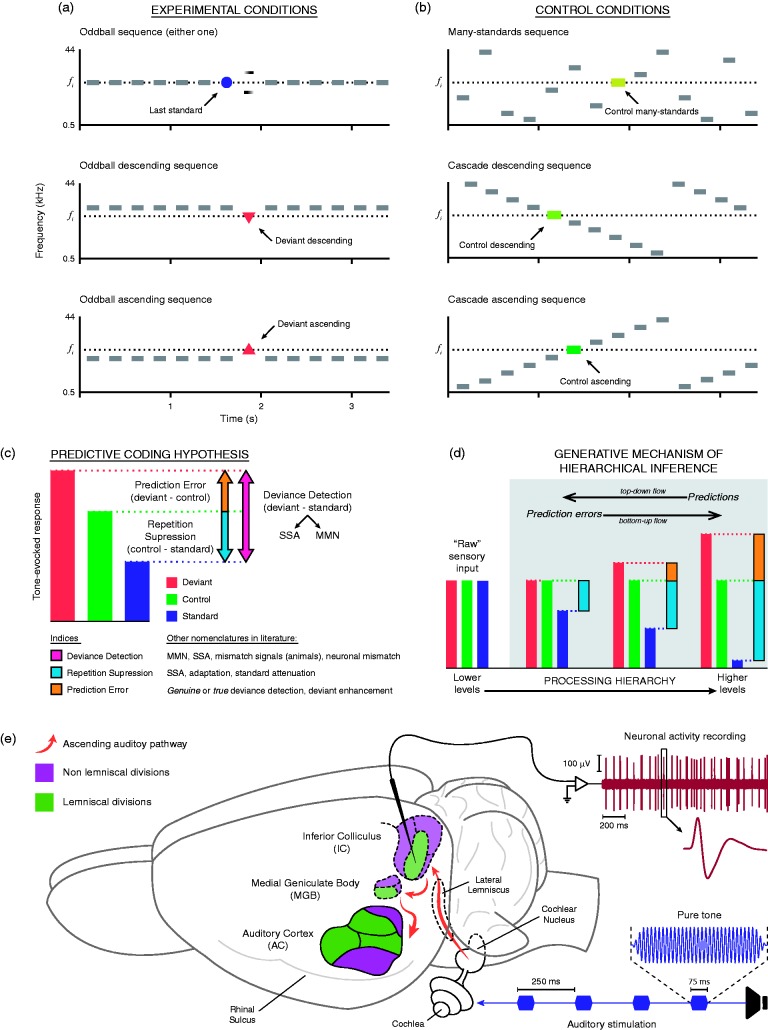
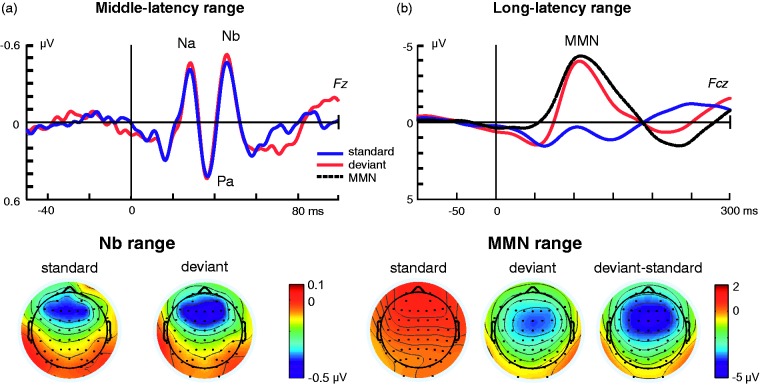
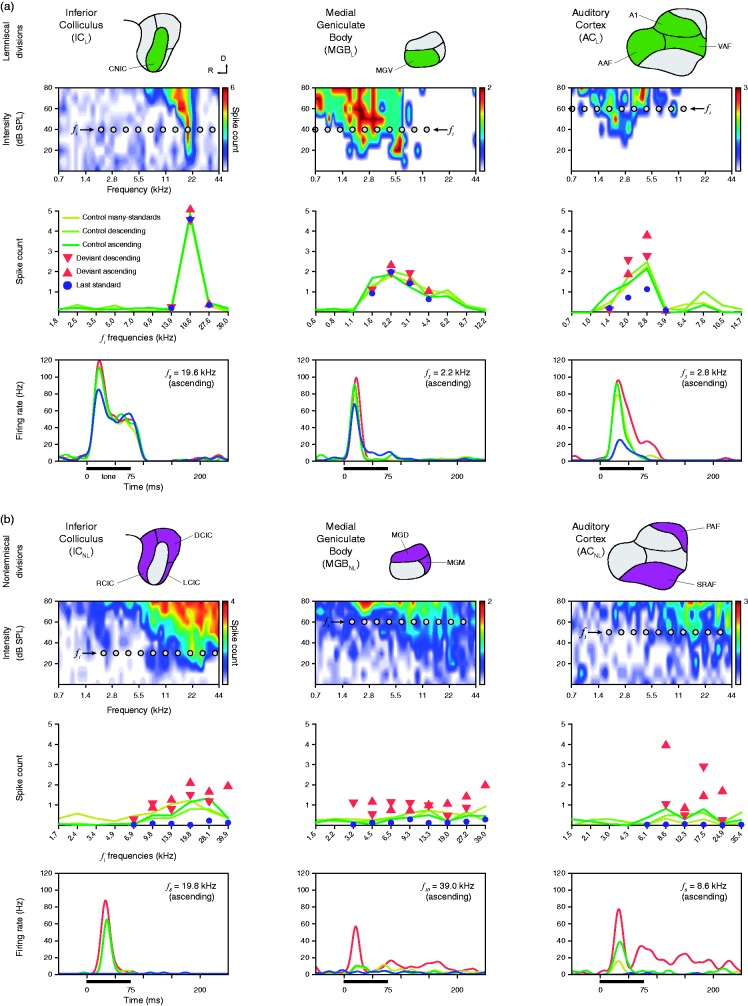
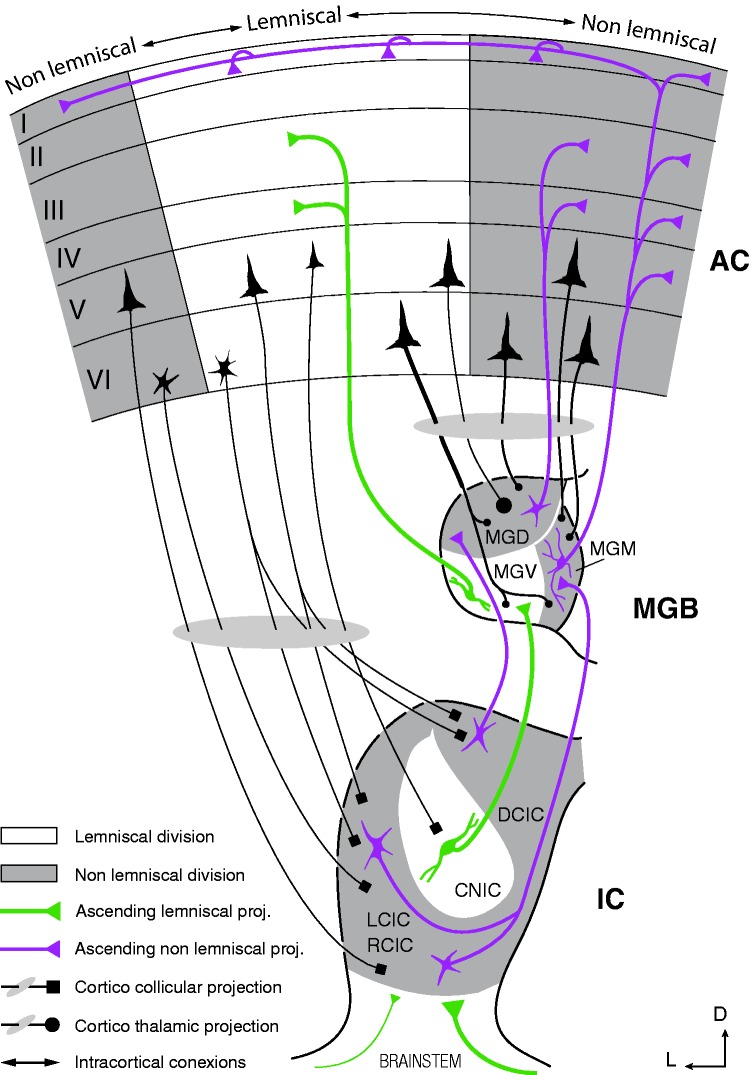
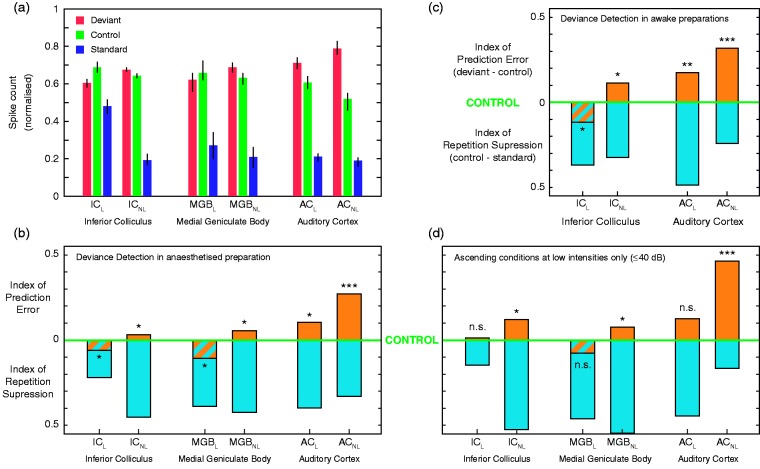
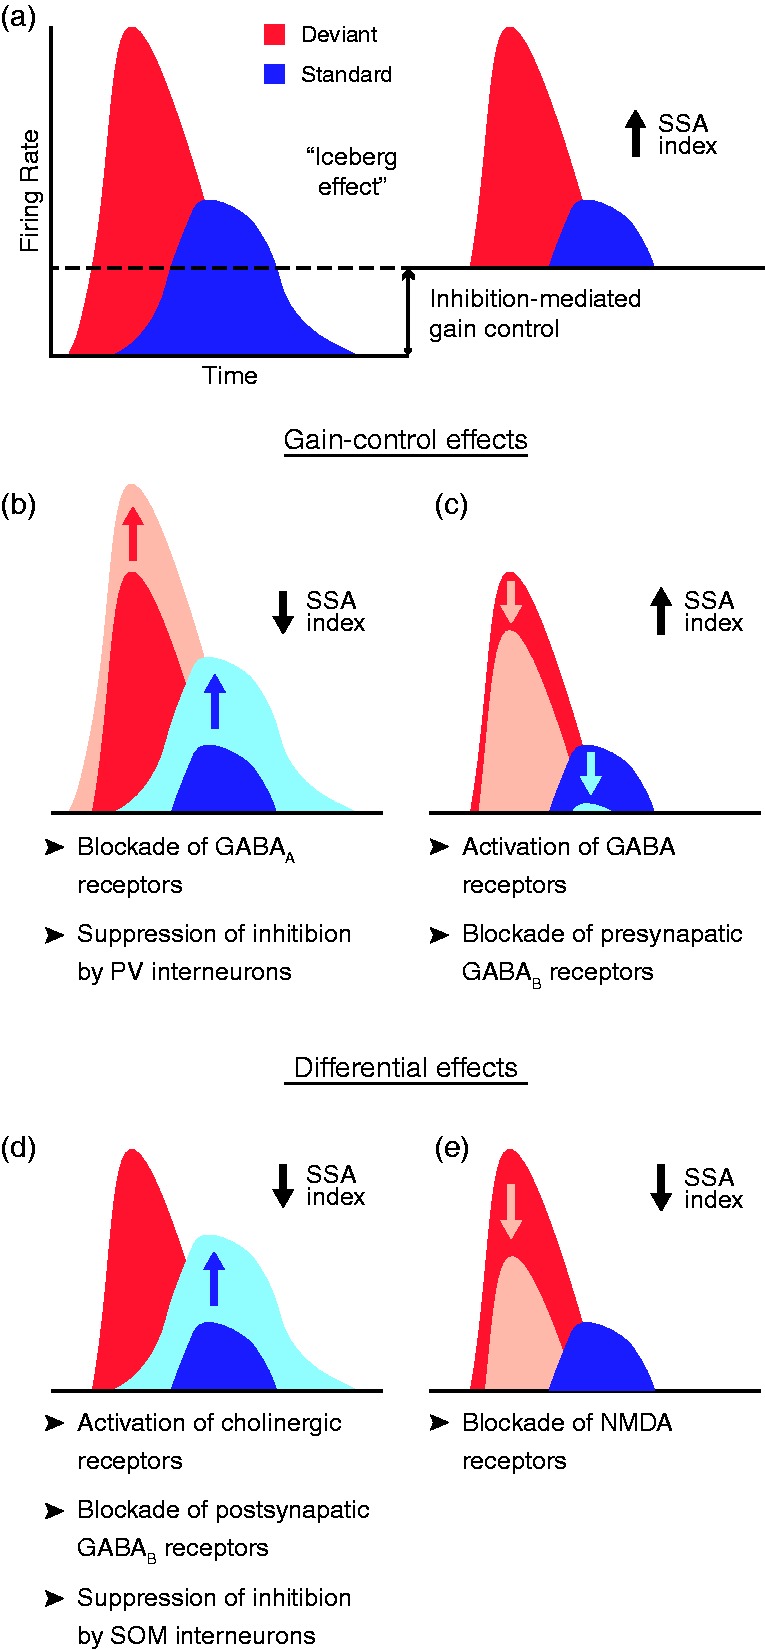
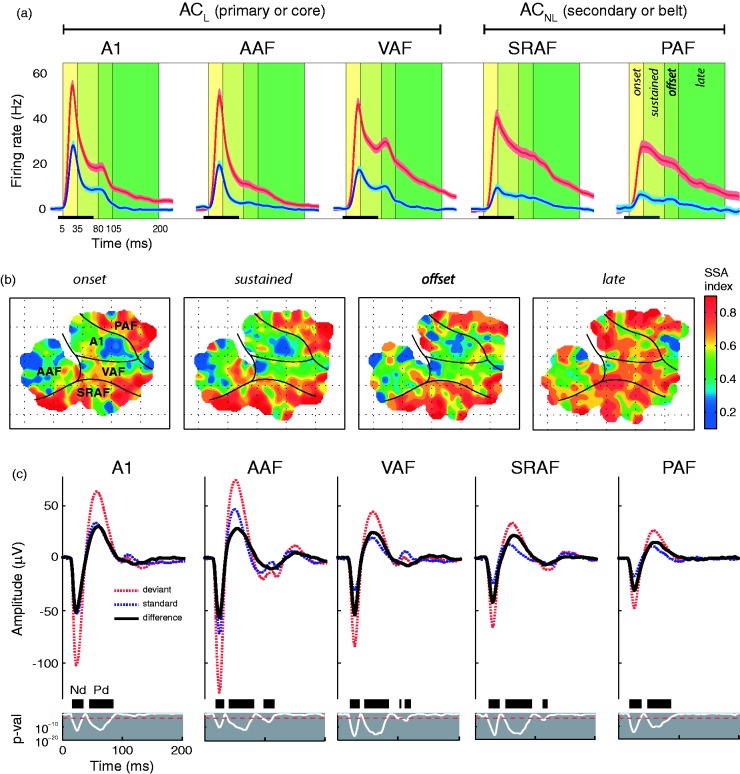
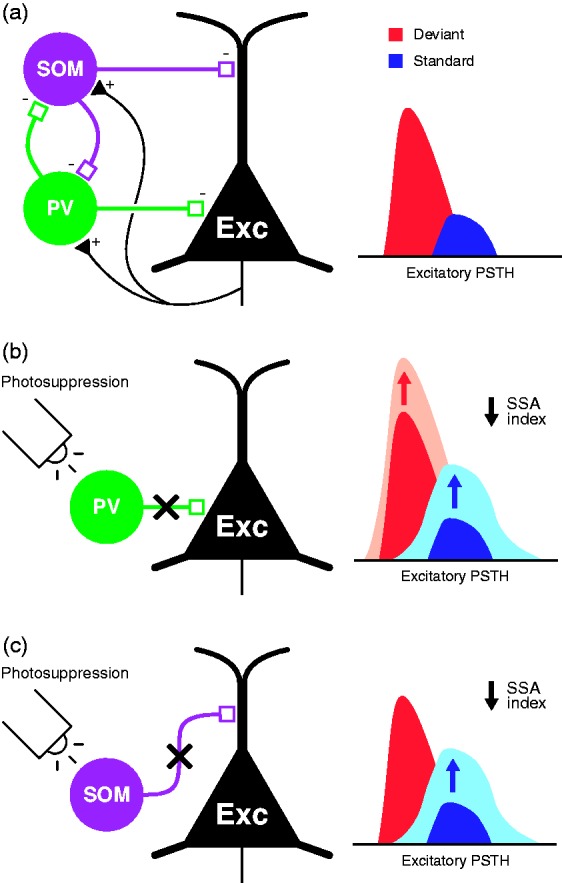
In this review, we attempt to integrate the empirical evidence regarding stimulus-specific adaptation (SSA) and mismatch negativity (MMN) under a predictive coding perspective (also known as Bayesian or hierarchical-inference model). We propose a renewed methodology for SSA study, which enables a further decomposition of deviance detection into repetition suppression and prediction error, thanks to the use of two controls previously introduced in MMN research: the many-standards and the cascade sequences. Focusing on data obtained with cellular recordings, we explain how deviance detection and prediction error are generated throughout hierarchical levels of processing, following two vectors of increasing computational complexity and abstraction along the auditory neuraxis: from subcortical toward cortical stations and from lemniscal toward nonlemniscal divisions. Then, we delve into the particular characteristics and contributions of subcortical and cortical structures to this generative mechanism of hierarchical inference, analyzing what is known about the role of neuromodulation and local microcircuitry in the emergence of mismatch signals. Finally, we describe how SSA and MMN are occurring at similar time frame and cortical locations, and both are affected by the manipulation of N-methyl- D-aspartate receptors. We conclude that there is enough empirical evidence to consider SSA and MMN, respectively, as the microscopic and macroscopic manifestations of the same physiological mechanism of deviance detection in the auditory cortex. Hence, the development of a common theoretical framework for SSA and MMN is all the more recommendable for future studies. In this regard, we suggest a shared nomenclature based on the predictive coding interpretation of deviance detection.

Keywords: MMN; SSA; deviance detection; predictive coding; repetition suppression.


Figures

Figure 1.
Figure 1.
(a) Classical oddball paradigm, displaying three possible experimental conditions for a given fi target tone. (b) Control sequences highlighting the fi target tone. In the many-standards sequence, the target tone is embedded within a random succession of assorted equiprobable tones, making impossible for the system to establish a predictive rule. The two versions of the cascade sequence (descending and ascending) are compared with the corresponding version of the oddball sequence. In both versions, the target tone is embedded in a predictable succession of equiprobable tones, allowing the system to establish a predictive rule that is not broken by the appearance of the target tone, as opposed to what happens in the oddball sequence. (c). Decomposition of deviance detection signals (deviant–standard) according to the interpretation of the predictive coding hypothesis. The difference between the response to the target tone in the control sequence and its evoked response when presented as a standard in the oddball sequence would constitute the component of repetition suppression. On the other hand, the difference between the deviant-evoked response and the response to that target tone within a control sequence, if positive, would unveil a component of prediction error. (d). Explanation of how the generative mechanism of hierarchical or Bayesian inference would work, showing the modulation of evoked responses normalized to the control condition. “Raw” sensory input (i.e., information about the physical features of the auditory stimuli disregarding its context) would be fed into the mechanism of inference to be modulated along the auditory processing hierarchy according to their contextual features and interstimular relationships. Higher order levels of processing would abstract increasingly complex rules to generate top-down predictions capable of explaining away incoming input and save processing resources. When predictions match the input at lower levels, sensory coding is optimized and perception arises. But when there is a mismatch, lower order levels covey a bottom-up prediction error to higher order levels to update the predictive model. (e) Sketch of a typical experimental setup for cellular recording (in rat brain), in which neuronal activity is recorded from different auditory stations while stimulating with sequences of pure tones. MMN = mismatch negativity; SSA = stimulus-specific adaptation. Adapted from Parras et al. (2017).
Figure 2.
Figure 2.
Auditory-evoked potentials (ERPs) recorded from the human scalp to standard and frequency deviant stimuli presented in an oddball sequence. (a) Middle-latency response (MLR) with its typical morphology (Na, Pa, and Nb) waveforms disclosing larger amplitude for deviant (red) compared with standard (blue) stimuli. The bottom plots correspond to the scalp distribution of the Nb latency range for deviant and standard stimuli. (b) Long-latency auditory-evoked potential for standard (blue) and deviant (red) stimuli, and the corresponding difference waveform (black) disclosing the mismatch negativity (MMN). The bottom plots correspond to the scalp distribution of the MMN latency range for deviant and standard stimuli, as well as the scalp distribution of the MMN (right). ERP = event-related potential. Adapted from Althen, Grimm, and Escera (2013).
Figure 3.
Figure 3.
Deviance detection and prediction error in representative neurons of the anesthetized rat. (a) Examples of lemniscal single-unit responses in each recorded auditory station (columns). The first row shows schematics of the lemniscal subdivisions (green) within each nucleus. The second row shows the frequency-response area (representation of neuronal sensitivity to different frequency-intensity combinations) of representative lemniscal neurons from each nucleus. Ten gray dots within each frequency-response area represent the 10 tones (fi) selected to build the experimental sequences (Figure 1(a)). The third row displays the measured responses of the particular neuron to each fi tone (baseline-corrected spike counts) for each tested condition. Note that measured conditions tend to overlap in the subcortical stations (ICL and MGBL) and only start differentiating from each other once auditory information reaches the cortex (ACL). The fourth row shows sample peristimulus time histograms (PSTH) comparing the neuronal responses with each condition tested for an indicated fi tone. A thick horizontal line represents stimulus duration. (b) Examples of nonlemniscal neuronal responses in each recorded auditory nuclei, organized as in (a). The first row highlights nonlemniscal divisions in purple. In the second row, note frequency-response areas tend to be more broadly tuned, when compared with lemniscal neurons. In the third row, responses to deviant conditions tend to relatively increase and distance themselves from their corresponding controls as information ascends in the auditory pathway. Also note that responses to last standards are feeble or even completely missing across all nonlemniscal stations (ICNL, MGBNL, and ACNL). In the last row, the strong influence of the experimental condition over the neuronal response to the same tone can be clearly appreciated in the three nuclei. AAF = anterior auditory field; CNIC = central nucleus of the inferior colliculus; DCIC = dorsal cortex of the inferior colliculus; LCIC = lateral cortex of the inferior colliculus; MGB = medial geniculate body of the thalamus; MGD = dorsal division of the MGB; MGM = medial division of the MGB; MGV = ventral division of the medial geniculate body of the thalamus; PAF = posterior auditory field; RCIC = rostral cortex of the inferior colliculus; SPL = sound pressure level; SRAF = suprarhinal auditory field; VAF = ventral auditory field. Adapted from Parras et al. (2017).
Figure 4.
Figure 4.
Schematic diagram of the auditory pathway, showing the major stations and projections that constitute the lemniscal and nonlemniscal pathways. Note that divisions in subcortical nuclei are well preserved across species, while AC fields vary markedly (Malmierca & Hackett, 2010). As a rule of thumb, lemniscal tonotopic laminae tend to project to their analogous lamina in the next lemniscal division and receive few cortical projections, shaping a sort of straightforward pathway to the cortex. Conversely, nonlemniscal divisions tend to project mostly to other nonlemniscal divisions and receive dense cortical projections, shaping a loop-like connectivity network ideal for hosting a generative mechanism of hierarchical inference (Figure 1(d)). AC = auditory cortex; CNIC = central nucleus of the inferior colliculus; DCIC = dorsal cortex of the inferior colliculus; IC = inferior colliculus; LCIC = lateral cortex of the inferior colliculus; MGB = medial geniculate body of the thalamus; MGD = dorsal division of the MGB; MDM = medial division of the MGB; MGV = ventral division of the MGB; RCIC = rostral cortex of the inferior colliculus. Adapted from Malmierca et al. (2015).
Figure 5.
Figure 5.
Emergence of prediction error along the auditory hierarchy. (a) Median normalized tone-evoked responses (lines indicate SEM) to the deviant, standard, and control within each recorded auditory station. (b) Median indices of prediction error (orange) and repetition suppression (cyan) in anesthetized rats, represented with respect to the baseline set by the control. Thereby, the index of prediction error is upward-positive, while the index of repetition suppression is downward-positive. Each median index corresponds to differences between normalized responses in (a). Asterisks denote statistical significance of prediction error against zero median (*p = .05, **p = .01, ***p = .001). (c) Indices of prediction error and repetition suppression in awake mice. (d) Same as in (b), but only representing ascending conditions at low intensities. AC = auditory cortex; MGB = medial geniculate body of the thalamus; IC = inferior colliculus; L = lemniscal divisions; NL = nonlemniscal divisions. Adapted from Parras et al. (2017).
Figure 6.
Figure 6.
Effect of pharmacological and inhibitory manipulation on SSA index. (a) Schematic representation of the iceberg effect, with a dashed line representing the amount of activity reduced by inhibition. In the absence of inhibition (left), the higher excitability of the neuron yields larger tone-evoked firing rates, thus reducing the relative difference between the response to deviant and standard stimuli. Inhibition reduces both tone-evoked responses (right), increasing the deviant-to-standard ratio and thus enhancing SSA. (b, c) Gain-control effects, that is, effects affecting overall excitability of neurons that produce a change in SSA index, identified as of date via indicated manipulations. (d, e) Manipulations that yield a decrease in SSA index because of the differential effect exerted at the standard- or deviant-evoked responses. Albeit simplified for clarity in figure, this does not mean that the manipulation exerts exclusive effects on deviant or standard responses. Rather, a significantly much larger effect is observed at one that does not generalize to the other, even if the latter does not remain completely unaffected. AAF = anterior auditory field; GABA = gamma-aminobutyric acid; NMDA = N-methyl-D-aspartate; PV = parvalbumin; SOM = somatostatin; SSA = stimulus-specific adaptation.
Figure 7.
Figure 7.
Variation of SSA index throughout time and cortical fields. (a) Grand-average multiunit responses (baseline-corrected firing rate, mean ± SEM) to standard (blue) and deviant (red) tones within each field and throughout four characteristic time windows. Many recordings showed significant late-component responses, beyond 100 ms after stimulus onset (check Figure 2(b) for a single-unit example). (b) Topographic distribution of SSA for the four different time windows. Note that only the late component of SSA index is high throughout the entire auditory cortex, suggesting intracortical hierarchical processing of deviance detection. (c) Grand-average LFP traces in response to deviant and standard tones, and the resulting difference wave (black), for each AC field. Two components of the difference wave were identified: the fast negative deflection (Nd) and the slower positive deflection (Pd). And additional small but significant deflection of the LFP was identified at longer latencies (>100 ms) in anteroventral fields (AAF, VAF, and SRAF). The thin white line below represents the p value of the difference wave, with a thick black bar marking the time intervals containing significant differences. AAF = anterior auditory field; AC = auditory cortex; LFP = local field potential; PAF = posterior auditory field; SRAF = suprarhinal auditory field; SSA = stimulus-specific adaptation; VAF = ventral auditory field. Adapted from Nieto-Diego and Malmierca (2016).
Figure 8.
Figure 8.
Interneurons exert inhibitory-mediated amplification effects over excitatory pyramidal neurons. (a) Schematic diagram showing only three common elements of the otherwise intricate cortical microcircuitry. PV-positive interneurons mostly inhibit perisomatic regions of pyramidal neurons, whereas SOM-positive interneurons mainly target the distal dendrites. In addition, both types of interneurons inhibit each other while targeted by excitatory recurrents of pyramidal neurons. The inhibition of both types of interneurons contributes to the amplification of the deviance detection signal, but in different manners. (b) Optogenetic photosuppression of PV-mediated inhibition leads to a nonspecific increase of the neuronal response, unveiling its gain-control action. (c) Optogenetic photosuppression of SOM-mediated inhibition increases the standard-evoked response, revealing a differential effect exerted on repetition suppression. PSTH = peristimulus time histograms; PV = parvalbumin; SOM = somatostatin; SSA = stimulus-specific adaptation. Adapted from Natan et al. (2015).

References

    1. Abolafia J. M., Vergara R., Arnold M. M., Reig R., Sanchez-Vives M. V. (2011) Cortical auditory adaptation in the awake rat and the role of potassium currents. Cerebral Cortex 21(5): 977–990. doi:10.1093/cercor/bhq163. - PubMed
    1. Alain C., Woods D. L., Ogawa K. H. (1994) Brain indices of automatic pattern processing. NeuroReport 6(1): 140–144. doi:10.1097/00001756-199412300-00036. - PubMed
    1. Alho K. (1995) Cerebral generators of mismatch negativity (MMN) and its magnetic counterpart (MMNm) elicited by sound changes. Ear and Hearing 16(1): 38–51. - PubMed
    1. Althen H., Grimm S., Escera C. (2011) Fast detection of unexpected sound intensity decrements as revealed by human evoked potentials. PLoS One 6(12): e28522 doi:10.1371/journal.pone.0028522. - PMC - PubMed
    1. Althen H., Grimm S., Escera C. (2013) Simple and complex acoustic regularities are encoded at different levels of the auditory hierarchy. European Journal of Neuroscience 38(10): 3448–3455. doi:10.1111/ejn.12346. - PubMed

Publication types

LinkOut - more resources