

Longitudinal structural cerebral changes related to core CSF biomarkers in preclinical Alzheimer's disease: A study of two independent datasets
- PMID: 30023169
- PMCID: PMC6050455
- DOI: 10.1016/j.nicl.2018.04.016
Longitudinal structural cerebral changes related to core CSF biomarkers in preclinical Alzheimer's disease: A study of two independent datasets
Abstract
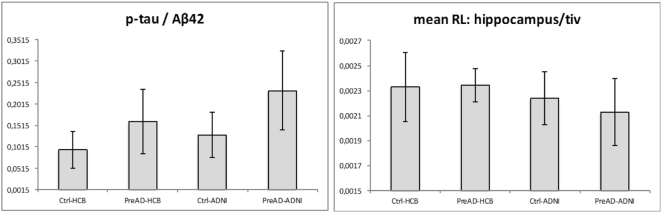
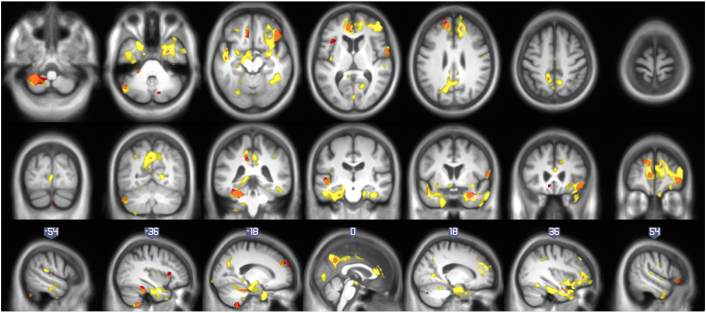
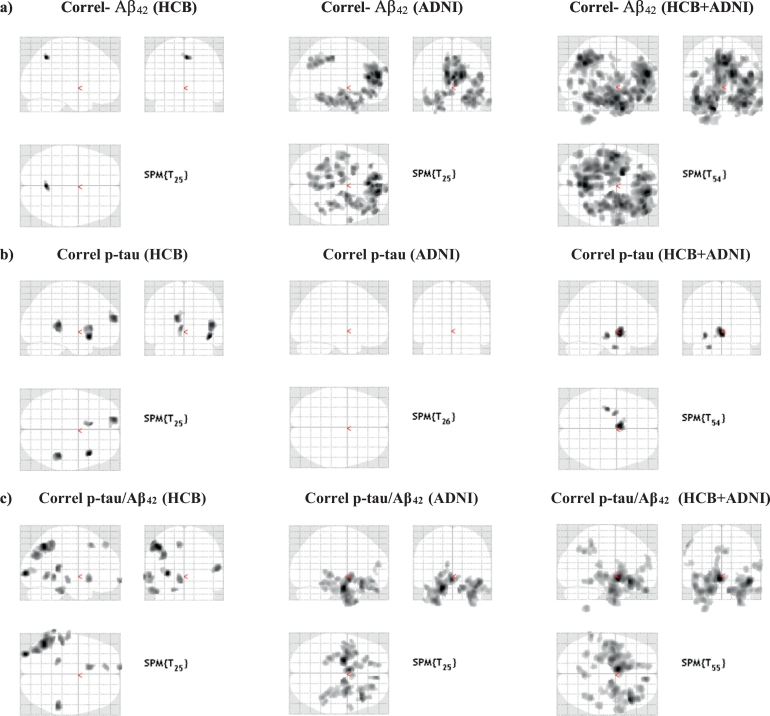
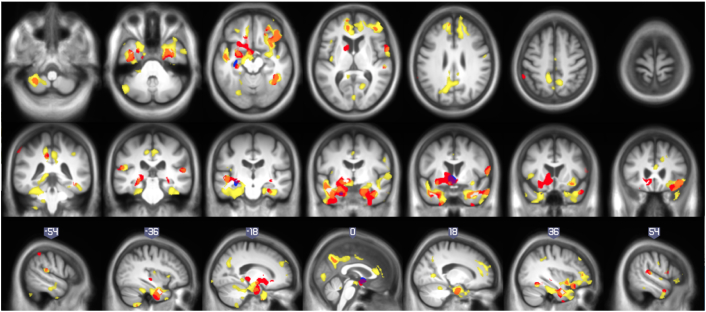
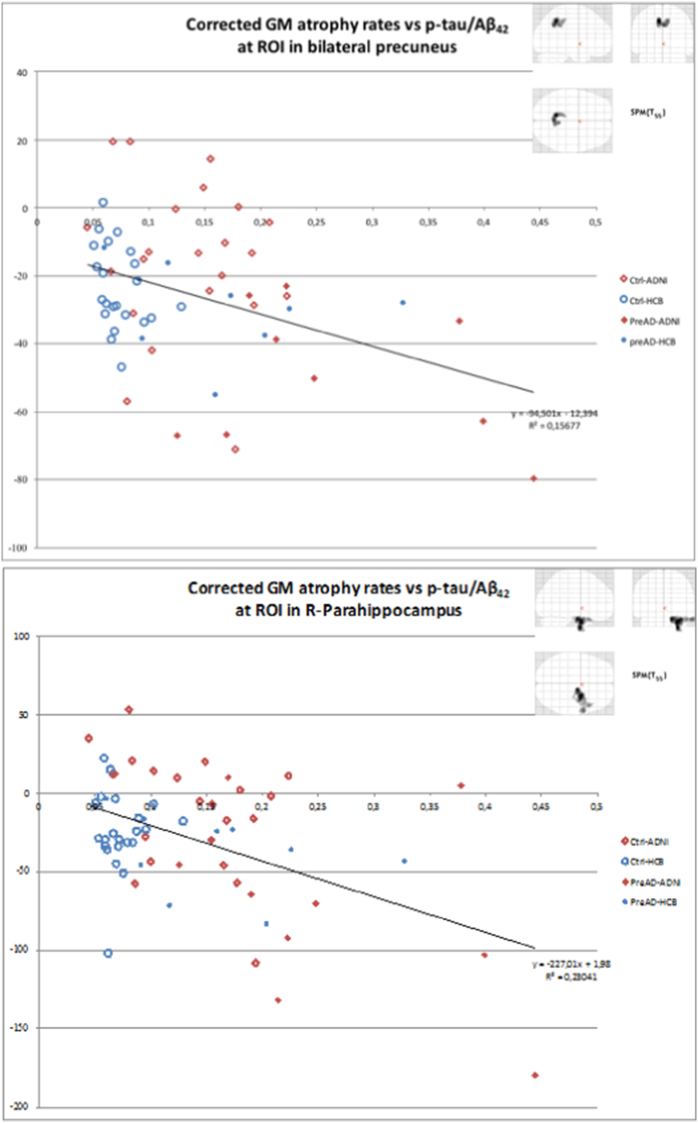
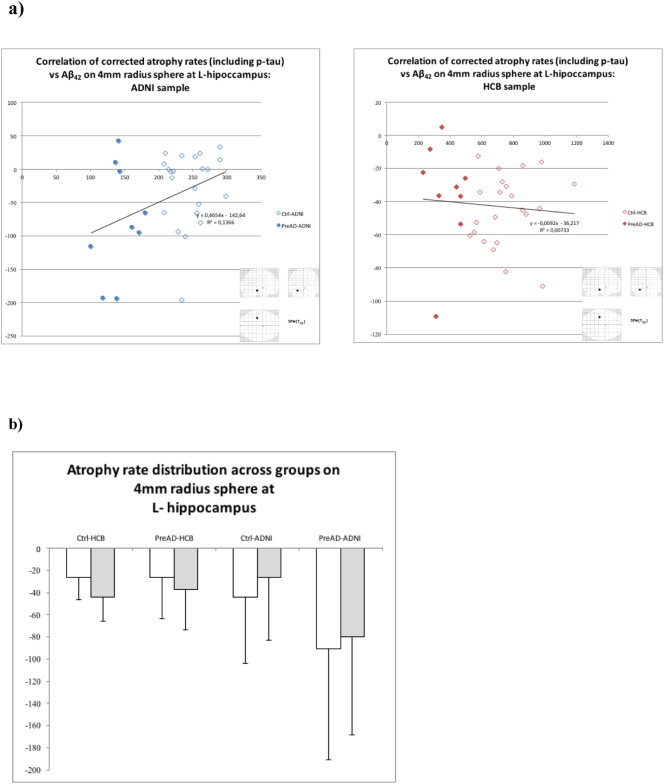
Alzheimer's disease (AD) is characterized by an accumulation of β-amyloid (Aβ42) accompanied by brain atrophy and cognitive decline. Several recent studies have shown that Aβ42 accumulation is associated with gray matter (GM) changes prior to the development of cognitive impairment, in the so-called preclinical stage of the AD (pre-AD). It also has been proved that the GM atrophy profile is not linear, both in normal ageing but, especially, on AD. However, several other factors may influence this association and may have an impact on the generalization of results from different samples. In this work, we estimate differences in rates of GM volume change in cognitively healthy elders in association with baseline core cerebrospinal fluid (CSF) AD biomarkers, and assess to what these differences are sample dependent. We report the dependence of atrophy rates, measured in a two-year interval, on Aβ42, computed both over continuous and categorical values of Aβ42, at voxel-level (p < 0.001; k < 100) and corrected for sex, age and education. Analyses were performed jointly and separately, on two samples. The first sample was formed of 31 individuals (22 Ctrl and 9 pre-AD), aged 60-80 and recruited at the Hospital Clinic of Barcelona. The second sample was a replica of the first one with subjects selected from the ADNI dataset. We also investigated the dependence of the GM atrophy rate on the basal levels of continuous p-tau and on the p-tau/Aβ42 ratio. Correlation analyses on the whole sample showed a dependence of GM atrophy rates on Aβ42 in medial and orbital frontal, precuneus, cingulate, medial temporal regions and cerebellum. Correlations with p-tau were located in the left hippocampus, parahippocampus and striatal nuclei whereas correlation with p-tau/Aβ42 was mainly found in ventral and medial temporal areas. Regarding analyses performed separately, we found a substantial discrepancy of results between samples, illustrating the complexities of comparing two independent datasets even when using the same inclusion criteria. Such discrepancies may lead to significant differences in the sample size needed to detect a particular reduction on cerebral atrophy rates in prevention trials. Higher cognitive reserve and more advanced pathological progression in the ADNI sample could partially account for the observed discrepancies. Taken together, our findings in these two samples highlight the importance of comparing and merging independent datasets to draw more robust and generalizable conclusions on the structural changes in the preclinical stages of AD.
Keywords: AD, Alzheimer's disease; ADNI, Alzheimer's Disease Neuroimaging Initiative; Alzheimer's disease; Aβ42, amyloid beta; CDR, Clinical Dementia Rating; CSF biomarkers; CSF, Cerebro-Spinal Fluid; Ctrl, control; DI, divergences of the longitudinal deformations; ELISA, Enzyme-Linked ImmunoSorbent Assay; FWE, Family Wise Error; GM, gray matter; HCB, Hospital Clinic Barcelona; L, left; Longitudinal VBM; MMSE, Mini Mental State examination; PLR, pairwise longitudinal registration; Preclinical Alzheimer's disease; R, right; ROI, region of interest; TIV, total intracranial volume; VBM, voxel-based morphometry; WM, white matter; p-tau, phosphorylated tau; preAD, preclinical Alzheimer's disease; t-tau, total tau.
Figures
References
-
- Antonell A., Mansilla A., Rami L., Lladó A., Iranzo A., Olives J., Balasa M., Sánchez-Valle R., Molinuevo J.L. Cerebrospinal fluid level of YKL-40 protein in preclinical and prodromal Alzheimer's disease. J. Alzheimers Dis. 2014;42:901–908. - PubMed
-
- Arenaza-Urquijo E.M., Molinuevo J.L., Sala-Llonch R., Solé-Padullés C., Balasa M., Bosch B., Olives J., Antonell A., Lladó A., Sánchez-Valle R., Rami L., Bartres-Faz D. Cognitive reserve proxies relate to gray matter loss in cognitively healthy elderly with abnormal cerebrospinal fluid amyloid-β levels. J. Alzheimers Dis. 2013;35:715–726. - PubMed
-
- Ashburner J. A fast diffeomorphic image registration algorithm. NeuroImage. 2007;38:95–113. - PubMed
Publication types
MeSH terms
Substances
Grants and funding
LinkOut - more resources
Full Text Sources
Other Literature Sources
Medical
