. 2017 Oct 31;2(10):7085-7095.
doi: 10.1021/acsomega.7b01234. Epub 2017 Oct 23.

Planar and Cell Aggregate-Like Assemblies Consisting of Microreactors and HepG2 Cells

Affiliations

Planar and Cell Aggregate-Like Assemblies Consisting of Microreactors and HepG2 Cells

Yan Zhang et al. ACS Omega. .

Abstract

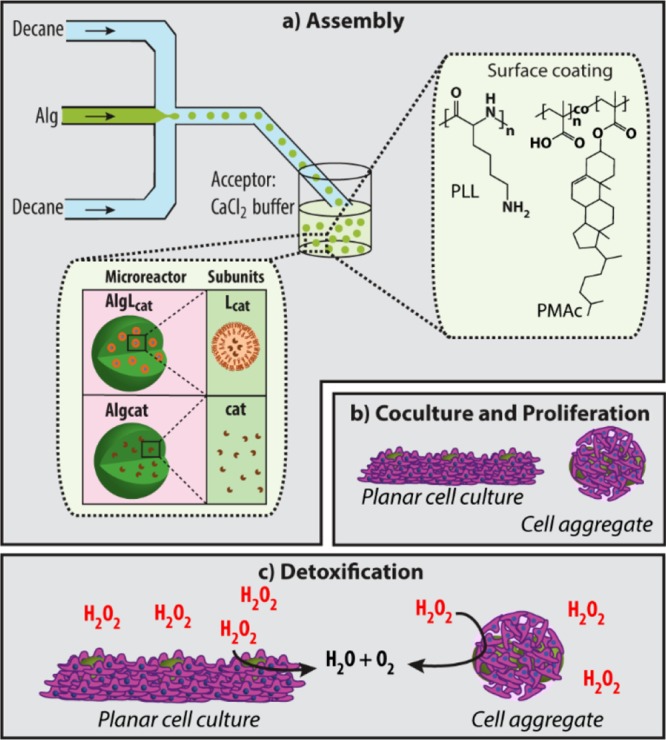
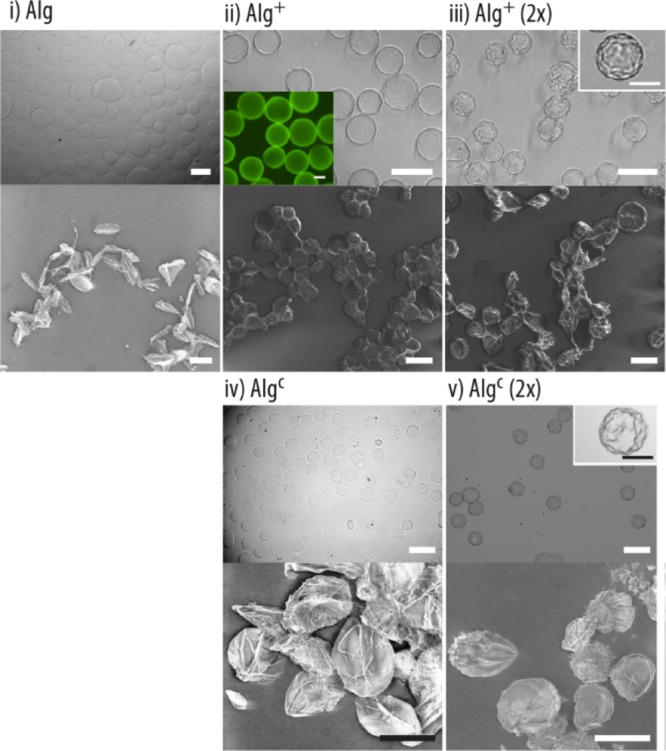
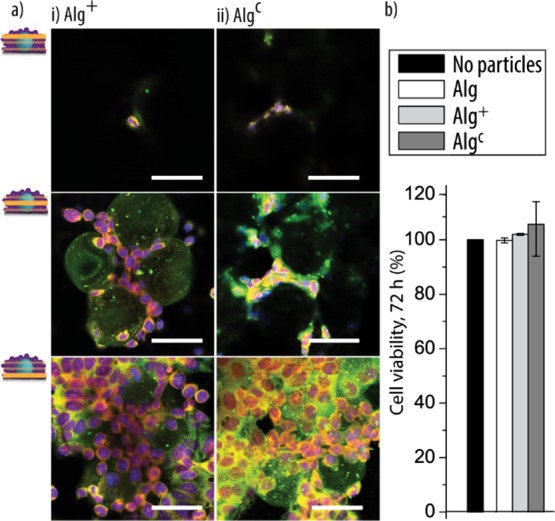
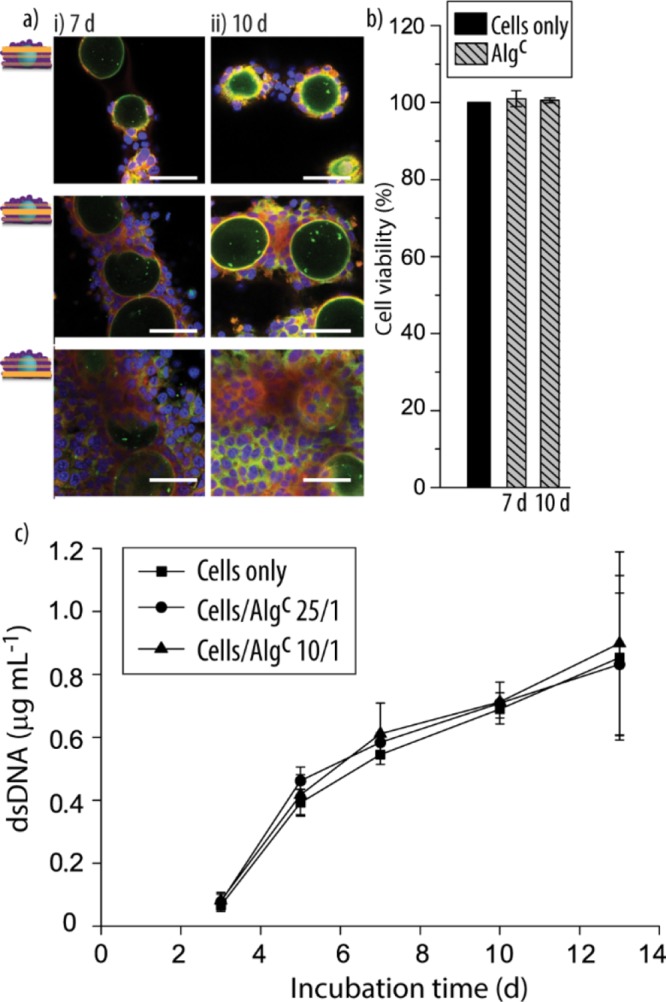
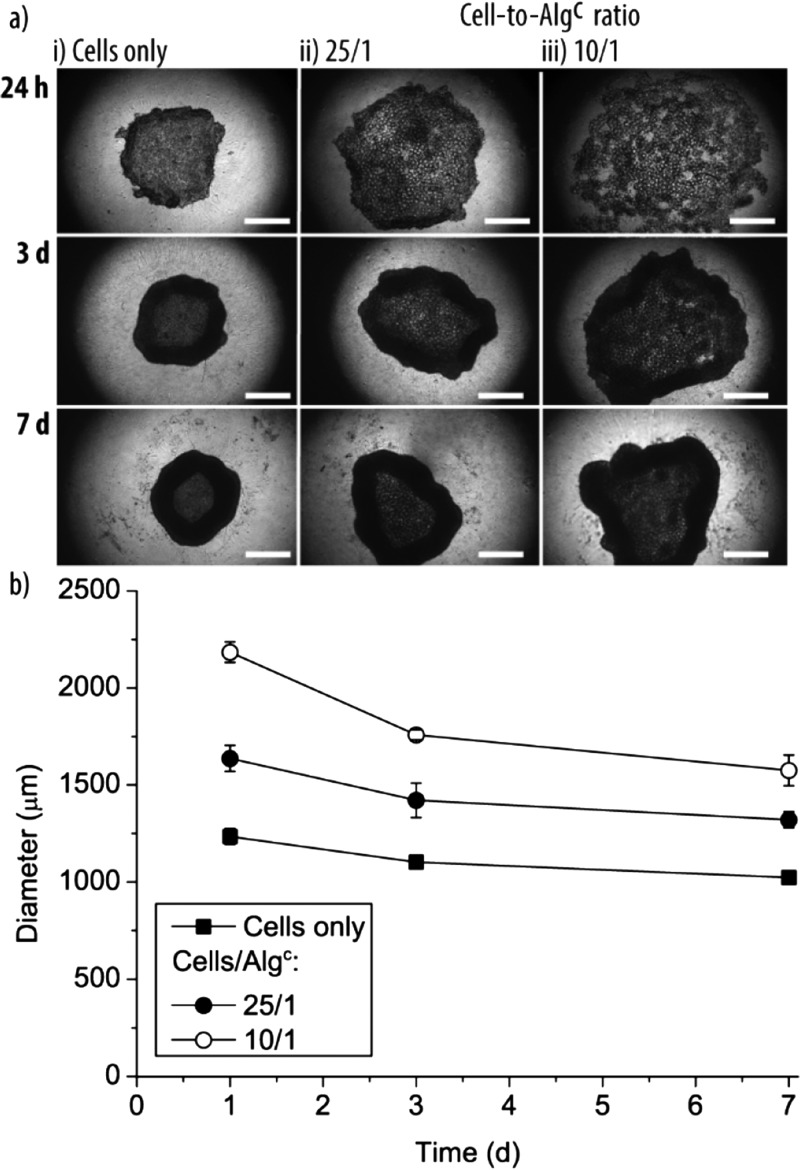
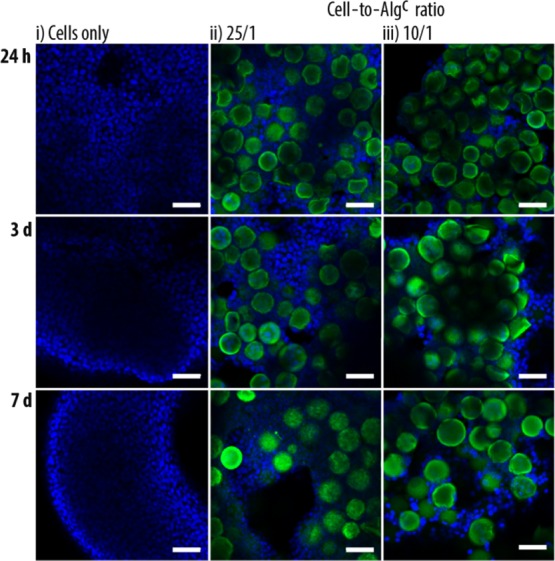
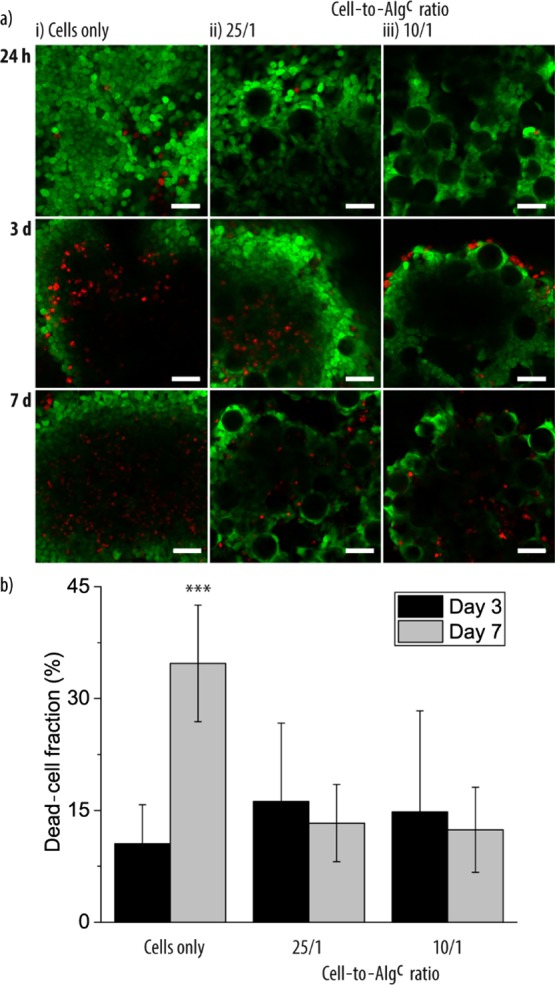
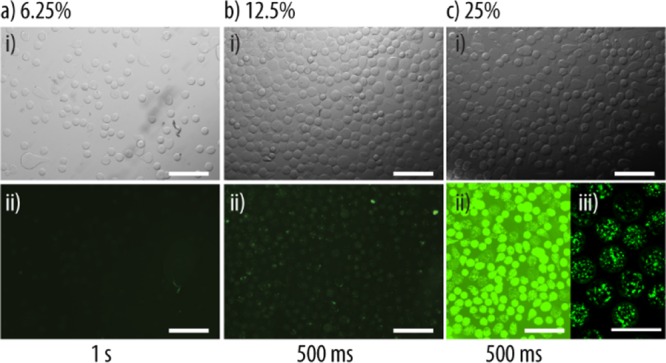
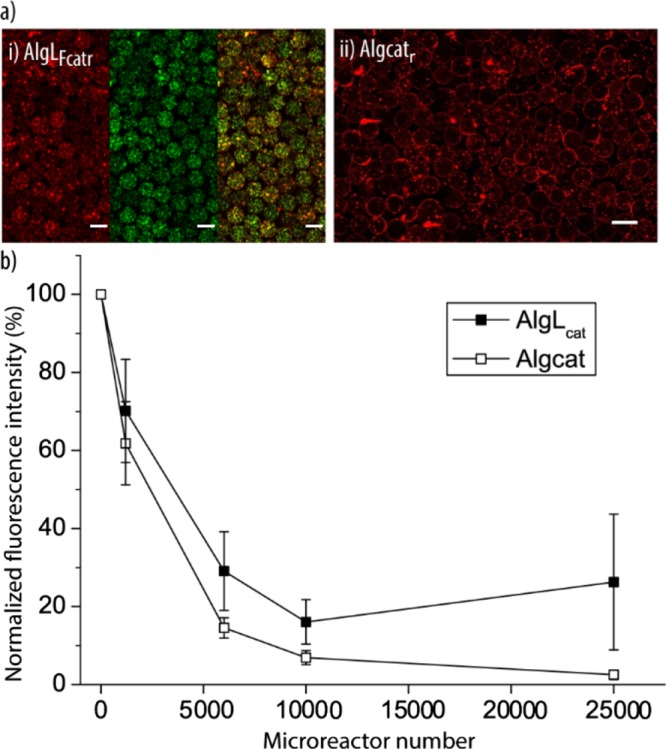
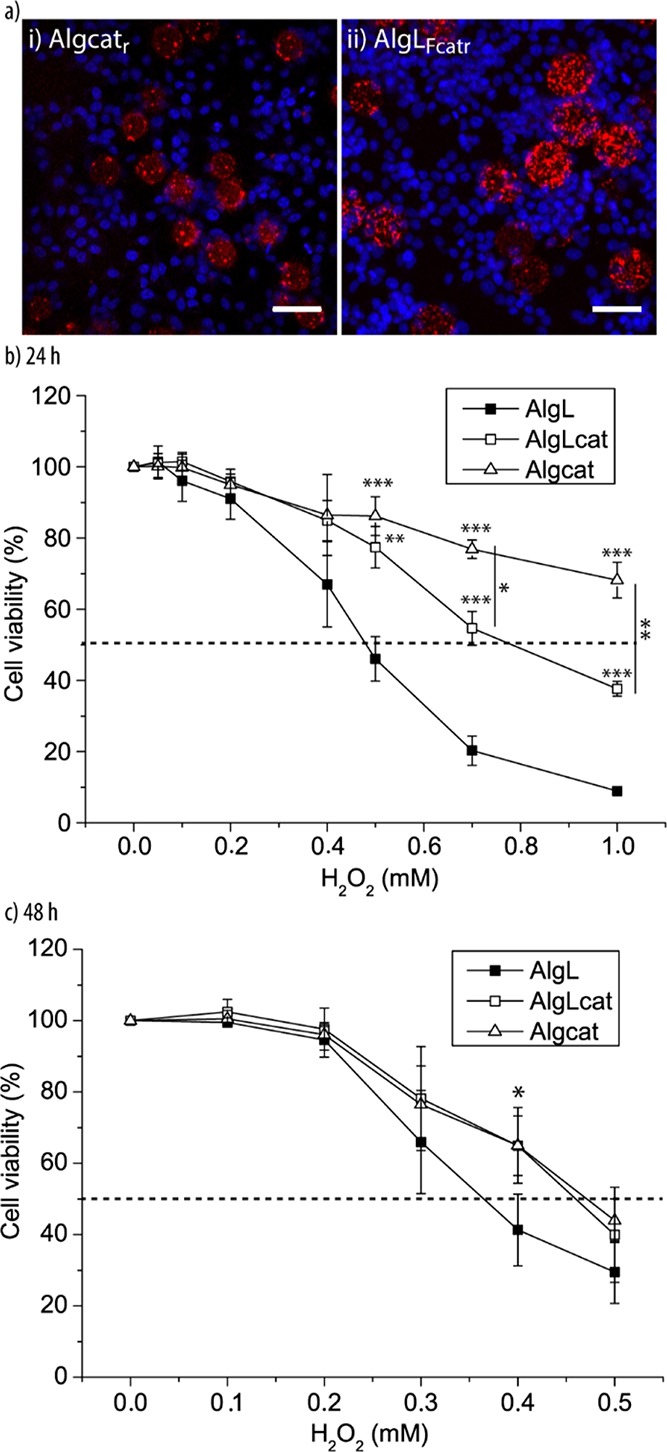
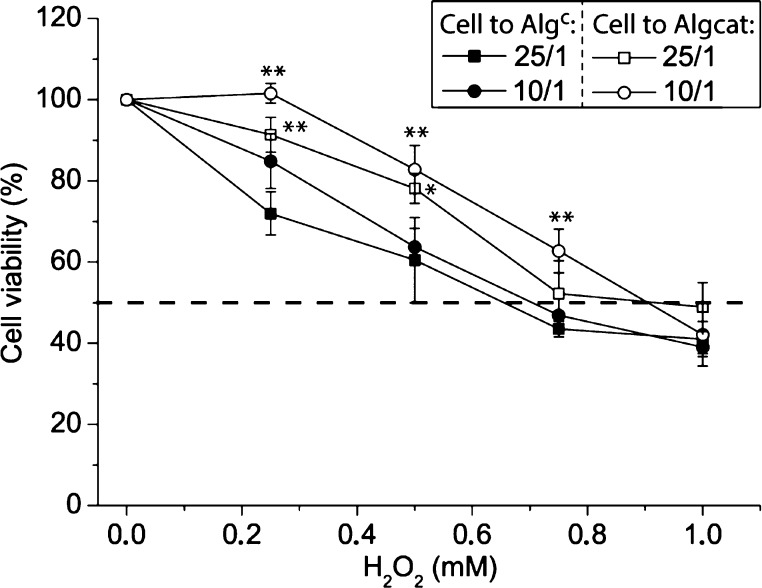
The assembly of microreactors has made considerable progress toward the fabrication of artificial cells. However, their characterization remains largely limited to buffer solution-based assays in the absence of their natural role model-the biological cells. Herein, the combination of microreactors with HepG2 cells either in planar cell cultures or in the form of cell aggregates is reported. Alginate (Alg)-based microreactors loaded with catalase are assembled by droplet microfluidics, and their activity is confirmed. The acceptance of polymer-coated ∼40 μm Alg particles by proliferating HepG2 cells is depending on the terminating polymer layer. When these functional microreactors are cocultured with HepG2 cells, they can be employed for detoxification, that is, hydrogen peroxide removal, and by doing so, they assist the cells to survive. This report is among the first successful combination of microreactors with biological cells, that is, HepG2 cells, contributing to the fundamental understanding of integrating synthetic and biological partners toward the maturation of this semisynthetic concept for biomedical applications.


Conflict of interest statement

The authors declare no competing financial interest.

Figures

Scheme 1
Scheme 1. Schematic Illustration of the Combination of Microreactors and HepG2 Cells
(a) Assembly: schematic illustration of the Alg particle fabrication using D-μF and their coating with poly(l-lysine) (PLL) or cholesterol-modified poly(methacrylic acid) (PMA) (PMAc) (right inset). Two types of microreactors are assembled: AlgLcat consisting of Alg carrier particles with entrapped catalase-loaded liposomal subunits (Lcat) and Algcat consisting of Alg carrier particles with entrapped catalase (cat) (left inset). (b) Microreactors and HepG2 cells are mixed in solution, followed by their co-culturing. The HepG2 cells are allowed to be in planar cell culture and in cell aggregates. (c) These combinations of synthetic microreactors and HepG2 cells are exposed to hydrogen peroxide (H2O2), and the ability of the artificial partner to support the viability of the HepG2 cells is assessed.
Figure 1
Figure 1
Bright-field (top) and SEM (bottom) images of (i) Alg, (ii) Alg+, (iii) Alg+ (2×), (iv) Algc, and (v) Algc (2×). (ii—inset) Fluorescent microscopy image of Alg particles after exposure to fluorescently labeled PLL (PLLF). The scale bars are 50 and 20 μm in the insets.
Figure 2
Figure 2
Surface coatings: (a) representative CLSM images, taken at different focal planes, of the coated Alg+ (i) and Algc (ii) particles cocultured with the HepG2 cells for 72 h (cell-to-particle ratio 25/1). The scale bars are 50 μm [blue: 6-diamidino-2-phenylindole (DAPI)-stained nuclei; green: fluorescently labeled Alg; and red: phalloidin-stained cytoskeleton]. (b) Cell viability: the viability of the HepG2 cells in the cocultures in comparison to that of a HepG2 monoculture is shown by assessing the activity of cellular dehydrogenase (culture time: 72 h, cell-to-Alg-based particle ratio: 25/1, and n = 3).
Figure 3
Figure 3
(a) Representative CLSM images, taken at different focal planes, of Algc cocultured with the HepG2 cells for 7 d (i) and 10 d (ii) (cell-to-Algc ratio 25/1). The scale bars are 50 μm (blue: DAPI-stained nuclei; green: fluorescently labeled Alg; and red: phalloidin-stained cytoskeleton). (b) Viability of the HepG2 cells in the cocultures in comparison to that of a HepG2 monoculture is shown by assessing the activity of cellular dehydrogenase (culture time: 7 and 10 d, cell-to-Algc ratio: 25/1, and n = 3). (c) dsDNA quantification of HepG2 cell/Algc cocultures (cell-to-Algc ratios: 25/1 and 10/1) in comparison to cells only after 3 d, 5 d, 7 d, 10 d, and 13 d (n = 3).
Figure 4
Figure 4
Cell aggregates—size: (a) bright-field images of cell aggregates assembled from HepG2 cells only (i) and HepG2 cells and Algc in a cell-to-particle ratio of 25/1 (ii) and 10/1 (iii). Images were taken after 24 h, 3 d, and 7 d. The scale bars are 500 μm. (b) Diameter of the different cell aggregates depending on the entities used for the fabrication and the incubation time (n = 3).
Figure 5
Figure 5
Representative CLSM images of cell aggregates assembled from HepG2 cells only (i) and HepG2 cells and Algc in a cell-to-particle ratio of 25/1 (ii) and 10/1 (iii). Images were taken after 24 h, 3 d, and 7 d. The scale bars are 50 μm (blue: DAPI-stained nuclei and green: PLLF of the coated Algc).
Figure 6
Figure 6
(a) Representative CLSM images of stained live (green)—dead (red) cell aggregates assembled from HepG2 cells only (i) and HepG2 cells and Algc in a cell-to-particle ratio of 25/1 (ii) and 10/1 (iii). Images were taken after 24 h, 3 d, and 7 d. The scale bars are 50 μm. (b) Dead-cell fraction of the cell aggregates assembled from HepG2 cells only and HepG2 cells and Algc in cell-to-particle ratios of 25/1 and 10/1 calculated after 3 and 7 d (n = 3, ***p < 0.001).
Figure 7
Figure 7
Microreactor assembly: (a) representative bright-field (i) and fluorescence (ii) images of AlgLF using 6.25 (a), 12.5 (b), and 25 (c) v % LF for their assembly by D-μF. The exposure times of the fluorescence images are noted on the bottom to facilitate image comparison. The scale bars are 200 μm. (ciii) CLSM image of AlgLF. The scale bars are 100 μm.
Figure 8
Figure 8
Microreactor activity: (a) representative CLSM images of fluorescently labeled microreactors AlgLFcatr (i) and Algcatr (ii) (red (catr): DyLight 633-labeled catalase and green (LF): NBD-PC-labeled lipids). The scale bars are 50 μm. (b) Activity of microreactors assessed via their ability to remove H2O2. The normalized fluorescence intensity of a H2O2-containing solution assessed by the Amplex Red assay after being exposed to AlgLcat and Algcat for 30 min is plotted (n = 3).
Figure 9
Figure 9
Microreactors in planar cell cultures: (a) representative CLSM images of bionic tissue of HepG2 cells and Algcatr (i) and AlgLFcatr (ii) after 6 h incubation time. The scale bars are 50 μm. Dose–response curves of bionic tissue consisting of HepG2 cells and Algcat, AlgLcat, or AlgL when exposed to different concentrations of H2O2 for 24 h (b) and 48 h (c) (n = 3, ***p < 0.001, **p < 0.01, and *p < 0.05).
Figure 10
Figure 10
Microreactors in cell aggregates: dose–response curves of cell aggregates consisting of HepG2 cells and either Algcat or Algc in cell-to-microreactor ratios of 25/1 or 10/1 when exposed to different concentrations of H2O2 for 24 h (n = 3, **p < 0.01, and *p < 0.05).

References

    1. Hosta-Rigau L.; Stadler B.. Subcompartmentalized Systems Toward Therapeutic Cell Mimics. In Selected Topics in Nanomedicine, 3rd ed.; Chang T. M. S., Ed.; World Science Publisher/Imperial College Press: Singapore, 2013; pp 281–299.
    1. Peters R. J. R. W.; Louzao I.; van Hest J. C. M. From polymeric nanoreactors to artificial organelles. Chem. Sci. 2012, 3, 335–342. 10.1039/c2sc00803c. - DOI
    1. Tanner P.; Baumann P.; Enea R.; Onaca O.; Palivan C.; Meier W. Polymeric Vesicles: From Drug Carriers to Nanoreactors and Artificial Organelles. Acc. Chem. Res. 2011, 44, 1039–1049. 10.1021/ar200036k. - DOI - PubMed
    1. Ben-Haim N.; Broz P.; Marsch S.; Meier W.; Hunziker P. Cell-Specific Integration of Artificial Organelles Based on Functionalized Polymer Vesicles. Nano Lett. 2008, 8, 1368–1373. 10.1021/nl080105g. - DOI - PubMed
    1. Tanner P.; Onaca O.; Balasubramanian V.; Meier W.; Palivan C. G. Enzymatic Cascade Reactions inside Polymeric Nanocontainers: A Means to Combat Oxidative Stress. Chem.—Eur. J. 2011, 17, 4552–4560. 10.1002/chem.201002782. - DOI - PubMed