. 2018 May 31;3(5):5459-5469.
doi: 10.1021/acsomega.8b00105. Epub 2018 May 21.

In Vitro Carcinoma Treatment Using Magnetic Nanocarriers under Ultrasound and Magnetic Fields

Affiliations

In Vitro Carcinoma Treatment Using Magnetic Nanocarriers under Ultrasound and Magnetic Fields

Somoshree Sengupta et al. ACS Omega. .

Abstract

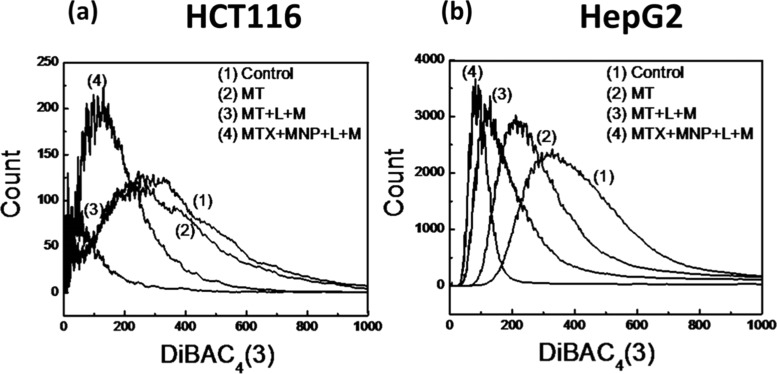
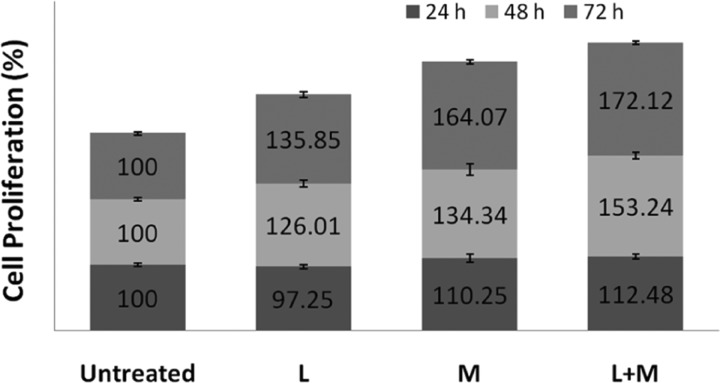
Nowadays, tumor hypoxia has become a more predominant problem for diagnosis as well as treatment of cancer due to difficulties in delivering chemotherapeutic drugs and their carriers to these regions with reduced vasculature and oxygen supply. In such cases, external physical stimulus-mediated drug delivery, such as ultrasound and magnetic fields, would be effective. In this work, the effect of simultaneous exposure of low-intensity pulsed ultrasound and static magnetic field on colon (HCT116) and hepatocellular (HepG2) carcinoma cell inhibition was assessed in vitro. The treatment, in the presence of anticancer drug, with and without magnetic carrier, significantly increased the reactive oxygen species production and hyperpolarized the cancer cells. As a result, a significant increase in cell inhibition, up to 86%, was observed compared to 50% inhibition with bare anticancer drug. The treatment appears to have relatively more effect on HepG2 cells during the initial 24 h than on HCT116 cells. The proposed treatment was also found to reduce cancer cell necrosis and did not show any inhibitory effect on healthy cells (MC3T3). Our in vitro results suggest that this approach has strong application potential to treat cancer at lower drug dosage to achieve similar inhibition and can reduce health risks associated with drugs.


Conflict of interest statement

The authors declare no competing financial interest.

Figures

Figure 1
Figure 1
(a) XRD analysis of MNP after calcination at 450 °C for 2 h. (b) Particle size analysis of MT + MNP. (c) FTIR spectra of (A) MNP (α-Fe2O3), (B) MT + MNP (MT + α-Fe2O3), and (C) MT. (d) Thermogravimetric (TG) analysis (TGA) of (A) MNP, (B) MT + MNP, and (C) MT. (e) Magnetic properties of (A) MNP and (B) MT + MNP. (f) Transmission electron microscopy analysis of MT + MNP. (g) Release of MT from MT + MNP in phosphate-buffered saline (PBS, pH 7.4).
Figure 2
Figure 2
(a) HCT116 cell proliferation under 15 min/day treatment of 30 mW/cm2 LIPUS (L), 3.5 mT SMF (L + M3.5), and 30 mW/cm2 LIPUS + 150 mT SMF (L + M) (p < 0.05 between control and treated samples) (n = 12). (b) Dose response curve of MT on HCT116 cell viability and determination of IC50 (n = 3). (c) HCT116 cell proliferation under 15 min/day treatment of L + M when the cells were exposed to MT and MT + MNP (p < 0.05 between control and treated samples) (n = 12). (d) Proliferation assay of HepG2 cells under 15 min/day treatment of L + M3.5 and L + M (p < 0.05 between control and treated samples) (n = 12). (e) Dose response curve of MT on HepG2 cell viability and determination of IC50 (n = 3). (f) Proliferation assay of HepG2 under 15 min/day treatment of L + M when the cells were exposed to MT and MT + MNP (p < 0.05 between control and treated samples) (n = 12).
Figure 3
Figure 3
(a–d) Gated HCT116 cell population in different phases after 72 h of incubation (n = 6): (a) control (without MT); (b) MT-treated; (c) MT + L + M-treated; and (d) MT + MNP + L + M-treated. (e–h) HepG2 cell-cycle assessment showing gated cell population in different phases after 72 h incubation (n = 6): (e) control (without MT); (f) MT-treated; (g) MT + L + M-treated; and (h) MT + MNP + L + M-treated.
Figure 4
Figure 4
(a–d) Apoptosis analysis of HCT116 cells after 72 h incubation (n = 6): (a) control (without MT); (b) MT-treated; (c) MT + L + M-treated; and (d) MT + MNP + L + M-treated. (e–h) Apoptosis of HepG2 cells after 72 h incubation (n = 6): (e) control (without MT); (f) MT-treated; (g) MT + L + M-treated; and (h) MT + MNP + L + M-treated.
Figure 5
Figure 5
Measured intracellular ROS in terms of fluorescence intensity. (a) HCT116 cells treated with MT, MT + L + M, and MT + MNP + L + M. (b) HepG2 cells treated with MT, MT + L + M, and MT + MNP + L + M. The control group had no treatment.
Figure 6
Figure 6
Changes in the membrane potential determined using voltage-sensitive bis(1,3-dibutylbarbituric acid)trimethineoxonol (DiBAC4(3)) dye (n = 6): (a) HCT116 cells and (b) HepG2 cells.
Figure 7
Figure 7
(a) Morphology of DAPI-stained HCT116 and HepG2 cell nuclei under different treatment conditions after 72 h incubation. The arrows indicate the cells with damaged cell nucleus. (b) Quantification of HCT116 cell damage in terms of nucleus intensity in fluorescence images. (c) Changes in the fluorescence nucleus intensity of HepG2 cells under different treatment conditions.
Figure 8
Figure 8
Proliferation of MC3T3 cells (n = 3) exposed to LIPUS (30 mW/cm2) (L), SMF (150 mT) (M), and their combination (L + M) (p < 0.05 between untreated and treated samples).

References

    1. Brahimi-Horn M. C.; Chiche J.; Pouysségur J. Hypoxia and Cancer. J. Mol. Med. 2007, 85, 1301–1307. 10.1007/s00109-007-0281-3. - DOI - PubMed
    1. Brown J. M. Tumor Hypoxia in Cancer Therapy. Methods Enzymol. 2007, 435, 297–321. 10.1016/S0076-6879(07)35015-5. - DOI - PubMed
    1. Harada H. How Can We Overcome Tumor Hypoxia in Radiation Therapy. J. Radiat. Res. 2011, 52, 545–556. 10.1269/jrr.11056. - DOI - PubMed
    1. Avni R.; Cohen B.; Neeman M. Hypoxic Stress and Cancer: Imaging the Axis of Evil in Tumor Metastasis. NMR. Biomed. 2011, 24, 569–581. 10.1002/nbm.1632. - DOI - PMC - PubMed
    1. Felfoul O.; Mohammadi M.; Taherkhani S.; De Lanauze D.; Zhong Xu Y.; Loghin D.; Essa S.; Jancik S.; Houle D.; Lafleur M.; Gaboury L.; Tabrizian M.; Kaou N.; Atkin M.; Vuong T.; Batist G.; Beauchemin N.; Radzioch D.; Martel S. Magneto-Aerotactic Bacteria Deliver Drug-Containing Nanoliposomes to Tumour Hypoxic Regions. Nat. Nanotechnol. 2016, 11, 941–947. 10.1038/nnano.2016.137. - DOI - PMC - PubMed