. 2019 Feb;94(1):248-258.
doi: 10.1111/brv.12452. Epub 2018 Jul 19.

Gene transcription in bursting: a unified mode for realizing accuracy and stochasticity

Affiliations

Gene transcription in bursting: a unified mode for realizing accuracy and stochasticity

Yaolai Wang et al. Biol Rev Camb Philos Soc. 2019 Feb.

Abstract

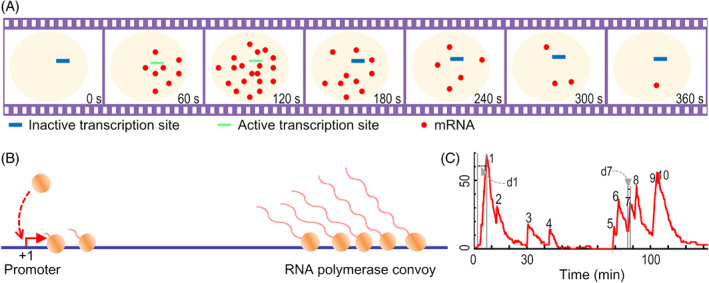
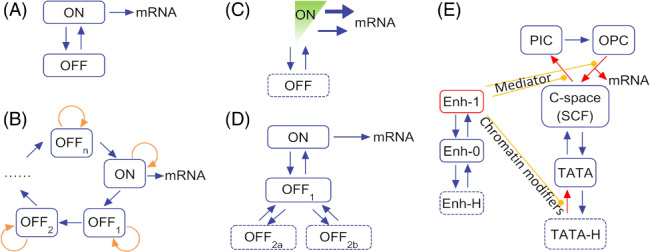
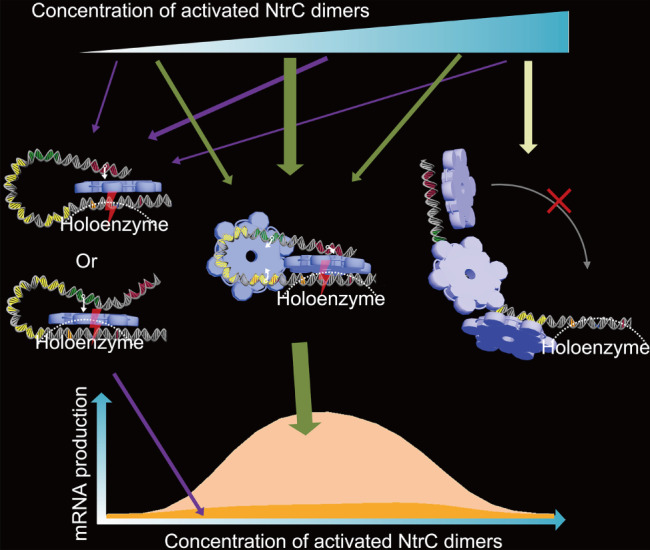
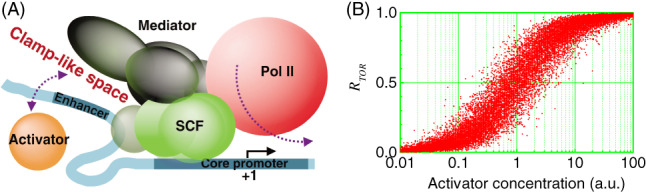
There is accumulating evidence that, from bacteria to mammalian cells, messenger RNAs (mRNAs) are produced in intermittent bursts - a much 'noisier' process than traditionally thought. Based on quantitative measurements at individual promoters, diverse phenomenological models have been proposed for transcriptional bursting. Nevertheless, the underlying molecular mechanisms and significance for cellular signalling remain elusive. Here, we review recent progress, address the above issues and illuminate our viewpoints with simulation results. Despite being widely used in modelling and in interpreting experimental data, the traditional two-state model is far from adequate to describe or infer the molecular basis and stochastic principles of transcription. In bacteria, DNA supercoiling contributes to the bursting of those genes that express at high levels and are topologically constrained in short loops; moreover, low-affinity cis-regulatory elements and unstable protein complexes can play a key role in transcriptional regulation. Integrating data on the architecture, kinetics, and transcriptional input-output function is a promising approach to uncovering the underlying dynamic mechanism. For eukaryotes, distinct bursting features described by the multi-scale and continuum models coincide with those predicted by four theoretically derived principles that govern how the transcription apparatus operates dynamically. This consistency suggests a unified framework for comprehending bursting dynamics at the level of the structural and kinetic basis of transcription. Moreover, the existing models can be unified by a generic model. Remarkably, transcriptional bursting enables regulatory information to be transmitted in a digital manner, with the burst frequency representing the strength of regulatory signals. Such a mode guarantees high fidelity for precise transcriptional regulation and also provides sufficient randomness for realizing cellular heterogeneity.

Keywords: MS2; PP7; WLW model; burst cluster; continuum model; frequency code; gene expression; multi-scale model; ratchet model; temporal occupancy rate.


Figures

Figure 1
Figure 1
Schematic of transcriptional bursting. (A) A burst of messenger RNAs (mRNAs) is produced in a short time period with the gene active. (B) During each active period, RNA polymerases successively escape from the promoter and elongate as a convoy, leading to a burst. Two convoys are shown separately in generation and elongation. (C) A sample time series of the number of cellular mRNAs. Ten bursts are shown, with the duration of the first and seventh bursts denoted by d1 and d7.
Figure 2
Figure 2
Models for transcriptional bursting. (A) Two‐state model. The gene has two alternative states, ON and OFF, whose lifetimes are usually assumed to obey two different exponential distributions. The mRNAs are produced via a Poisson process. (B) Ratchet model. A series of ordered sub‐OFF states exists. (C) Continuum model. Instead of a Poisson process, transcripts are generated at quasi‐continuous rates. (D) Multi‐scale model. Multiple layers of sub‐OFF states exist. (E) The Wang–Liu–Wang (WLW) model. The core promoter region is described as converting among five states, which are ‘being occupied by histones (TATA‐H)’, ‘naked (TATA)’, ‘being occupied by the C‐space (SCF), PIC or OPC’. The ‘C‐space’ refers to a clamp‐like space formed between the Mediator and the enhancer. The enhancer (Enh) has three states, i.e. being bound by histones (Enh‐H) or an activator (Enh‐1), or naked (Enh‐0). OPC, open complex; PIC, pre‐initiation complex; SCF, scaffold complex; TATA, TATA‐box.
Figure 3
Figure 3
Molecular mechanisms for transcriptional regulation at the glnAp2 promoter. A transcriptional activator nitrogen regulatory protein C (NtrC) hexamer (shown in blue) formed at the remote or proximal enhancer (separately coloured in red and green; the connection between an enhancer and an NtrC hexamer is denoted by white arrows) is able to catalyse the polymerase holoenzyme (outlined by a dashed line) at the core promoter (the −24, −12, and +1 sites are denoted in orange, blue, and red, respectively). For a wide range of NtrC concentrations, these two modes only contribute to a small proportion of messenger RNAs (mRNAs) produced, since it takes a long time for the hexamers to find the holoenzyme. In the third mode, there exists a DNA bridging—an NtrC hexamer connects the proximal enhancer to a low‐affinity site (the three low‐affinity sites are coloured in yellow). This bridging facilitates the hexamer at the remote enhancer to catalyse multiple rounds of transcription initiation. At very high concentrations of NtrC dimers, NtrC oligomers are formed at the low‐affinity sites, rendering the DNA rigid and turning the gene off.
Figure 4
Figure 4
General mechanism of how the transcription apparatus operates in eukaryotes. (A) The Mediator, which is a component of the scaffold complex (SCF), is temporarily tethered in the vicinity of the enhancer, forming a clamp‐like space (C‐space) where activators cycle in and out. With an activator in the C‐space, RNA polymerase II (Pol II) initiates transcription rapidly, leading to a burst of messenger RNAs (mRNAs). (B) With increasing activator concentration, the activators' temporal occupancy rate in the C‐space, R TOR, rises and saturates in probability. The relationship is a statistical mapping, meaning that slight fluctuations in activator concentration (i.e. extrinsic noise) can be filtered out, thus endowing transcriptional regulation with strong robustness. Shown are simulation results under the condition that activators have cycled for five rounds. Reprinted from Wang et al. (2012).
Figure 5
Figure 5
Concurrent multi‐scale and continuum features of transcriptional bursting. Shown are simulation results with the Wang–Liu–Wang (WLW) model. Transcription initiation events are denoted by violet vertical lines, with the inset showing an enlarged view. Enh‐1 denotes whether the enhancer (Enh) is bound by activators, with the upper parts of the line denoting the bound state. SCF and TATA‐H denote whether the TATA‐box in the core promoter region is occupied by the scaffold complex (SCF) and histones (H), respectively. The dynamics of activators cycling in the C‐space, the formation and destruction of the SCF, and occupancy of the core promoter by histones endow the bursts with multiple time scales. The time intervals between two successive initiation events do not obey a single exponential distribution, as shown in the inset.
Figure 6
Figure 6
Modulation of transcriptional bursts. Increasing the activator concentration leads to more frequent cycling of activators in the C‐space, with the distribution of residence time unaffected. The residence times shape the occurrence of transcription initiation events, thereby controlling the time series of mRNA number. As a result, the burst frequency, rather than burst size, is subject to modulation by activator concentration. Note that the bursting with high frequency makes it hard to differentiate between two successive bursts.

References

    1. Albayrak, C. , Jordi, C. A. , Zechner, C. , Lin, J. , Bichsel, C. A. , Khammash, M. & Tay, S. (2016). Digital quantification of proteins and mRNA in single mammalian cells. Molecular Cell 61, 914–924. - PubMed
    1. Annibale, P. & Gratton, E. (2015). Single cell visualization of transcription kinetics variance of highly mobile identical genes using 3D nanoimaging. Scientific Reports 5, 9258. - PMC - PubMed
    1. Bahar Halpern, K. , Caspi, I. , Lemze, D. , Levy, M. , Landen, S. , Elinav, E. , Ulitsky, I. & Itzkovitz, S. (2015). Nuclear retention of mRNA in mammalian tissues. Cell Reports 13, 2653–2662. - PMC - PubMed
    1. Bartman, C. R. , Hsu, S. C. , Hsiung, C. C. S. , Raj, A. & Blobel, G. A. (2016). Enhancer regulation of transcriptional bursting parameters revealed by forced chromatin looping. Molecular Cell 62, 237–247. - PMC - PubMed
    1. Battich, N. , Stoeger, T. & Pelkmans, L. (2013). Image‐based transcriptomics in thousands of single human cells at single‐molecule resolution. Nature Methods 10, 1127–1133. - PubMed

LinkOut - more resources