. 2018 Jul 16;126(7):077004.
doi: 10.1289/EHP3096. eCollection 2018 Jul.

Evaluation of a Physiologically Based Pharmacokinetic (PBPK) Model for Inorganic Arsenic Exposure Using Data from Two Diverse Human Populations

Affiliations

Evaluation of a Physiologically Based Pharmacokinetic (PBPK) Model for Inorganic Arsenic Exposure Using Data from Two Diverse Human Populations

Hisham A El-Masri et al. Environ Health Perspect. .

Erratum in

Abstract

Background: Multiple epidemiological studies exist for some of the well-studied health endpoints associated with inorganic arsenic (iAs) exposure; however, results are usually expressed in terms of different exposure/dose metrics. Physiologically based pharmacokinetic (PBPK) models may be used to obtain a common exposure metric for application in dose-response meta-analysis.

Objective: A previously published PBPK model for inorganic arsenic (iAs) was evaluated using data sets for arsenic-exposed populations from Bangladesh and the United States.

Methods: The first data set was provided by the Health Effects of Arsenic Longitudinal Study cohort in Bangladesh. The second data set was provided by a study conducted in Churchill County, Nevada, USA. The PBPK model consisted of submodels describing the absorption, distribution, metabolism and excretion (ADME) of iAs and its metabolites monomethylarsenic (MMA) and dimethylarsenic (DMA) acids. The model was used to estimate total arsenic levels in urine in response to oral ingestion of iAs. To compare predictions of the PBPK model against observations, urinary arsenic concentration and creatinine-adjusted urinary arsenic concentration were simulated. As part of the evaluation, both water and dietary intakes of arsenic were estimated and used to generate the associated urine concentrations of the chemical in exposed populations.

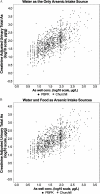
Results: When arsenic intake from water alone was considered, the results of the PBPK model underpredicted urinary arsenic concentrations for individuals with low levels of arsenic in drinking water and slightly overpredicted urinary arsenic concentrations in individuals with higher levels of arsenic in drinking water. When population-specific estimates of dietary intakes of iAs were included in exposures, the predictive value of the PBPK model was markedly improved, particularly at lower levels of arsenic intake.

Conclusions: Evaluations of this PBPK model illustrate its adequacy and usefulness for oral exposure reconstructions in human health risk assessment, particularly in individuals who are exposed to relatively low levels of arsenic in water or food. https://doi.org/10.1289/EHP3096.


Figures

Figures 1A and 1B are graphical representations plotting creatinine adjusted urinary As (log 10 scale, micrograms per gram) (y-axis) across As well water concentrations (log 10 scale, micrograms per liter) (x-axis) as per the data from the HEALS and the Churchill, respectively.
Figure 1.
Relationship between arsenic water concentrations and reported creatinine-adjusted total urinary arsenic concentrations from the HEALS (Panel A) and Churchill County data (Panel B).
Figures 2A and 2B are graphical representations plotting creatinine adjusted urinary total As (log 10 scale, micrograms per gram) (y-axis) across As well water concentrations (log 10 scale, micrograms per liter) (x-axis) as per the data from PBPK and HEALS for the water as the only arsenic intake source and water and food as the arsenic intake sources, respectively.
Figure 2.
Relationship between arsenic water levels and PBPK model-predicted creatinine-adjusted urinary arsenic concentrations for the HEALS data set. Light and dark dots are measured and predicted total arsenic concentrations in urine; respectively. Panel A: well water as the only arsenic intake source. Panel B: well water and dietary exposure as the arsenic intake source.
Boxplot of creatinine adjusted As concentrations. Creatinine-adjusted urinary arsenic concentrations (log 10 scale, micrograms per gram) (y-axis) are plotted across As well water concentrations (log 10 scale, micrograms per liter) (x-axis) as per the values observed from HEALS, values with water only as a source, and values for both water and food as exposure sources.
Figure 3.
Creatinine-adjusted urinary arsenic concentrations, by decile of arsenic water levels. For each decile, the left box (blue) shows HEALS observed values, the center box (pink) shows predicted values with water only as a source, and the right box (green) shows predicted values for both water and food as exposure sources. The boxplots are a convenient graphical method to depict all data. The top of each box is the upper quartile (25% of data is greater than this value), and the bottom end is the lower quartile (25% of data is less than this value). Horizontal line in the middle of each box is the median value. Top and bottom ends of the whiskers for each box are the maximum value, and minimum values for the data; respectively. Dots for each box depict the outliers where the top ones are measures for data where values exceed 3/2 times the upper quantile limit, and lower dots are outliers where data is less than 3/2 times of lower quartile limit.
Figures 4A and 4B are graphical representations plotting creatinine adjusted urinary total As (log 10 scale, micrograms per gram) (y-axis) across As well water concentrations (log 10 scale, micrograms per liter) (x-axis) as per the data from PBPK and Churchill for the water as the only arsenic intake source and water and food as the arsenic intake sources, respectively.
Figure 4.
Relationship between arsenic water levels and PBPK model-predicted creatinine-adjusted urinary arsenic concentrations for the Churchill County data set. Light and dark dots are measured and predicted total arsenic concentrations in urine; respectively. Panel A is for well water as the only arsenic intake source; Panel B is for well water and food exposures as arsenic intake sources.
Boxplot of creatinine adjusted As concentrations. Creatinine adjusted urinary arsenic concentrations (log 10 scale, micrograms per gram) (y-axis) are plotted across As well water concentrations (log 10 scale, micrograms per liter) (x-axis) as per the values observed from Churchill, values with water only as a source, and values for both water and food as exposure sources.
Figure 5.
Creatinine-adjusted urinary arsenic concentrations, presented by decile of arsenic water levels. For each decile, the left box (blue) shows Churchill County observed values, the center box (pink) shows predicted values with water only as a source, and the right box (green) shows predicted values for both water and food as exposure sources. The boxplots are a convenient graphical method to depict all data. The top of each box is the upper quartile (25% of data is greater than this value), and the bottom end is the lower quartile (25% of data is less than this value). Horizontal line in the middle of each box is the median value. Top and bottom ends of the whiskers for each box are the maximum value, and minimum values for the data; respectively. Dots for each box depict the outliers where the top ones are measures for data where values exceed 3/2 times the upper quantile limit, and lower dots are outliers where data is less than 3/2 times of lower quartile limit.

References

    1. Ahsan H, Chen Y, Parvez F, Argos M, Hussain AI, Momotaj H, et al. 2006. Health effects of arsenic longitudinal study (heals): description of a multidisciplinary epidemiologic investigation. J Expo Sci Environ Epidemiol 16(2):191–205, PMID: 16160703, 10.1038/sj.jea.7500449. - DOI - PubMed
    1. Arslan B, Djamgoz MBA, Akün E. 2017. Arsenic: a review on exposure pathways, accumulation, mobility and transmission into the human food chain. Rev Environ Contam Toxicol 243:27–51, PMID: 28005215, 10.1007/398_2016_18. - DOI - PubMed
    1. ATSDR (Agency for Toxic Substances and Disease Registry). 2007. “Toxicological profile for arsenic (update) [ATSDR Tox Profile]”. Atlanta, GA: U.S. Department of Health and Human Services, Public Health Service; http://www.atsdr.cdc.gov/toxprofiles/tp.asp?id=22&tid=3 [accessed 24 May 2018].
    1. Ayotte JD, Medalie L, Qi SL, Backer LC, Nolan BT. 2017. Estimating the high-arsenic domestic-well population in the conterminous United States. Environ Sci Technol 51(21):12443–12454, PMID: 29043784, 10.1021/acs.est.7b02881. - DOI - PMC - PubMed
    1. Bhattacharya S, Gupta K, Debnath S, Ghosh UC, Chattopadhyay D, Mukhopadhyay A. 2012. Arsenic bioaccumulation in rice and edible plants and subsequent transmission through food chain in Bengal basin: a review of the perspectives for environmental health. Toxicol Environ Chem 94(3):429–441, 10.1080/02772248.2012.657200. - DOI

MeSH terms