Randomized Controlled Trial
. 2018 Oct 1;128(10):4429-4440.
doi: 10.1172/JCI121484. Epub 2018 Jul 19.

Th1 memory differentiates recombinant from live herpes zoster vaccines

Affiliations
Randomized Controlled Trial

Th1 memory differentiates recombinant from live herpes zoster vaccines

Myron J Levin et al. J Clin Invest. .

Abstract

The adjuvanted varicella-zoster virus (VZV) glycoprotein E (gE) subunit herpes zoster vaccine (HZ/su) confers higher protection against HZ than the live attenuated zoster vaccine (ZV). To understand the immunologic basis for the different efficacies of the vaccines, we compared immune responses to the vaccines in adults 50 to 85 years old. gE-specific T cells were very low/undetectable before vaccination when analyzed by FluoroSpot and flow cytometry. Both ZV and HZ/su increased gE-specific responses, but at peak memory response (PMR) after vaccination (30 days after ZV or after the second dose of HZ/su), gE-specific CD4+ and CD8+ T cell responses were 10-fold or more higher in HZ/su compared with ZV recipients. Comparing the vaccines, T cell memory responses, including gE-IL-2+ and VZV-IL-2+ spot-forming cells (SFCs), were higher in HZ/su recipients and cytotoxic and effector responses were lower. At 1 year after vaccination, all gE-Th1 and VZV-IL-2+ SFCs remained higher in HZ/su compared with ZV recipients. Mediation analyses showed that IL-2+ PMR were necessary for the persistence of Th1 responses to either vaccine and VZV-IL-2+ PMR explained 73% of the total effect of HZ/su on persistence. This emphasizes the biological importance of the memory responses, which were clearly superior in HZ/su compared with ZV participants.

Keywords: Adaptive immunity; Infectious disease; Vaccines.


Conflict of interest statement

Conflict of interest: MJL and AW receive research support from GSK, Merck, and MedImmune. MJL is a consultant for Merck and GSK. MJL is listed as an inventor on the patent on Zostavax (no. 5,997,880).

Figures

Figure 1
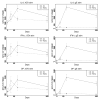
Figure 1. Kinetics of Th1 responses to HZ/su and ZV measured by FluoroSpot.
Data were derived from 158 participants equally distributed between those receiving ZV, administered at day 0, and those receiving HZ/su, administered in 2 doses, at days 0 and 60. The graphs show mean ± SEM SFCs/106 PBMCs over time in all ZV recipients (squares and dotted lines) and HZ/su recipients (circles and lines). The ordinates are on a natural logarithmic scale. Right column shows responses to VZV and left column to gE ex vivo restimulation. Upper row shows IL-2, middle row shows IFN-γ, and bottom row shows DP responses. Regression analyses adjusted for baseline and for multiple comparisons showed significantly higher VZV–IL-2 and gE–IL-2, gE–IFN-γ, and DP responses 30 days after the last dose of vaccine in HZ/su compared with ZV recipients (FDR-adjusted P ≤ 0.01). For individual age/treatment groups, see Supplemental Figure 2.
Figure 2
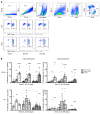
Figure 2. gE-specific CD4+ and CD8+ T cell PMR proliferation.
Data were derived from 18 HZ/su young, 17 HZ/su old, 20 HZ/su boosted, 6 ZV young, 9 ZV old, and 9 ZV boosted. (A) Gating strategy. (B) Summary of proliferation in each age and treatment group. Percentage of proliferating cells of the parent indicates that proliferating CD4+ or CD8+ T cells are expressed as a percentage of the total CD4+ or CD8+ T cell parent population, as appropriate. Asterisks show the significance of differences compared with baseline using RMANOVA adjusted for multiple comparisons. *P < 0.05 and > 0.01, **P < 0.01 and > 0.001, ***P < 0.001, ****P < 0.0001. In addition, baseline-adjusted PMR regression analysis between vaccine groups had FDR-adjusted P < 0.0001. FS-A, forward scatter area; FS-H, forward scatter height; FS-W, forward scatter width; SS-A, side scatter area.
Figure 3
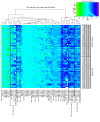
Figure 3. Conventional and regulatory T cell responses in HZ/su and ZV recipients at PMR.
PMR was day 30 for ZV and 90 for HZ/su recipients. Data were derived from 60 participants equally distributed across vaccination and age groups. The heatmap T cell responses to VZV ex vivo restimulation were grouped by unbiased hierarchical clustering. Each column represents a T cell subset and each row an individual participant. A, ZV primary group; B, HZ/su primary group; C, ZV boosted group; D, HZ/su boosted group. The rectangles identify T cell clusters.
Figure 4
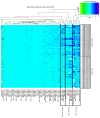
Figure 4. Conventional and regulatory T cell responses in HZ/su and ZV recipients at PMR.
PMR was day 30 for ZV and 90 for HZ/su recipients. Data were derived from 60 participants equally distributed across vaccination and age groups. The heatmap T cell responses to VZV ex vivo restimulation were grouped by unbiased hierarchical clustering. Each column represents a T cell subset and each row an individual participant. A, ZV primary group; B, HZ/su primary group; C, ZV boosted group; D, HZ/su boosted group. The rectangles identify T cell clusters.
Figure 5
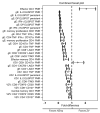
Figure 5. Hierarchical presentation of T cell responses that significantly differentiate the 2 vaccines.
Data were derived from 158 participants for ELISpot, 94 for proliferation, and 60 for T cell differentiation and functional PMR. The plot shows means estimated for the fold differences of ZV/HZ/su results and 95% CI for significantly different parameters (95% CI does not overlap the null effect, i.e., equivalence, indicated by the dotted vertical line). All other parameters are shown in Supplemental Figure 7. The stimulant and T cell responses are indicated on the coordinate. Means of less than 1 indicate higher responses in the HZ/su group, and those greater than 1 indicate higher responses in the ZV group.

Comment in

References

    1. Levin MJ. Zoster vaccines. In: Plotkin S, Orenstein W, Offitt P, Edwards KM, ed. Plotkin’s vaccines. 7th E. Philadelphia, PA: Elsevier; 2017:1268–1281.
    1. Gershon AA, Gershon MD. Pathogenesis and current approaches to control of varicella-zoster virus infections. Clin Microbiol Rev. 2013;26(4):728–743. doi: 10.1128/CMR.00052-13. - DOI - PMC - PubMed
    1. Weinberg A, Levin MJ. VZV T cell-mediated immunity. Curr Top Microbiol Immunol. 2010;342:341–357. - PubMed
    1. Weinberg A, et al. Influence of age and nature of primary infection on varicella-zoster virus-specific cell-mediated immune responses. J Infect Dis. 2010;201(7):1024–1030. doi: 10.1086/651199. - DOI - PMC - PubMed
    1. Chen SY, et al. Incidence of herpes zoster in patients with altered immune function. Infection. 2014;42(2):325–334. doi: 10.1007/s15010-013-0550-8. - DOI - PMC - PubMed

Publication types

MeSH terms