. 2018 Jul 19;14(7):e1007486.
doi: 10.1371/journal.pgen.1007486. eCollection 2018 Jul.

Rad51 recruitment and exclusion of non-homologous end joining during homologous recombination at a Tus/Ter mammalian replication fork barrier

Affiliations

Rad51 recruitment and exclusion of non-homologous end joining during homologous recombination at a Tus/Ter mammalian replication fork barrier

Nicholas A Willis et al. PLoS Genet. .

Abstract

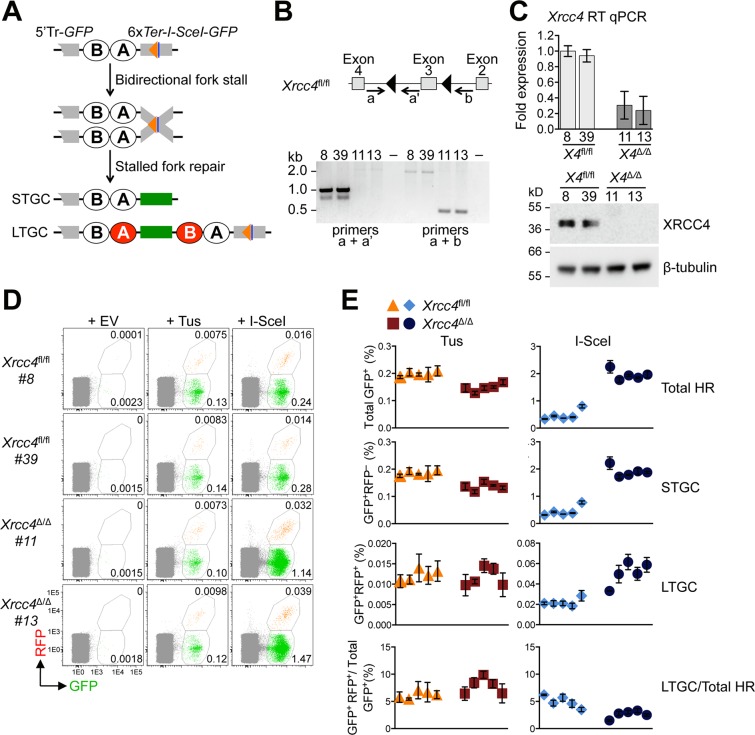
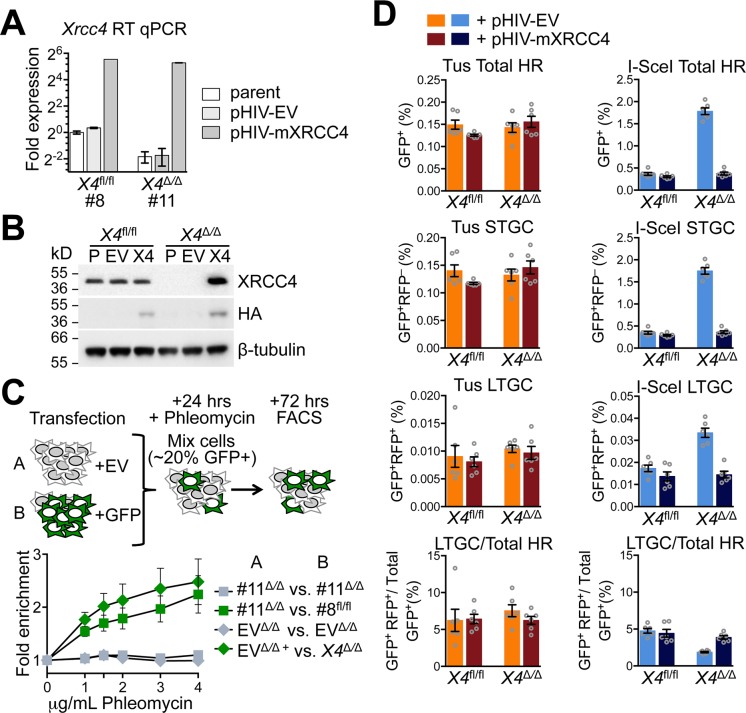
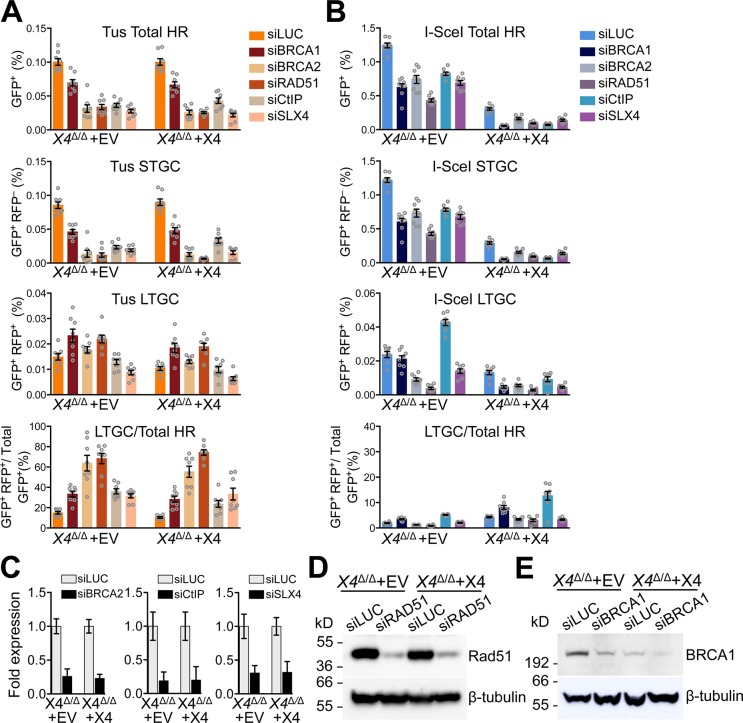
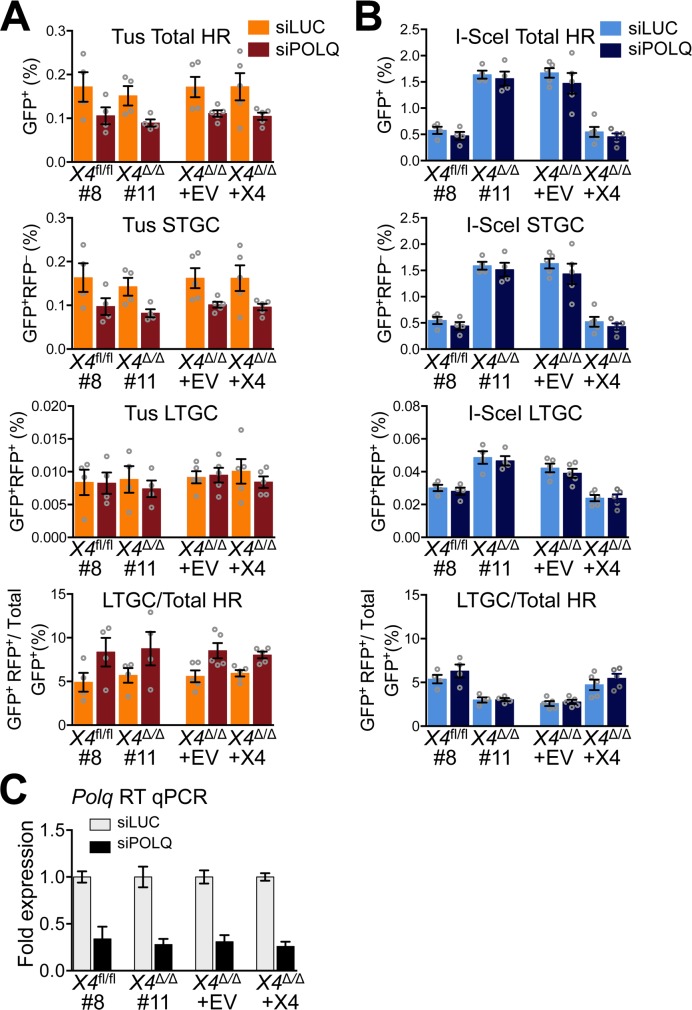
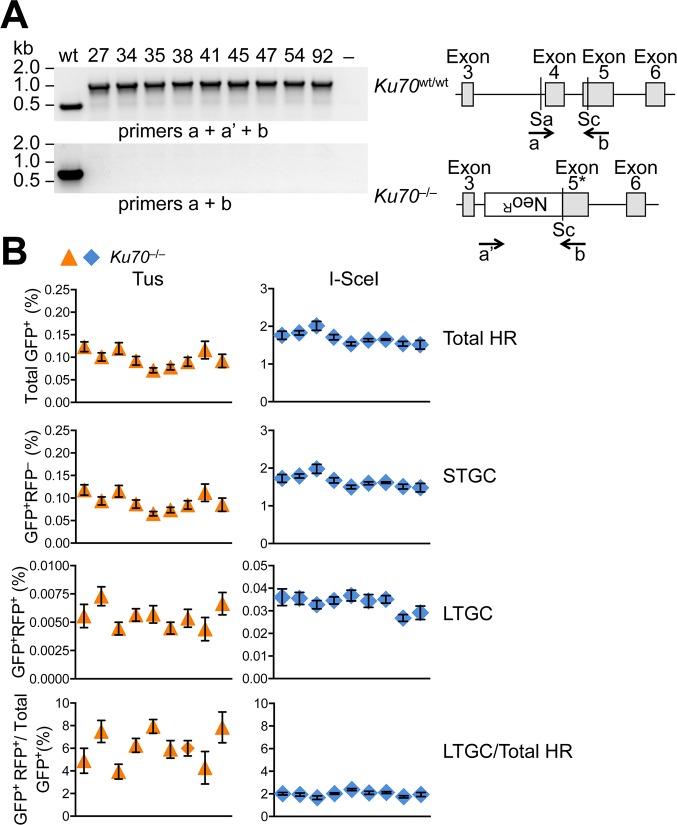
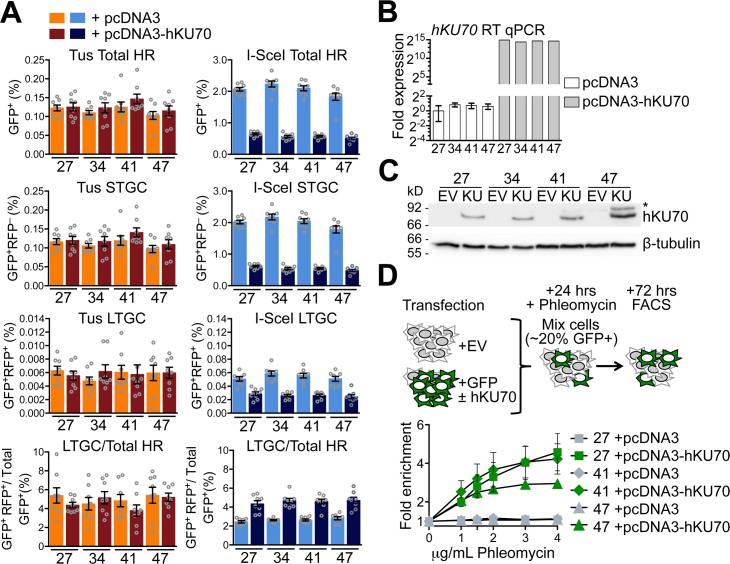
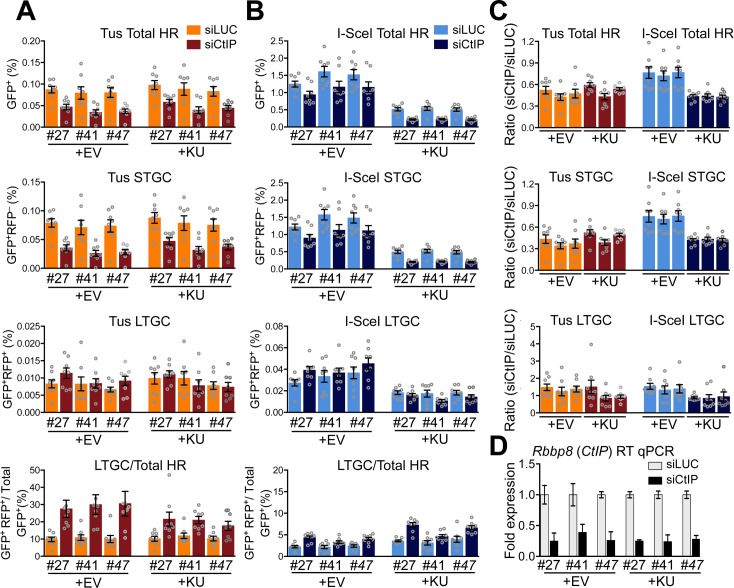
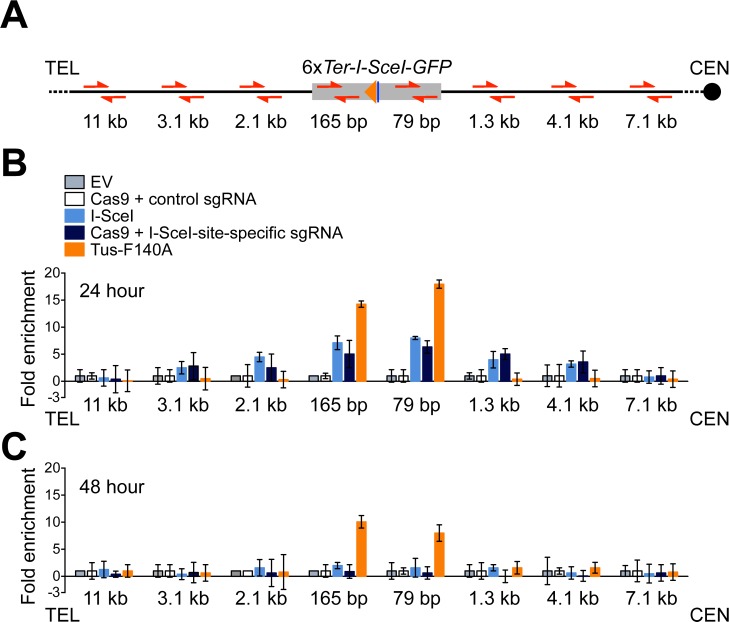
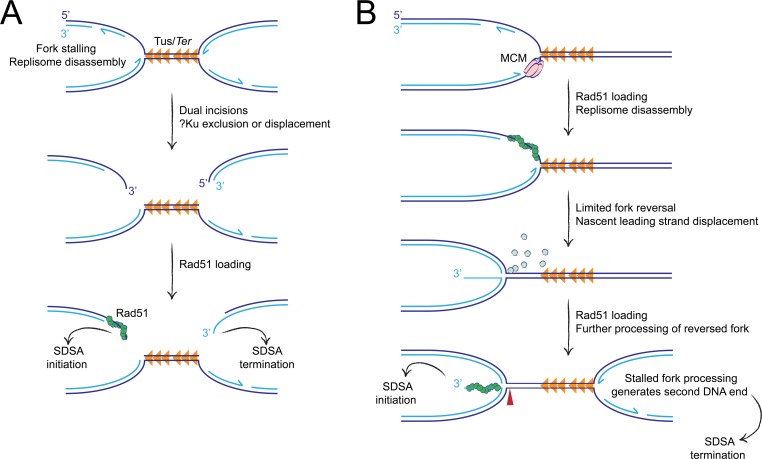
Classical non-homologous end joining (C-NHEJ) and homologous recombination (HR) compete to repair mammalian chromosomal double strand breaks (DSBs). However, C-NHEJ has no impact on HR induced by DNA nicking enzymes. In this case, the replication fork is thought to convert the DNA nick into a one-ended DSB, which lacks a readily available partner for C-NHEJ. Whether C-NHEJ competes with HR at a non-enzymatic mammalian replication fork barrier (RFB) remains unknown. We previously showed that conservative "short tract" gene conversion (STGC) induced by a chromosomal Tus/Ter RFB is a product of bidirectional replication fork stalling. This finding raises the possibility that Tus/Ter-induced STGC proceeds via a two-ended DSB intermediate. If so, Tus/Ter-induced STGC might be subject to competition by C-NHEJ. However, in contrast to the DSB response, where genetic ablation of C-NHEJ stimulates HR, we report here that Tus/Ter-induced HR is unaffected by deletion of either of two C-NHEJ genes, Xrcc4 or Ku70. These results show that Tus/Ter-induced HR does not entail the formation of a two-ended DSB to which C-NHEJ has competitive access. We found no evidence that the alternative end-joining factor, DNA polymerase θ, competes with Tus/Ter-induced HR. We used chromatin-immunoprecipitation to compare Rad51 recruitment to a Tus/Ter RFB and to a neighboring site-specific DSB. Rad51 accumulation at Tus/Ter was more intense and more sustained than at a DSB. In contrast to the DSB response, Rad51 accumulation at Tus/Ter was restricted to within a few hundred base pairs of the RFB. Taken together, these findings suggest that the major DNA structures that bind Rad51 at a Tus/Ter RFB are not conventional DSBs. We propose that Rad51 acts as an "early responder" at stalled forks, binding single stranded daughter strand gaps on the arrested lagging strand, and that Rad51-mediated fork remodeling generates HR intermediates that are incapable of Ku binding and therefore invisible to the C-NHEJ machinery.


Conflict of interest statement

The authors have declared that no competing interests exist.

Figures

Fig 1
Fig 1. Impact of Xrcc4 deletion on Tus/Ter-induced and I-SceI-induced HR.
A, Schematic of 6xTer-HR reporter and HR repair products of Tus-Ter-induced fork stalling. Green box: wtGFP. Grey boxes: mutant GFP. Open ovals A and B: 5’ and 3’ artificial RFP exons. 5’Tr-GFP: 5’-truncated GFP. Orange triangle: 6xTer element array. Navy blue line: I-SceI endonuclease cut site. STGC, LTGC: short tract and long tract gene conversion HR repair outcomes. LTGC generates wtRFP through RNA splicing (red filled ovals). B, Xrcc4 gene structure in Xrcc4fl/fl ES cells. Xrcc4Δ/Δ allele lacks exon 3. Black triangles: loxP sites. Grey boxes: Xrcc4 Exons 2–4. Location and direction of Exon3 genotyping primers a, a’, and b as indicated by arrows. Gel: PCR products for Xrcc4fl/fl ES clones 8 and 39, and Xrcc4Δ/Δ clones 11 and 13. C, RT qPCR analysis of Xrcc4 expression in Xrcc4fl/fl or Xrcc4Δ/Δ clones. Xrcc4 expression normalized to GAPDH and displayed as fold difference from Xrcc4fl/fl clone 8 of the same experiment (x = -2ΔΔCt, with ΔΔCt = [CtXrcc4-CtGapdh]-[CtXrcc4-CtGAPDH]). Error-bars represent standard deviation of the ΔCt value (SDEV = √[SDEVXrcc42 + SDEVGAPDH2]). Xrcc4 abundance by Western blot in Xrcc4fl/fl clones 8 and 39, and Xrcc4Δ/Δ clones 11 and 13 cell protein extracts. D, Representative primary FACS data for two Xrcc4fl/fl and two Xrcc4Δ/Δ 6xTer-HR reporter clones, as indicated, transfected with empty, 3xMyc-NLS Tus or 3xMyc-NLS I-SceI expression vectors. FACS plots produced from pooled data of duplicate samples from three independent experiments. Numbers represent percentages. E, Frequencies of Tus/Ter-induced and I-SceI-induced repair in five independently derived Xrcc4fl/fl (orange triangles, red squares) or Xrcc4Δ/Δ (blue diamonds, navy blue circles) 6xTer-HR reporter clones transiently transfected with empty, Tus or I-SceI expression vectors. Each dot plot represents the mean of duplicate samples from three independent experiments (n = 3), values are corrected for transfection efficiency–see Materials and Methods. Error bars: standard error of the mean (s.e.m.). One-way ANOVA (Analysis of Variance) test comparing trend in HR between five Xrcc4fl/fl and five Xrcc4Δ/Δ clones: Tus-induced HR, total HR, p = 0.0017; STGC, p = 0.0015; LTGC, p = 0.7142; LTGC/(Total HR), p = 0.2636. I-SceI-induced HR, total HR, p<0.0001; STGC, p<0.0001; LTGC, p<0.0001; LTGC/(Total HR), p<0.0001. T-test comparing Xrcc4fl/fl vs. Xrcc4Δ/Δ clone pooled data, Tus-induced HR: total HR, p<0.0001; STGC, p<0.0001; LTGC, p = 0.6864; LTGC/(Total HR), p = 0.0332; I-SceI-induced HR, total HR, p<0.0001; STGC, p<0.0001; LTGC, p<0.0001; LTGC/(Total HR), p<0.0001.
Fig 2
Fig 2. Stable re-expression of wtXrcc4 does not affect Tus/Ter-induced HR in Xrcc4Δ/Δ cells.
A, RT qPCR analysis of Xrcc4 expression in stably transduced Xrcc4fl/fl or Xrcc4Δ/Δ clones. Xrcc4 expression normalized to GAPDH and displayed as fold difference from Xrcc4fl/fl parental reporter clone 8 of the same experiment (x = -2ΔΔCt, with ΔΔCt = [CtXrcc4-CtGapdh]-[CtXrcc4-CtGAPDH]). Error-bars represent standard deviation of the ΔCt value (SDEV = √[SDEVXrcc42 + SDEVGAPDH2]). B, Xrcc4 protein abundance by Western blot in extracts of parental Xrcc4fl/fl clone #8 and Xrcc4Δ/Δ clone #11 and derivative cultures stably transduced with empty lentiviral vector (pHIV-NAT-hCD52, “EV”) or HA-tagged mouse Xrcc4 lentiviral expression vector (“X4”). C, Fold enrichment of cultures transiently expressing exogenous GFP. Results represent fold enrichment of cultures transiently co-transfected with pcDNA3beta and GFP-expression plasmid co-cultured cells transiently transfected with pcDNA3beta alone. Each plot represents the mean of triplicate samples from three independent experiments (n = 3), fold enrichment GFP+ cells normalized to 0 μg/mL phleomycin control. Error bars: s.e.m. D, Frequencies of Tus/Ter-induced and I-SceI-induced repair in Xrcc4fl/fl clone #8 or Xrcc4Δ/Δ clone #11 6xTer-HR reporter cells lentivirally transduced with pHIV-NAT-hCD52-EV (empty vector control) or pHIV-NAT-hCD52-mXrcc4 (expressing HA-tagged mouse Xrcc4 expression vector) with selection of transduced cells in 100 μg/ml NTC. Cells were transiently transfected with empty, 3xMyc-NLS Tus or 3xMyc-NLS I-SceI expression vectors. Each plot represents the mean of duplicate samples from six independent experiments (n = 6). Error bars: s.e.m. Tus-induced Total HR, t-test: flox8 +Xrcc4 vs. flox8 +EV p = 0.0662; del11 +Xrcc4 vs. del11 +EV p = 0.4509; del11 +EV vs. flox8 +EV p = 0.6719; del11 +Xrcc4 vs. flox8 +Xrcc4 p = 0.0588; del11 +Xrcc4 vs. flox8 +EV p = 0.5025. Tus-induced STGC, t-test: flox8 +Xrcc4 vs. flox8 +EV p = 0.0836; del11 +Xrcc4 vs. del11 +EV p = 0.4126; del11 +EV vs. flox8 +EV p = 0.6144; del11 +Xrcc4 vs. flox8 +Xrcc4 p = 0.0595; del11 +Xrcc4 vs. flox8 +EV p = 0.7215. Tus-induced LTGC, t-test: flox8 +Xrcc4 vs. flox8 +EV p = 0.6686; del11 +Xrcc4 vs. del11 +EV p = 0.5972; del11 +EV vs. flox8 +EV p = 0.5313; del11 +Xrcc4 vs. flox8 +Xrcc4 p = 0.3007; del11 +Xrcc4 vs. flox8 +EV p = 0.7870. Tus-induced LTGC/Total HR ratio, t-test: flox8 +Xrcc4 vs. flox8 +EV p = 0.9182; del11 +Xrcc4 vs. del11 +EV p = 0.2133; del11 +EV vs. flox8 +EV p = 0.4686; del11 +Xrcc4 vs. flox8 +Xrcc4 p = 0.8360; del11 +Xrcc4 vs. flox8 +EV p = 0.5771. I-SceI-induced Total HR, t-test: flox8 +Xrcc4 vs. flox8 +EV: p = 0.1292; del11 +Xrcc4 vs. del11 +EV p<0.0001; del11 +EV vs. flox8 +EV p<0.0001; del11 +Xrcc4 vs. flox8 +Xrcc4 p = 0.1030; del11 +Xrcc4 vs. flox8 +EV p = 0.8690. I-SceI-induced STGC, t-test: flox8 +Xrcc4 vs. flox8 +EV p = 0.1353; del11 +Xrcc4 vs. del11 +EV p<0.0001; del11 +EV vs. flox8 +EV p<0.0001; del11 +Xrcc4 vs. flox8 +Xrcc4 p = 0.0939; del11 +Xrcc4 vs. flox39 +EV p = 0.0081. I-SceI-induced LTGC, t-test: flox8 +Xrcc4 vs. flox8 +EV p = 0.1840; del11 +Xrcc4 vs. del11 +EV p<0.0001; del13 +EV vs. flox39 +EV p<0.0001; del11 +Xrcc4 vs. flox8 +Xrcc4 p = 0.7589; del11 +Xrcc4 vs. flox39 +EV p = 0.1347. I-SceI-induced LTGC/Total HR ratio, t-test: flox8 +Xrcc4 vs. flox8 +EV p = 0.5908; del11 +Xrcc4 vs. del11 +EV p = 0.0001; del11 +EV vs. flox8 +EV p = 0.0001; del11 +Xrcc4 vs. flox8 +Xrcc4 p = 0.3729; del11 +Xrcc4 vs. flox39 +EV p = 0.4615.
Fig 3
Fig 3. Loss of Xrcc4 does not perturb HR regulation of Tus/Ter-induced STGC and LTGC.
A, Frequencies of Tus/Ter-induced repair Xrcc4Δ/Δ clone 11 6xTer-HR reporter clones stably transduced with pHIV-EV (lentiviral empty vector control) or with pHIV-mXrcc4 (HA-tagged mouse Xrcc4 lentiviral expression vector) with selection of transduced cells in 100 μg/mL NTC. Cells were transiently co-transfected with empty or 3xMyc-NLS Tus expression vectors and siRNAs as shown. Each plot represents the mean of duplicate samples from eight independent experiments (n = 8). Error bars: s.e.m. Xrcc4Δ/Δ clone #11 pHIV-EV: Tus-induced Total HR, t test: siLUC vs. siBRCA1 p = 0.0005; siLUC vs. siBRCA2 p<0.0001; siLUC vs. siRAD51 p<0.0001; siCtIP vs. siLUC p<0.0001; siSLX4 vs. siLUC p<0.0001. Tus-induced STGC, t test: siLUC vs. siBRCA1 p<0.0001; siLUC vs. siBRCA2 p<0.0001; siLUC vs. siRAD51 p<0.0001; siCtIP vs. siLUC p<0.0001; siSLX4 vs. siLUC p<0.0001. Tus-induced LTGC, t test: siLUC vs. siBRCA1 p = 0.0153; siLUC vs. siBRCA2 p = 0.1481; siLUC vs. siRAD51 p = 0.0034; siCtIP vs. siLUC p = 0.2292; siSLX4 vs. siLUC p = 0.0018. Tus-induced Ratio, t test: siLUC vs. siBRCA1 p = 0.0001; siLUC vs. siBRCA2 p = 0.0003; siLUC vs. siRAD51 p<0.0001; siCtIP vs. siLUC p<0.0001; siSLX4 vs. siLUC p<0.0001. Xrcc4Δ/Δ clone #11 pHIV-mXrcc4: Tus-induced Total HR, t test: siLUC vs. siBRCA1 p = 0.0002; siLUC vs. siBRCA2 p<0.0001; siLUC vs. siRAD51 p<0.0001; siCtIP vs. siLUC p<0.0001; siSLX4 vs. siLUC p<0.0001. Tus-induced STGC, t test: siLUC vs. siBRCA1 p<0.0001;siLUC vs. siBRCA2 p<0.0001; siLUC vs. siRAD51 p<0.0001; siCtIP vs. siLUC p<0.0001; siSLX4 vs. siLUC p<0.0001. Tus-induced LTGC, t test: siLUC vs. siBRCA1 p = 0.0023; siLUC vs. siBRCA2 p = 0.0240; siLUC vs. siRAD51 p = 0.0002; siCtIP vs. siLUC p = 0.7398; siSLX4 vs. siLUC p = 0.0022. Tus-induced Ratio, t test: siLUC vs. siBRCA1 p = 0.0004; siLUC vs. siBRCA2 p<0.0001; siLUC vs. siRAD51 p<0.0001; siCtIP vs. siLUC p = 0.0049; siSLX4 vs. siLUC p = 0.0051. B, Frequencies of I-SceI-induced repair Xrcc4Δ/Δ clone 11 6xTer-HR reporter clones stably transduced with pHIV-EV (lentiviral empty vector control, “EV”) or with pHIV-mXrcc4 (HA-tagged mouse Xrcc4 lentiviral expression vector, “X4”) with selection of transduced cells in 100 μg/ml NTC. Cells were co-transiently transfected with empty, or 3xMyc-NLS I-SceI expression vectors and siRNAs as shown. Each plot represents the mean of duplicate samples from eight independent experiments (n = 8). Error bars: s.e.m. Xrcc4Δ/Δ clone #11 pHIV-EV: I-SceI-induced total HR, t test: siLUC vs. siBRCA1 p<0.0001; siLUC vs. siBRCA2 p<0.0001; siLUC vs. siRAD51 p<0.0001; siCtIP vs. siLUC p<0.0001; siSLX4 vs. siLUC p<0.0001. I-SceI-induced STGC, t test: siLUC vs. siBRCA1 p<0.0001; siLUC vs. siBRCA2 p<0.0001; siLUC vs. siRAD51 p<0.0001 siCtIP vs. siLUC p<0.0001; siSLX4 vs. siLUC p<0.0001. I-SceI-induced LTGC, t test: siLUC vs. siBRCA1 p = 0.3335; siLUC vs. siBRCA2 p<0.0001; siLUC vs. siRAD51 p<0.0001; siCtIP vs. siLUC p<0.0001; siSLX4 vs. siLUC p = 0.0006. I-SceI-induced Ratio, t test: siLUC vs. siBRCA1 p = 0.0001; siLUC vs. siBRCA2 p = 0.0020; siLUC vs. siRAD51 p<0.0001; siCtIP vs. siLUC p<0.0001; siSLX4 vs. siLUC p = 0.6260. Xrcc4Δ/Δ clone 11 pHIV-mXrcc4: I-SceI-induced total HR, t test: siLUC vs. siBRCA1 p<0.0001; siLUC vs. siBRCA2 p<0.0001; siLUC vs. siRAD51 p<0.0001; siCtIP vs. siLUC p<0.0001; siSLX4 vs. siLUC p<0.0001. I-SceI-induced STGC, t test: siLUC vs. siBRCA1 p<0.0001; siLUC vs. siBRCA2 p<0.0001; siLUC vs. siRAD51 p<0.0001; siCtIP vs. siLUC p<0.0001; siSLX4 vs. siLUC p<0.0001. I-SceI-induced LTGC, t test: siLUC vs. siBRCA1 p = 0.0001; siLUC vs. siBRCA2 p = 0.0002; siLUC vs. siRAD51 p<0.0001; siCtIP vs. siLUC p = 0.0590; siSLX4 vs. siLUC p = 0.0001. I-SceI-induced Ratio, t test: siLUC vs. siBRCA1 p = 0.0011; siLUC vs. siBRCA2 p = 0.0330; siLUC vs. siRAD51 p = 0.0491; siCtIP vs. siLUC p = 0.0017; siSLX4 vs. siLUC p = 0.0136. C, RT qPCR analysis of BRCA1, BRCA2, CtIP and SLX4 mRNA in siRNA-treated Xrcc4Δ/Δ cells stably transduced with pHIV-EV (“EV”) or pHIV-mXrcc4 (“X4”) derived lentivirus. Data normalized to GAPDH and expressed as fold difference from siLUC sample from the same experiment (x = -2ΔΔCt, with ΔΔCt = [Ct target-CtGapdh]-[CtsiLUC-CtsiGAPDH]). Error-bars represent standard deviation of the ΔCt value (SDEV = √[SDEVTARGET2 + SDEVGAPDH2]). D, Western blot of RAD51 protein abundance in siRNA-treated stably transduced Xrcc4Δ/Δ cells; pHIV-empty vector control (“EV”) or pHIV-mXrcc4 (“X4”). E, Western blot of Brca1 protein abundance in siRNA-treated stably transduced Xrcc4Δ/Δ cells; pHIV-empty vector control (“EV”) or pHIV-mXrcc4 (“X4”).
Fig 4
Fig 4. Impact of DNA polymerase θ depletion on Tus/Ter- and I-SceI-induced HR.
A, Frequencies of Tus/Ter-induced repair in Xrcc4fl/fl clone 8, Xrcc4Δ/Δ clone 11, or Xrcc4Δ/Δ clone 11 stably transduced with pHIV-EV (lentiviral empty vector control) or with pHIV-mXrcc4 (HA-tagged mouse Xrcc4 lentiviral expression vector). Cells transiently co-transfected with empty or 3xMyc-NLS Tus expression vectors and siRNAs shown. Each plot represents the mean of duplicate samples from four (Xrcc4fl/fl clone 8, Xrcc4Δ/Δ clone 11) or five (Xrcc4Δ/Δ clone 11 stably transduced cultures) independent experiments (n = 4,5). Error bars: s.e.m. Tus-induced Total HR, siLUC vs. siPOLQ, t test: Xrcc4fl/fl #8, p = 0.1534; Xrcc4Δ/Δ #11, p = 0.0613; Xrcc4Δ/Δ pHIV-EV, p = 0.0578; Xrcc4Δ/Δ pHIV-mXrcc4, p = 0.0942. Total HR, siLUC, t test: Xrcc4fl/fl #8 vs. Xrcc4Δ/Δ #11, p = 0.6352; Xrcc4Δ/Δ pHIV-EV, vs. pHIV-mXrcc4, p = 0.9841. Total HR, siPOLQ, t test: Xrcc4fl/fl #8 vs. Xrcc4Δ/Δ #11, p = 0.4778; Xrcc4Δ/Δ pHIV-EV, vs. pHIV-mXrcc4, p = 0.7291. Tus-induced STGC, siLUC vs. siPOLQ, t test: Xrcc4fl/fl #8, p = 0.1437; Xrcc4Δ/Δ #11, p = 0.0510; Xrcc4Δ/Δ pHIV-EV, p = 0.0543; Xrcc4Δ/Δ pHIV-mXrcc4, p = 0.0864. STGC, siLUC, t test: Xrcc4fl/fl #8 vs. Xrcc4Δ/Δ #11, p = 0.6116; Xrcc4Δ/Δ pHIV-EV, vs. pHIV-mXrcc4, p = 0.9976. STGC, siPOLQ, t test: Xrcc4fl/fl #8 vs. Xrcc4Δ/Δ #11, p = 0.5041; Xrcc4Δ/Δ pHIV-EV, vs. pHIV-mXrcc4, p = 0.7757. Tus-induced LTGC, siLUC vs. siPOLQ, t test: Xrcc4fl/fl #8, p = 0.9647; Xrcc4Δ/Δ #11, p = 0.5780; Xrcc4Δ/Δ pHIV-EV, p = 0.8273; Xrcc4Δ/Δ pHIV-mXrcc4, p = 0.4575. LTGC, siLUC, t test: Xrcc4fl/fl #8 vs. Xrcc4Δ/Δ #11, p = 0.8797; Xrcc4Δ/Δ pHIV-EV, vs. pHIV-mXrcc4, p = 0.6780. LTGC, siPOLQ, t test: Xrcc4fl/fl #8 vs. Xrcc4Δ/Δ #11, p = 0.6918; Xrcc4Δ/Δ pHIV-EV, vs. pHIV-mXrcc4, p = 0.4764. Tus-induced LTGC/(Total HR), siLUC vs. siPOLQ, t test: Xrcc4fl/fl #8, p = 0.1359; Xrcc4Δ/Δ #11, p = 0.2154; Xrcc4Δ/Δ pHIV-EV, p = 0.0315; Xrcc4Δ/Δ pHIV-mXrcc4, p = 0.0043. LTGC/(Total HR), siLUC, t test: Xrcc4fl/fl #8 vs. Xrcc4Δ/Δ #11, p = 0.5835; Xrcc4Δ/Δ pHIV-EV, vs. pHIV-mXrcc4, p = 0.6703. LTGC/(Total HR), siPOLQ, t test: Xrcc4fl/fl #8 vs. Xrcc4Δ/Δ #11, p = 0.8795; Xrcc4Δ/Δ pHIV-EV, vs. pHIV-mXrcc4, p = 0.4704. B, Frequencies of I-SceI-induced repair in Xrcc4fl/fl clone 8, Xrcc4Δ/Δ clone 11, or Xrcc4Δ/Δ clone 11 stably transduced with pHIV-EV (lentiviral empty vector control) or with pHIV-mXrcc4 (HA-tagged mouse Xrcc4 lentiviral expression vector). Cells transiently co-transfected with empty or 3xMyc-NLS I-SceI expression vectors and siRNAs shown. Each plot represents the mean of duplicate samples from four (Xrcc4fl/fl clone 8, Xrcc4Δ/Δ clone 11) or five (Xrcc4Δ/Δ clone 11 stably transduced cultures) independent experiments (n = 4,5). Error bars: s.e.m. I-SceI-induced Total HR, siLUC vs. siPOLQ, t test: Xrcc4fl/fl #8, p = 0.3435; Xrcc4Δ/Δ #11, p = 0.6415; Xrcc4Δ/Δ pHIV-EV, p = 0.5332; Xrcc4Δ/Δ pHIV-mXrcc4, p = 0.6113. Total HR, siLUC, t test: Xrcc4fl/fl #8 vs. Xrcc4Δ/Δ #11, p<0.0001; Xrcc4Δ/Δ pHIV-EV, vs. pHIV-mXrcc4, p = 0.0004. Total HR, siPOLQ, t test: Xrcc4fl/fl #8 vs. Xrcc4Δ/Δ #11, p = 0.0010; Xrcc4Δ/Δ pHIV-EV, vs. pHIV-mXrcc4, p = 0.0178. I-SceI-induced STGC, siLUC vs. siPOLQ, t test: Xrcc4fl/fl #8, p = 0.3438; Xrcc4Δ/Δ #11, p = 0.6464; Xrcc4Δ/Δ pHIV-EV, p = 0.3965; Xrcc4Δ/Δ pHIV-mXrcc4, p = 0.4388. STGC, siLUC, t test: Xrcc4fl/fl #8 vs. Xrcc4Δ/Δ #11, p<0.0001; Xrcc4Δ/Δ pHIV-EV, vs. pHIV-mXrcc4, p<0.0001. STGC, siPOLQ, t test: Xrcc4fl/fl #8 vs. Xrcc4Δ/Δ #11, p = 0.0011; Xrcc4Δ/Δ pHIV-EV, vs. pHIV-mXrcc4, p = 0.0049. I-SceI-induced LTGC, siLUC vs. siPOLQ, t test: Xrcc4fl/fl #8, p = 0.5196; Xrcc4Δ/Δ #11, p = 0.6949; Xrcc4Δ/Δ pHIV-EV, p = 0.4229; Xrcc4Δ/Δ pHIV-mXrcc4, p = 0.9733. LTGC, siLUC, t test: Xrcc4fl/fl #8 vs. Xrcc4Δ/Δ #11, p = 0.0100; Xrcc4Δ/Δ pHIV-EV, vs. pHIV-mXrcc4, p = 0.0007. LTGC, siPOLQ, t test: Xrcc4fl/fl #8 vs. Xrcc4Δ/Δ #11, p = 0.0028; Xrcc4Δ/Δ pHIV-EV, vs. pHIV-mXrcc4, p = 0.0030. I-SceI-induced LTGC/(Total HR), siLUC vs. siPOLQ, t test: Xrcc4fl/fl #8, p = 0.3449; Xrcc4Δ/Δ #11, p = 0.9371; Xrcc4Δ/Δ pHIV-EV, p = 0.6062; Xrcc4Δ/Δ pHIV-mXrcc4, p = 0.3769. LTGC/(Total HR), siLUC, t test: Xrcc4fl/fl #8 vs. Xrcc4Δ/Δ #11, p = 0.0090; Xrcc4Δ/Δ pHIV-EV, vs. pHIV-mXrcc4, p = 0.0187. LTGC/(Total HR), siPOLQ, t test: Xrcc4fl/fl #8 vs. Xrcc4Δ/Δ #11, p = 0.0181; Xrcc4Δ/Δ pHIV-EV, vs. pHIV-mXrcc4, p = 0.0036. C, RT qPCR analysis of POLQ mRNA in siRNA-treated reporter cells. Data normalized to GAPDH and expressed as fold difference from siLUC sample from the same experiment (x = -2ΔΔCt, with ΔΔCt = [CtPolq-CtGapdh]-[CtsiLUC-CtsiGAPDH]). Error-bars represent standard deviation of the ΔCt value (SDEV = √[SDEVTARGET2 + SDEVGAPDH2]).
Fig 5
Fig 5. Impact of Ku70 deletion on Tus/Ter-induced HR.
A, Ku70 mutant cell genotyping and gene structure in Ku70–/–ES cells. Ku70 null allele lacks Exon 4 and partially Exon 5. Grey boxes: Ku70 Exons 3–6. Location and direction of Exons 4 and 5 and neoR genotyping primers a, a’, and b as indicated by arrows. Sa: SacI restriction site. Sc: ScaI restriction site. Gel: PCR products for single wild type control and nine Ku70–/–ES 6xTer-HR reporter clones (27, 34, 35, 38, 41, 45, 47, 54, and 92). B, Frequencies of Tus/Ter-induced and I-SceI-induced repair in nine independently derived Ku70–/– 6xTer-HR reporter clones (27, 34, 35, 38, 41, 45, 47, 54, and 92) transiently transfected with empty, 3xMyc-NLS Tus or 3xMyc-NLS I-SceI expression vectors. Each dot plot represents the mean of duplicate samples from six independent experiments (n = 6), values are corrected for transfection efficiency. Error bars: s.e.m. One-way ANOVA (Analysis of Variance) test comparing trend in HR between nine Ku70–/–clones: Tus-induced HR, total HR, p = 0.0205; STGC, p = 0.0173; LTGC, p = 0.1698; LTGC/(Total HR), p = 0.0261. I-SceI-induced HR, total HR, p = 0.0005; STGC, p = 0.0004; LTGC, p = 0.927; LTGC/(Total HR), p = 0.0081.
Fig 6
Fig 6. Transient KU70 expression does not affect Tus/Ter-induced HR in Ku70–/–cells.
A, Frequencies of Tus/Ter-induced and I-SceI-induced repair in four independently derived Ku70–/– 6xTer-HR reporter clones (clones 27, 34, 41, and 47) with and without transient expression of exogenous hKU70. Cells transiently co-transfected with empty pcDNA3beta or pcDNA3beta-hKU70 expression vector and either empty, 3xMyc-NLS Tus or 3xMyc-NLS I-SceI expression vectors. Each column represents the mean of duplicate samples from eight independent experiments (n = 8), values are corrected for transfection efficiency. Error bars: s.e.m. Tus-induced total HR, t test: #27 +EV vs. +hKU70, p = 0.8355; #34 +EV vs. +hKU70, p = 0.3799; #41 +EV vs. +hKU70, p = 0.2710; #47 +EV vs. +hKU70, p = 0.4703; Tus-induced STGC, t test: #27 +EV vs. +hKU70, p = 0.7892; #34 +EV vs. +hKU70, p = 0.4223; #41 +EV vs. +hKU70, p = 0.2345; #47 +EV vs. +hKU70, p = 0.4426; Tus-induced LTGC, t test: #27 +EV vs. +hKU70, p = 0.4375; #34 +EV vs. +hKU70, p = 0.2413; #41 +EV vs. +hKU70, p = 0.8608; #47 +EV vs. +hKU70, p = 0.9872; Tus-induced LTGC/(Total HR), t test: #27 +EV vs. +hKU70, p = 0.2701; #34 +EV vs. +hKU70, p = 0.4964; #41 +EV vs. +hKU70, p = 0.2507; #47 +EV vs. +hKU70, p = 0.8222. I-SceI-induced total HR, t test: #27 +EV vs. +hKU70, p<0.0001; #34 +EV vs. +hKU70, p<0.0001; #41 +EV vs. +hKU70, p<0.0001; #47 +EV vs. +hKU70, p<0.0001; I-SceI-induced STGC, t test: #27 +EV vs. +hKU70, p<0.0001; #34 +EV vs. +hKU70, p<0.0001; #41 +EV vs. +hKU70, p<0.0001; #47 +EV vs. +hKU70, p<0.0001; I-SceI-induced LTGC, t test: #27 +EV vs. +hKU70, p = 0.0002; #34 +EV vs. +hKU70, p<0.0001; #41 +EV vs. +hKU70, p<0.0001; #47 +EV vs. +hKU70, p<0.0001; I-SceI-induced LTGC/(Total HR), t test: #27 +EV vs. +hKU70, p = 0.0004; #34 +EV vs. +hKU70, p<0.0001; #41 +EV vs. +hKU70, p<0.0001; #47 +EV vs. +hKU70, p = 0.0003. One-way ANOVA (Analysis of Variance) test comparing trend in HR: Tus-induced HR, total HR, p = 0.2388; STGC, p = 0.1923; LTGC, p = 0.9660; LTGC/(Total HR), p = 0.5923. I-SceI-induced HR, total HR, p<0.0001; STGC, p<0.0001; LTGC, p<0.0001; LTGC/(Total HR), p<0.0001. B, RT qPCR analysis of hKU70 in transfected Ku70–/–clones. hKU70 expression normalized to GAPDH and displayed as fold difference from Ku70–/–reporter clone 27 of the same experiment (x = -2ΔΔCt, with ΔΔCt = [CtKU70-CtGAPDH]-[CtKU70-CtGAPDH]). Error-bars represent standard deviation of the ΔCt value (SDEV = √[SDEVKU702 + SDEVGAPDH2]). C, Western blot for abundance of hKU70 protein in Ku70–/–reporter clones transiently transfected with empty pcDNA3beta or pcDNA3beta-hKU70. D, Fold enrichment of cultures transiently expressing exogenous GFP. Results represent fold enrichment of cultures transiently co-transfected with GFP-expression plasmid and either pcDNA3beta or pcDNA3beta-hKU70 expression vector over co-cultured cells transiently transfected with pcDNA3beta alone. Each plot represents the mean of triplicate samples from three independent experiments (n = 3), fold enrichment GFP+ cells normalized to 0 μg/mL phleomycin control. Error bars: s.e.m.
Fig 7
Fig 7. Impact of CtIP depletion on repair frequencies in the presence or absence of hKU70.
A, Frequencies of Tus/Ter-induced repair in three independently derived Ku70–/– 6xTer-HR reporter clones (clones 27, 41, and 47) transiently expressing exogenous hKU70 and transfected with siRNAs shown. Cells transiently co-transfected with empty pcDNA3beta or pcDNA3beta-hKU70 expression vector and empty or 3xMyc-NLS Tus expression vectors treated with either siLUC or siCtIP. Each column represents the mean of duplicate samples from eight independent experiments (n = 8), values are corrected for transfection efficiency. Error bars: s.e.m. Tus-induced total HR, siLUC vs. siCtIP t test: #27 +EV, p = 0.0030; #41 +EV, p = 0.0207; #47 +EV, p = 0.0070; #27 +hKU70, p = 0.0047; #41 + hKU70, p = 0.0281; #47 + hKU70, p = 0.0148; Tus-induced STGC, t test: #27 +EV, p = 0.0011; #41 +EV, p = 0.0104; #47 +EV, p = 0.0070; #27 +hKU70, p = 0.0030; #41 + hKU70, p = 0.0207; #47 + hKU70, p = 0.0148; Tus-induced LTGC, t test: #27 +EV, p = 0.2786; #41 +EV, p = 0.5737; #47 +EV, p = 0.1304; #27 +hKU70, p = 0.8785; #41 + hKU70, p = 0.5737; #47 + hKU70, p = 0.5737; Tus-induced LTGC/(Total HR), t test: #27 +EV, p = 0.0002; #41 +EV, p = 0.0006; #47 +EV, p = 0.0006; #27 +hKU70, p = 0.0019; #41 + hKU70, p = 0.0030; #47 + hKU70, p = 0.0650; One-way ANOVA (Analysis of Variance) test comparing trend in Tus-induced Total HR: siLUC vs siCtIP all, p<0.0001; siLUC vs siCtIP +EV, p<0.0001; siLUC vs siCtIP +hKU70, p = 0.0002; siLUC all, p = 0.8904; siCtIP all, p = 0.1322. Tus-induced STGC, one-way ANOVA test: siLUC vs siCtIP all, p<0.0001; siLUC vs siCtIP +EV, p<0.0001; siLUC vs siCtIP +hKU70, p<0.0001; siLUC all, p = 0.9108; siCtIP all, p = 0.1155. Tus-induced LTGC, one-way ANOVA test: siLUC vs siCtIP all, p = 0.4334; siLUC vs siCtIP +EV, p = 0.3194; siLUC vs siCtIP +hKU70, p = 0.4144; siLUC all, p = 0.6254; siCtIP all, p = 0.2231. Tus-induced LTGC/(Total HR), one-way ANOVA test: siLUC vs siCtIP all, p<0.0001; siLUC vs siCtIP +EV, p = 0.0004; siLUC vs siCtIP +hKU70, p = 0.0012; siLUC all, p = 0.9449; siCtIP all, p = 0.2989. B, Frequencies of I-SceI-induced repair in three independently derived KU70Δ/Δ 6xTer-HR reporter clones. Cells transiently co-transfected with empty pcDNA3beta or pcDNA3beta-hKU70 expression vector and empty or 3xMyc-NLS I-SceI expression vectors treated with either siLUC or siCtIP. Each column represents the mean of duplicate samples from eight independent experiments (n = 8), values are corrected for transfection efficiency. Error bars: s.e.m. I-SceI-induced total HR, siLUC vs. siCtIP t test: #27 +EV, p = 0.0379; #41 +EV, p = 0.0281; #47 +EV, p = 0.0499; #27 +hKU70, p = 0.0003; #41 + hKU70, p = 0.0019; #47 + hKU70, p = 0.0011; I-SceI-induced STGC, siLUC vs. siCtIP t test: #27 +EV, p = 0.0379; #41 +EV, p = 0.0281; #47 +EV, p = 0.0379; #27 +hKU70, p = 0.0002; #41 + hKU70, p = 0.0019; #47 + hKU70, p = 0.0011; I-SceI-induced LTGC, siLUC vs. siCtIP t test: #27 +EV, p = 0.1104; #41 +EV, p = 0.7984; #47 +EV, p = 0.3282; #27 +hKU70, p = 0.3282; #41 + hKU70, p = 0.1949; #47 + hKU70, p = 0.1949; I-SceI-induced LTGC/(Total HR), siLUC vs. siCtIP t test: #27 +EV, p = 0.0011; #41 +EV, p = 0.0379; #47 +EV, p = 0.0070; #27 +hKU70, p = 0.0006; #41 + hKU70, p = 0.0650; #47 + hKU70, p = 0.0070; I-SceI-induced Total HR, one-way ANOVA test: siLUC vs siCtIP all, p<0.0001; siLUC vs siCtIP +EV, p = 0.0139; siLUC vs siCtIP +hKU70, p<0.0001; siLUC all, p<0.0001; siCtIP all, p<0.0001. I-SceI-induced STGC, one-way ANOVA test: siLUC vs siCtIP all, p<0.0001; siLUC vs siCtIP +EV, p = 0.0106; siLUC vs siCtIP +hKU70, p<0.0001; siLUC all, p<0.0001; siCtIP all, p<0.0001. I-SceI-induced LTGC, one-way ANOVA test: siLUC vs siCtIP all, p<0.0001; siLUC vs siCtIP +EV, p = 0.1503; siLUC vs siCtIP +hKU70, p = 0.1010; siLUC all, p = 0.0010; siCtIP all, p<0.0001. I-SceI-induced LTGC/(Total HR), one-way ANOVA test: siLUC vs siCtIP all, p<0.0001; siLUC vs siCtIP +EV, p<0.0001; siLUC vs siCtIP +hKU70, p<0.0001; siLUC all, p = 0.0147; siCtIP all, p<0.0001. C, Observed repair frequencies for Tus or I-SceI induced HR, STGC and LTGC expressed as the ratio of siCtIP frequency/siLUC frequency for data from clones 27, 41 and 47 shown in panels A and B. One-way ANOVA test: Tus-induced total HR, p = 0.0779; Tus-induced STGC, p = 0.0564; Tus-induced LTGC, p = 0.2067. One-way ANOVA test: I-SceI-induced total HR, p<0.0001; I-SceI-induced STGC, p<0.0001; I-SceI-induced LTGC, p = 0.0832. D, RT qPCR analysis of CtIP mRNA in siRNA-transfected Ku70–/–clones. Data normalized to GAPDH and expressed as fold difference from siLUC sample from the same experiment (x = -2ΔΔCt, with ΔΔCt = [CtsiCtIP-CtGapdh]-[CtsiLUC-CtsiGAPDH]). Error-bars represent standard deviation of the ΔCt value (SDEV = √[SDEVCtIP2 + SDEVGAPDH2]).
Fig 8
Fig 8. Distinct patterns of Rad51 recruitment to the Tus/Ter fork barrier and to a conventional DSB.
A, Schematic of the 1xGFP 6xTer reporter. Location of telomere (TEL) and centromere (CEN) shown. Red half-arrow heads: primer pairs. Grey box: mutant GFP allele (6xTer-I-SceI-GFP). Orange triangle: 6xTer element array. Navy blue line: I-SceI endonuclease target site and I-SceI site-specific guide RNA target site. Primer pair positions indicated as distance between the proximal end of the closer primer sequence to proximal edge of the 6xTer array. B and C, Rad51 protein abundance at sites near the 6xTer-I-SceI-GFP allele in response to Tus/Ter-induced replication fork stalling or DSB induction at 24 or 48 hours after transfection. Cells transiently transfected with empty vector (grey), pcDNA3β-myc NLS-Tus-F140A-3xHA (orange), pcDNA3β-myc NLS-I-SceI (royal blue), or co-transfected with spCas9 expression plasmid with control (white) or I-SceI site-specific (navy blue) guide RNA. Fold enrichment of Rad51 protein calculated as the mean 2-ΔΔCT from three independent experiments (n = 3) normalized against untreated controls (empty vector or guide RNA controls) and β-Actin control locus. Error bars indicate the standard deviation of the ΔCT measurement calculated as the change in Ct value obtained from the proximal-Ter locus and that obtained from β-Actin control locus.
Fig 9
Fig 9. Hypothetical models of Tus/Ter-induced HR.
A, Conventional DSB intermediate model. Dual incision of bidirectionally arrested forks generates DNA ends that are processed for HR. Unknown mechanisms prevent Ku access to the DNA ends at the stalled fork. Dark blue: parental strands. Light blue: nascent strands. Half arrows indicate direction of nascent strand synthesis. Orange triangles: Tus/Ter RFB. Green circles: Rad51 monomers. B, Template switch/fork reversal model. Rad51 is loaded onto exposed ssDNA lagging strand daughter strand gaps at the arrested fork. Following replisome disassembly, Rad51 mediates fork remodeling via a template switch mechanism. This process displaces the 3’ ssDNA end of the nascent leading strand, which is rapidly coated with RPA (not shown) followed by Rad51. The DNA end thus generated is incapable of binding Ku, excluding engagement of C-NHEJ. Further processing of the reversed fork may liberate the DNA end by more extensive fork reversal (not shown) and/or via incision of the 4-way reversed fork structure (red arrowhead). Although processing of the two opposing forks is depicted here as sequential, this model is also compatible with synchronous remodeling of both forks. Symbols as in panel A. Pale green circles, Rad51 monomers displaced from lagging strand.

References

    1. Zeman MK, Cimprich KA. Causes and consequences of replication stress. Nat Cell Biol. 2014;16(1):2–9. 10.1038/ncb2897 . - DOI - PMC - PubMed
    1. Duxin JP, Walter JC. What is the DNA repair defect underlying Fanconi anemia? Current opinion in cell biology. 2015;37:49–60. 10.1016/j.ceb.2015.09.002 . - DOI - PMC - PubMed
    1. D'Andrea AD. Susceptibility pathways in Fanconi's anemia and breast cancer. The New England journal of medicine. 2010;362(20):1909–19. 10.1056/NEJMra0809889 . - DOI - PMC - PubMed
    1. Garcia-Muse T, Aguilera A. Transcription-replication conflicts: how they occur and how they are resolved. Nat Rev Mol Cell Biol. 2016. 10.1038/nrm.2016.88 . - DOI - PubMed
    1. Ciccia A, Elledge SJ. The DNA damage response: making it safe to play with knives. Mol Cell. 2010;40(2):179–204. Epub 2010/10/23. S1097-2765(10)00747-1 [pii] 10.1016/j.molcel.2010.09.019 ; PubMed Central PMCID: PMC2988877. - DOI - PMC - PubMed

Publication types