. 2018 Jul 19;13(7):e0201075.
doi: 10.1371/journal.pone.0201075. eCollection 2018.

Mosquito control practices and perceptions: An analysis of economic stakeholders during the Zika epidemic in Belize, Central America

Affiliations

Mosquito control practices and perceptions: An analysis of economic stakeholders during the Zika epidemic in Belize, Central America

Molly Duman-Scheel et al. PLoS One. .

Abstract

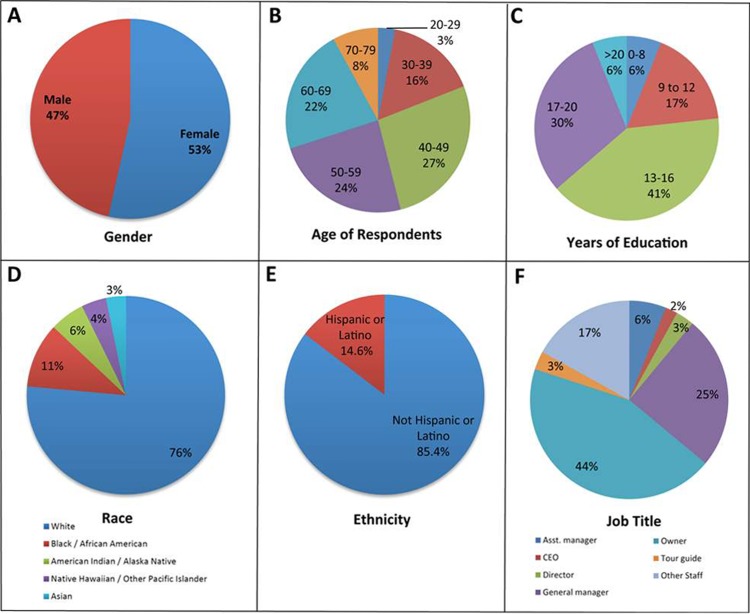
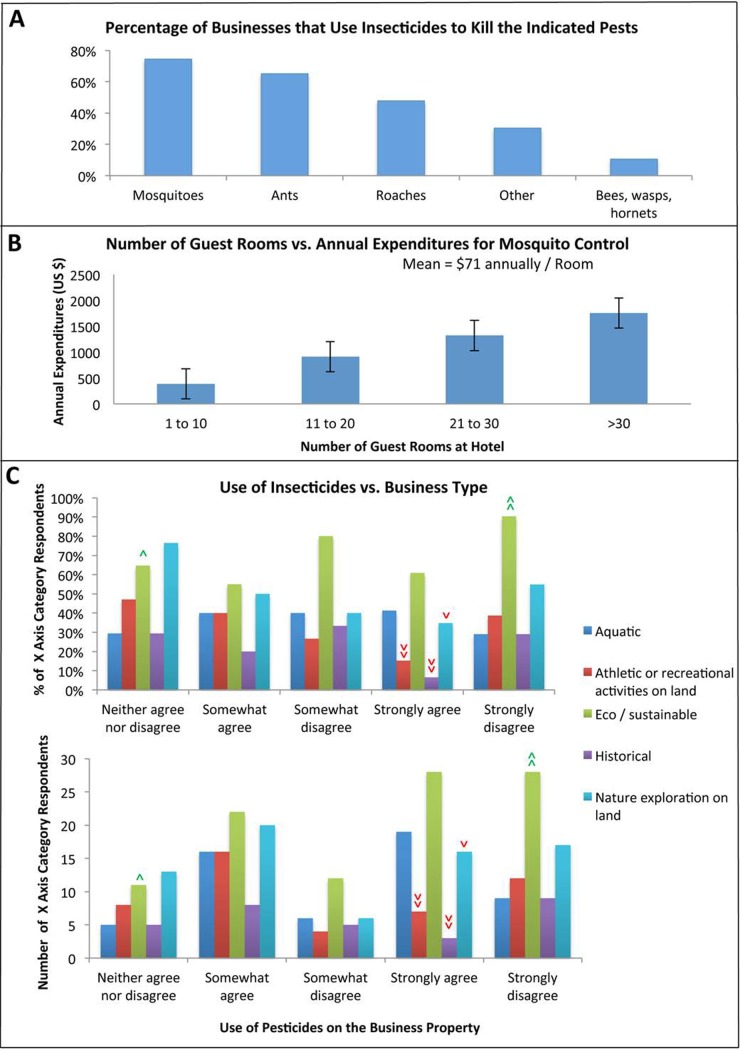
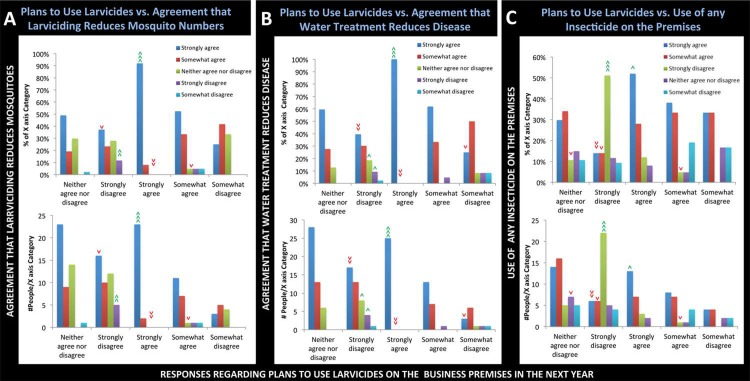
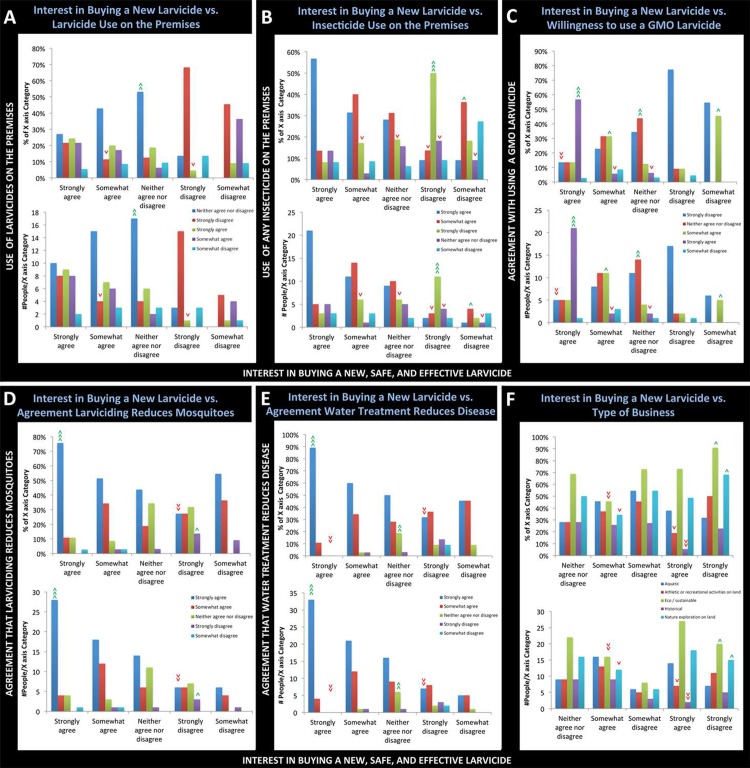
The tourist-based economy of Belize, a tropical hub for eco-tourism, is at high risk to be disproportionately impacted by established and emerging mosquito-borne diseases such as Zika. An online survey was used to probe economic stakeholders working in the Belize tourism industry about their mosquito control practices and perceptions. Responses demonstrated that the respondents have good working knowledge of mosquitoes and mosquito-borne illnesses. Most businesses surveyed engage in some means of mosquito control, either through larval source reduction or use of insecticides on the premises. Larvicide use was significantly correlated with a general willingness to use insecticides, as well as belief that treatment of water will reduce mosquito densities and disease transmission. A majority of the respondents agreed that they would be interested in buying a new larvicide to be used on the business premises if it were shown to be safe and effective. The safety of mosquito control products for humans, animals, plants, and the environment in general, followed by product effectiveness, are the most critical determinants of mosquito control purchasing decisions. A majority of respondents agreed that control of mosquitoes and mosquito-borne illnesses is central to the success of their tourist-based industry. Respondents expressed significant concern that the Zika epidemic was over-sensationalized by the media, and that this negatively impacted their livelihoods. The respondents, many of whom are associated with eco/sustainable businesses, also voiced concerns that chemical pesticides could have a negative impact on human health and the environment and expressed a desire for balance between effective mosquito control and preservation of the rich biodiversity of Belize. This study provided a framework for further engagement activities in Belize and other Caribbean nations, uncovered both concerns and support for emerging mosquito control technologies, and revealed opportunities for further debate and educational outreach efforts.


Conflict of interest statement

Drs. Duman-Scheel and Eggleson were named as inventors on a pending patent application entitled “RNAi Insecticide Materials and Methods” (International Patent Application No.: 62/361,704). This does not alter our adherence to PLOS ONE policies on sharing data and materials.

Figures

Fig 1
Fig 1. Summary of business demographic data.
Summaries of respondent-supplied information regarding the businesses that they owned or in which they were employed are shown: A) Type of business, B) Proportion of business that is tourist-based, C) Description of business, D) Star rating, E) Number of guest rooms, F) Number of guest rooms vs. total annual U.S. dollars spent by the establishment for mosquito control. Percentages in A-E correspond to the percentage of the total respondents that provided the indicated answer (respondent count numbers are provided in Table 1).
Fig 2
Fig 2. Demographics of the survey respondents.
Self-reported demographic data provided by the respondents is shown: A) Gender, B) Age in years, C) Years of formal education, D) Race, E) Ethnicity (note that race and ethnicity categories correspond to those of the U.S. census), and F) Job title. Percentages in A-F correspond to the percentage of the total respondents that provided the indicated answer (respondent count numbers are provided in Table 2).
Fig 3
Fig 3. Responses to mosquito knowledge and mosquito control questions.
The respondents were queried regarding their general knowledge of mosquitoes and typical mosquito control practices on their properties. Likert-scale responses concerning their agreement with the following are included: A) Mosquitoes transmit disease-causing viruses; B) Treating water where mosquitoes breed reduces disease transmission; C) Removal of standing water on the premises; D) Frequency of water removal; E) Use of insecticides on the premises. Percentages in A-E correspond to the percentage of the total respondents that provided the indicated answer (respondent count numbers are provided in Table 3).
Fig 4
Fig 4. Purchase and use of insecticides.
A) The percentage of insecticide-using businesses that use insecticides to kill the indicated pests. Count numbers are reported in Table 4. B) Survey-taker reported data on annual expenditures for mosquito control (converted to U.S. dollars) plotted as a function of the number of guest rooms available for rent. Annual expenditures increase as the number of rooms increases (p<0.00001). Mean = $71 spent on mosquito control per room annually. C) Likert-scale responses from representatives of the indicated types of businesses regarding the use of insecticides on their properties. The percentages (graph at top) and numbers (lower graph) of the X-axis category respondents providing the answers indicated are shown. >>> = very highly significant, >> = very significant, > = significant, with green corresponding to a higher than expected percentage/number of respondents for a given X-axis category and red corresponding to a lower than expected percentage/number of respondents for a given X-axis category. See text for additional details regarding statistical analyses and a discussion of significant results.
Fig 5
Fig 5. Assessment of respondents’ willingness to use larvicides on the premises.
Likert-scale responses to the question of whether the business plans to use larvicides on the premises in the next year (X-axes) vs. A) Agreement that larvicide use will reduce the number of mosquitoes, B) Agreement that treatment of water where mosquitoes breed will reduce disease, and C) Respondents’ willingness to use any insecticide on the premises (Y-axes). The percentages (upper graph in each panel) and numbers (lower graphs) of the X-axis category respondents providing the answers indicated are shown. >>> = very highly significant, >> = very significant, > = significant, with green signifying a higher than expected percentage/number for a given X-axis category and red denoting a lower than expected percentage/number of respondents for a given X-axis category. See text for additional details regarding statistical analyses and discussion of significant results.
Fig 6
Fig 6. Analysis of respondents willing or not willing to purchase a new larvicide for use on the premises.
Likert-scale responses to the question of whether the business is interested in purchasing a new larvicide for use on the premises (X-axes) vs. A) Willingness to use larvicides on the premises, B) Willingness to use any insecticides on the premises, C) Willingness to use a GMO-larvicide if it is shown to be safe and effective, D) Agreement that larvicide use will reduce the number of mosquitoes, E) Agreement that treatment of water where mosquitoes breed will reduce disease, and F) Respondent-provided description of the type of business. The percentages (upper graph in each panel) and numbers (lower graphs) of the X-axis category respondents providing the indicated answers are shown. >>> = very highly significant, >> = very significant, > = significant, with green representing a higher than expected percentage/number for a given X-axis category and red representing a lower than expected percentage/number of respondents for the indicated X-axis category. Additional details regarding the statistical analyses and further discussion of significant results are provided in the text.

References

    1. PAHO. Dengue fever in the Americas 2017. Available from: http://www.paho.org/data/index.php/en/mnu-topics/indicadores-dengue-en/d....
    1. CDC. Dengue 2018. Available from: https://www.cdc.gov/dengue/.
    1. CDC. Zika virus 2018. Available from: https://www.cdc.gov/zika/about/index.html.
    1. WHO. Zika virus 2018. Available from: http://www.who.int/mediacentre/factsheets/zika/en/.
    1. PAHO. Zika-epidemiological report 2017. Available from: http://www.paho.org/hq/index.php?option = com_docman&task = doc_view&gid = 35105&Itemid = 270&lang = en.

Publication types

MeSH terms