. 2018 Jun 1;59(7):2987-2998.
doi: 10.1167/iovs.17-23474.

Spatial Patterns and Age-Related Changes of the Collagen Crimp in the Human Cornea and Sclera

Affiliations

Spatial Patterns and Age-Related Changes of the Collagen Crimp in the Human Cornea and Sclera

Alexandra Gogola et al. Invest Ophthalmol Vis Sci. .

Abstract

Purpose: Collagen is the main load-bearing component of the eye, and collagen crimp is a critical determinant of tissue mechanical behavior. We test the hypothesis that collagen crimp morphology varies over the human cornea and sclera and with age.

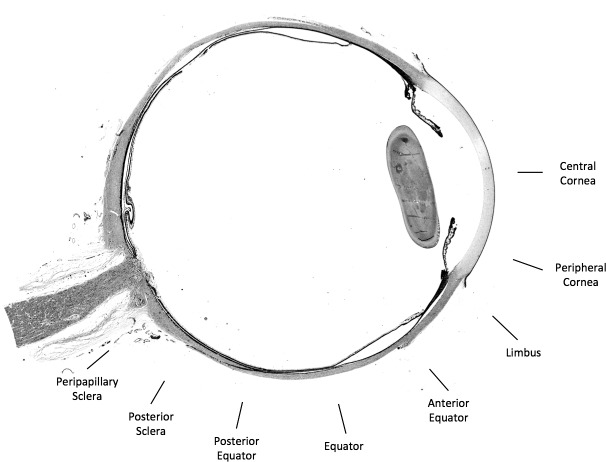
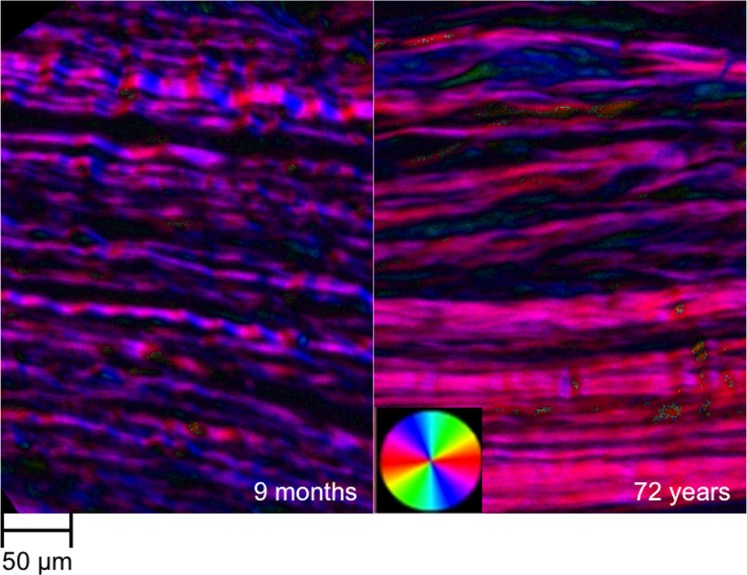
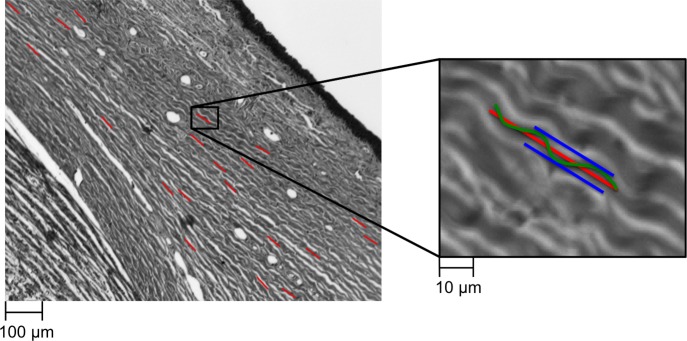
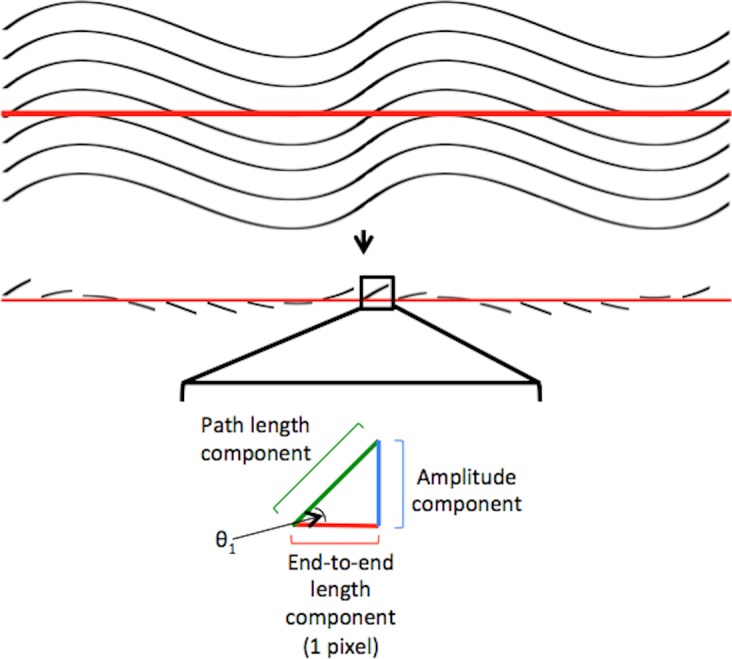
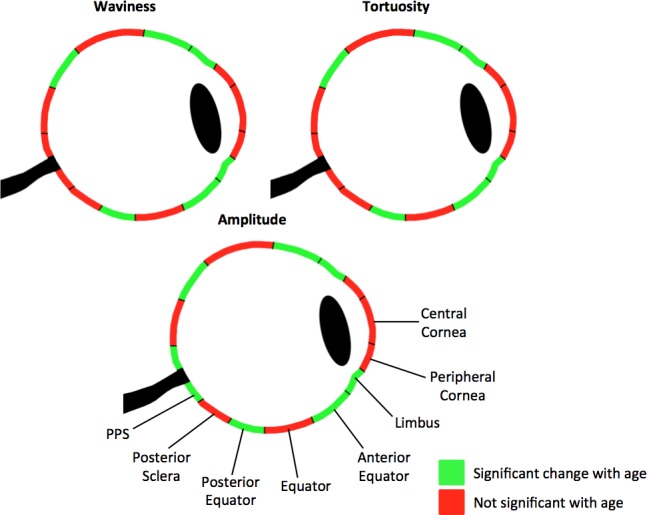
Methods: We analyzed 42 axial whole-globe sections from 20 normal eyes of 20 human donors, ranging in age from 0.08 (1 month) to 97 years. The sections were imaged using polarized light microscopy to obtain μm-scale fiber bundle/lamellae orientation from two corneal and six scleral regions. Crimp morphology was quantified through waviness, tortuosity, and amplitude.

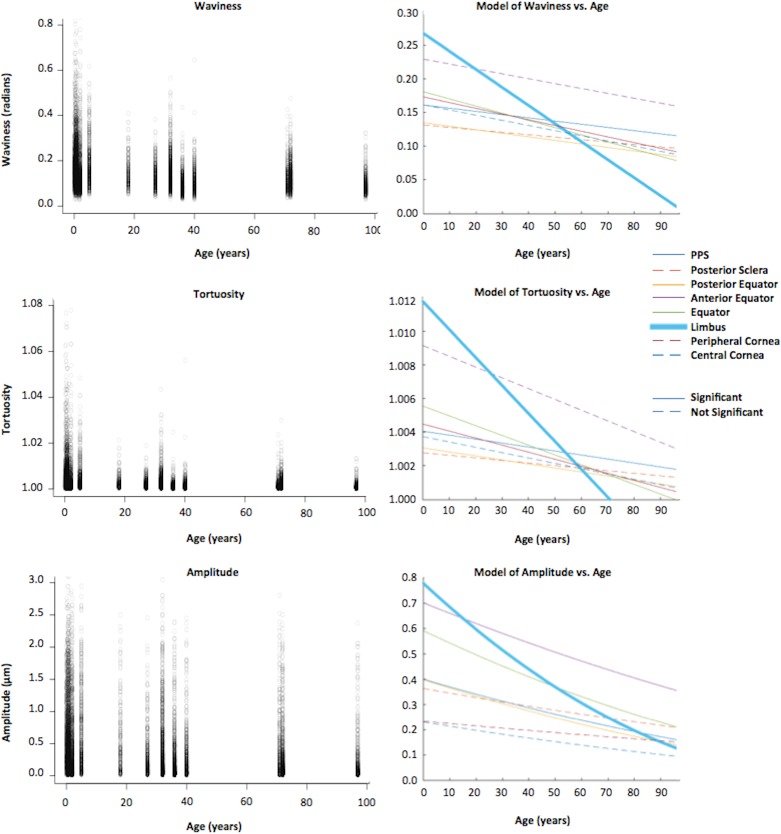
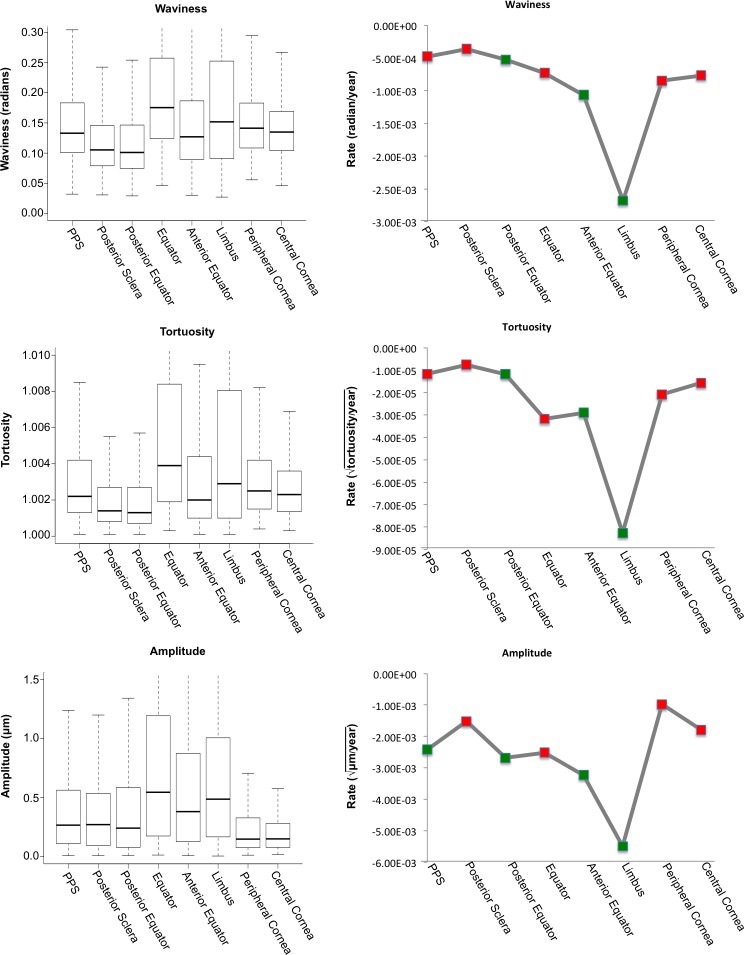
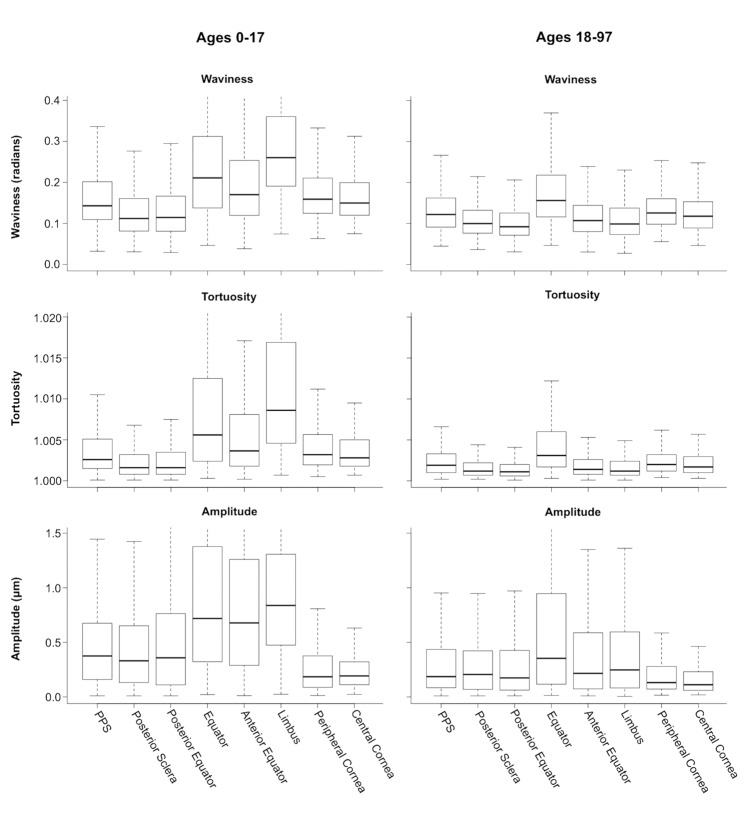
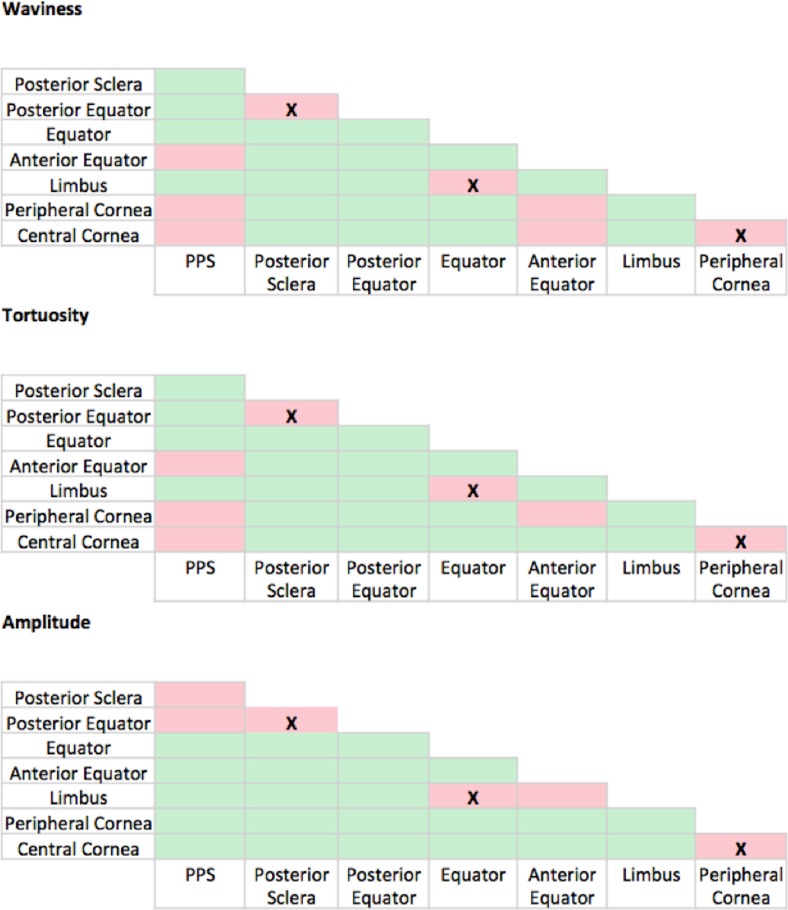
Results: Whole-globe median waviness, tortuosity, and amplitude were 0.127 radians, 1.002, and 0.273 μm, respectively. These parameters, however, were not uniform over the globe, instead exhibiting distinct, consistent patterns. All crimp parameters decreased significantly with age, with significantly different age-related decreases between regions. The crimp morphology of the limbus changed the most drastically with age, such that it had the largest crimp in neonates, and among the smallest in the elderly.

Conclusions: Age-related decreases in crimp parameters are likely one of the mechanisms underlying age-related stiffening of the sclera and cornea, potentially influencing sensitivity to IOP. Further work is needed to determine the biomechanical implications of the crimp patterns observed. The comparatively large changes in the crimp morphology of the limbus, especially in the early years of life, suggest that crimp in this region may play a role in eye development, although the exact nature of this is unclear.


Figures

Figure 1
Figure 1
Map of eight regions sampled on a whole-globe brightfield image of a section of the eye. We pooled measurements from the 16 corresponding nasal and temporal regions into the eight full regions used for analysis.
Figure 2
Figure 2
Example orientation maps of the limbus from a young (9 months) and an old (72 years) subject. The fiber orientations at each pixel were determined using the four PLM images collected for each sample. The orientation maps were then visualized by color-coding the fiber orientations. The brightness was scaled according to the signal strength at a pixel. The orientation map of the young limbus shows undulations in color along the fibers, showing that the fibers are crimped. The orientation map of the older limbus does not show much variation in orientation, suggesting a reduction of crimp with age.
Figure 3
Figure 3
Line markings were used to quantify collagen fiber crimp tortuosity, waviness, and amplitude. A few example line markings used for measuring these crimp parameters are shown on the left panel (red lines) overlaid on a brightfield image. To the right is a close up of a marked collagen bundle. Tortuosity was computed as the ratio of fiber path length (green wavy line) over the end-to-end length (red line); waviness was computed as the circular SD of the fiber orientation along the end-to-end path; amplitude was defined as half the distance from peak to trough within a wave (blue lines).
Figure 4
Figure 4
Crimp parameter calculation. Computation of the collagen's waviness, tortuosity, and amplitude was based on the fiber orientation value at each pixel along the straight-line segment. Waviness was computed as the circular SD of the pixels' orientation values (θ1). Tortuosity was computed as the ratio of the sum of the pixels' path length components to the sum of the end-to-end length components. Amplitude was computed as the sum of the pixels' amplitude components, averaging total contributions in positive or negative directions.
Figure 5
Figure 5
Parameters versus age. The left column shows scatter plots of crimp parameters with age, pooled across all regions in the eye. Ages ranged from 0.08 (1 month) to 97 years, with a slight concentration of samples below 2 years old. At all ages, the variability was larger for amplitude than for waviness and tortuosity. All three parameters had a significant monotonic decrease with age in all regions of the globe pooled (P < 0.01). The right column shows models of waviness, tortuosity, and amplitude with age. Although all crimp parameters measured decreased with age in every region, the rate of decrease varied from region to region (colored lines). Model refers to LME model. The limbus region showed the largest rate decrease with age in all three parameters (bolded blue line). For every region, different transformations were tested to determine the best-fit model. We found that of the transforms tested (linear, logarithmic, and square-root of the crimp parameter), the decrease in waviness with age was linear, whereas the decrease in tortuosity and amplitude with age was best described using the square-root transformation of the crimp parameter.
Figure 6
Figure 6
Regional trends. The left column shows box plots of waviness, tortuosity, and amplitude grouped by region, from the most posterior region (PPS) to the most anterior region (central cornea) in the eye. The equator and limbus show the largest variability for each parameter. The right column shows the relative rates of change and significance for waviness, tortuosity, and amplitude with age in each region. Note that all the rates were negative, indicating that the parameters were always decreasing with age and that the rate of change for the limbus was several times larger than that of any other region for each parameter. Green points indicate that the relationship found using the optimal tested transform was determined to be statistically significant (P < 0.00125), red indicates it was not.
Figure 7
Figure 7
Boxplots of waviness, tortuosity, and amplitude from the posterior to the anterior of the globe. The plots on the left are the trends across the globe in youth (ages 0–17) and the plots on the right are the trends in adults (18–97). There are similar decreases in both medians and range for all of the regions except the limbus.
Figure 8
Figure 8
Pairwise Mann-Whitney-Wilcoxon tests comparing the crimp parameters between regions. The tests were used to compare the waviness, tortuosity, and amplitude between each of the eight regions to one another, resulting in 28 tests per parameter. Regions varied substantially. Green boxes indicate the presence of significant differences between the regional pair (P < 0.000357) and red boxes indicate the lack of significant differences (P > 0.000357). The X's indicate the three boxes that are red in all three panels that were not significantly different.
Figure 9
Figure 9
Maps of significant associations between waviness, tortuosity, and amplitude with age based on the LME models. Green indicates that a significant relationship (P < 0.00125) was found between the parameter and age using the global transform. For tortuosity and amplitude, the global transform was square-root. For waviness, the global transform was linear. Red indicates that no significance was found (P > 0.00125).

References

    1. Drexler W, Morgner U, Ghanta RK, Kartner FX, Schuman JS, Fujimoto JG. . Ultrahigh-resolution ophthalmic optical coherence tomography. Nat Med. 2001; 7: 502– 507. - PMC - PubMed
    1. Fratzl P. . Collagen: Structure and Mechanics. Boston, MA: Springer Science & Business Media; 2008.
    1. Standring S. . Gray's Anatomy: The Anatomical Basis of Clinical Practice. 41st ed. New York: Elsevier Limited; 2016.
    1. Andreo RH, Farrell RA. . Corneal small-angle light-scattering theory: wavy fibril models. J Opt Soc Am. 1982; 72: 1479– 1492. - PubMed
    1. Gallagher B, Maurice D. . Striations of light scattering in the corneal stroma. J Ultrastruct Res. 1977; 61: 100– 114. - PubMed

Publication types