

The impact of a prescription review and prescriber feedback system on prescribing practices in primary care clinics: a cluster randomised trial
- PMID: 30025534
- PMCID: PMC6053727
- DOI: 10.1186/s12875-018-0808-4
The impact of a prescription review and prescriber feedback system on prescribing practices in primary care clinics: a cluster randomised trial
Abstract
Background: To evaluate the effectiveness of a structured prescription review and prescriber feedback program in reducing prescribing errors in government primary care clinics within an administrative region in Malaysia.
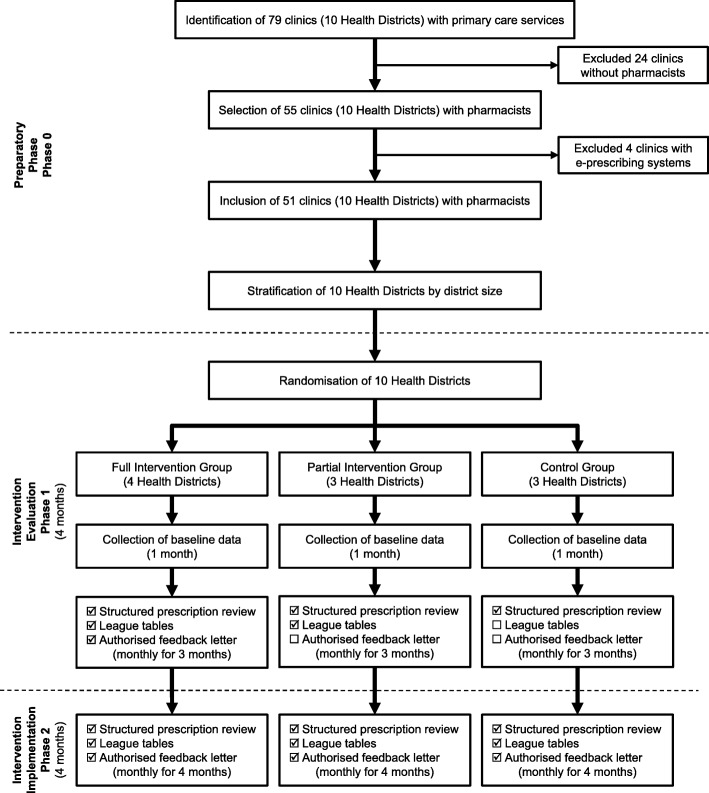
Methods: This was a three group, pragmatic, cluster randomised trial. In phase 1, we randomised 51 clinics to a full intervention group (prescription review and league tables plus authorised feedback letter), a partial intervention group (prescription review and league tables), and a control group (prescription review only). Prescribers in these clinics were the target of our intervention. Prescription reviews were performed by pharmacists; 20 handwritten prescriptions per prescriber were consecutively screened on a random day each month, and errors identified were recorded in a standardised data collection form. Prescribing performance feedback was conducted at the completion of each prescription review cycle. League tables benchmark prescribing errors across clinics and individual prescribers, while the authorised feedback letter detailed prescribing performance based on a rating scale. In phase 2, all clinics received the full intervention. Pharmacists were trained on data collection, and all data were audited by researchers as an implementation fidelity strategy. The primary outcome, percentage of prescriptions with at least one error, was displayed in p-charts to enable group comparison.
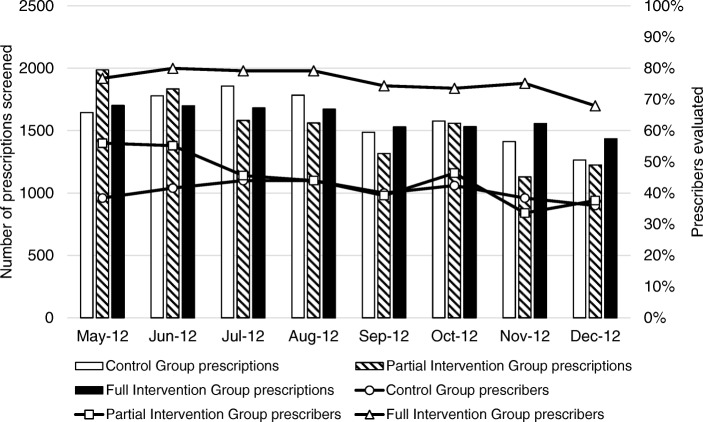
Results: A total of 32,200 prescriptions were reviewed. In the full intervention group, error reduction occurred gradually and was sustained throughout the 8-month study period. The process mean error rate of 40.7% (95% CI 27.4, 29.5%) in phase 1 reduced to 28.4% (95% CI 27.4, 29.5%) in phase 2. In the partial intervention group, error reduction was not well sustained and showed a seasonal pattern with larger process variability. The phase 1 error rate averaging 57.9% (95% CI 56.5, 59.3%) reduced to 44.8% (95% CI 43.3, 46.4%) in phase 2. There was no evidence of improvement in the control group, with phase 1 and phase 2 error rates averaging 41.1% (95% CI 39.6, 42.6%) and 39.3% (95% CI 37.8, 40.9%) respectively.
Conclusions: The rate of prescribing errors in primary care settings is high, and routine prescriber feedback comprising league tables and a feedback letter can effectively reduce prescribing errors.
Trial registration: National Medical Research Register: NMRR-12-108-11,289 (5th March 2012).
Keywords: Feedback; League tables; P-chart; Prescribers; Prescribing errors; Prescription review; Primary care; Statistical process control chart.
Conflict of interest statement
Ethics approval and consent to participate
The study had waiver of informed consent from the Medical Research & Ethics Committee (MREC), Ministry of Health Malaysia ((2) dlm.KKM/NIHSEC/08/0804/P12–186) as data in the study were routinely collected prescription data and identifying information was not disclosed. This cluster randomised trial was not registered with the International Clinical Trials Registry as the purpose of this trial was to examine the effect of the intervention only on the prescribers (healthcare providers) and not patients, in compliance with the International Committee of Medical Journal Editors (ICMJE) guidelines on clinical trial registration. The trial is registered with the National Medical Research Registry (NMRR-12-108-11,289), Ministry of Health Malaysia as per guidelines of the MREC.
Consent for publication
Not applicable.
Competing interests
The authors declare that they have no competing interests.
Publisher’s Note
Springer Nature remains neutral with regard to jurisdictional claims in published maps and institutional affiliations.
Figures


References
-
- Avery AJ, Rodgers S, Cantrill JA, Armstrong S, Cresswell K, Eden M, et al. A pharmacist-led information technology intervention for medication errors (PINCER): a multicentre, cluster randomised, controlled trial and cost-effectiveness analysis. Lancet. 2012;379(9823):1310–1319. doi: 10.1016/S0140-6736(11)61817-5. - DOI - PMC - PubMed
-
- Hughes RG, Blegen MA. Medication administration safety. In: Hughes RG, editor. Patient safety and quality: an evidence-based handbook for nurses. Rockville (MD): Agency for Healthcare Research and Quality (US); 2008. Chapter 37. http://www.ncbi.nlm.nih.gov/books/NBK2656/
Publication types
MeSH terms
LinkOut - more resources
Full Text Sources
Other Literature Sources
Medical
