

Probabilistic functional tractography of the human cortex revisited
- PMID: 30025851
- PMCID: PMC6150949
- DOI: 10.1016/j.neuroimage.2018.07.039
Probabilistic functional tractography of the human cortex revisited
Abstract
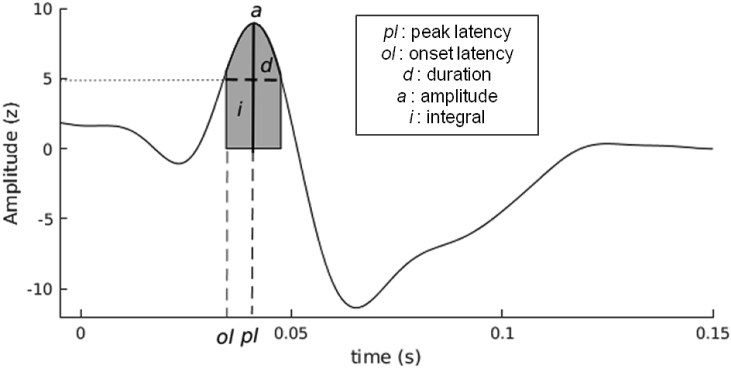
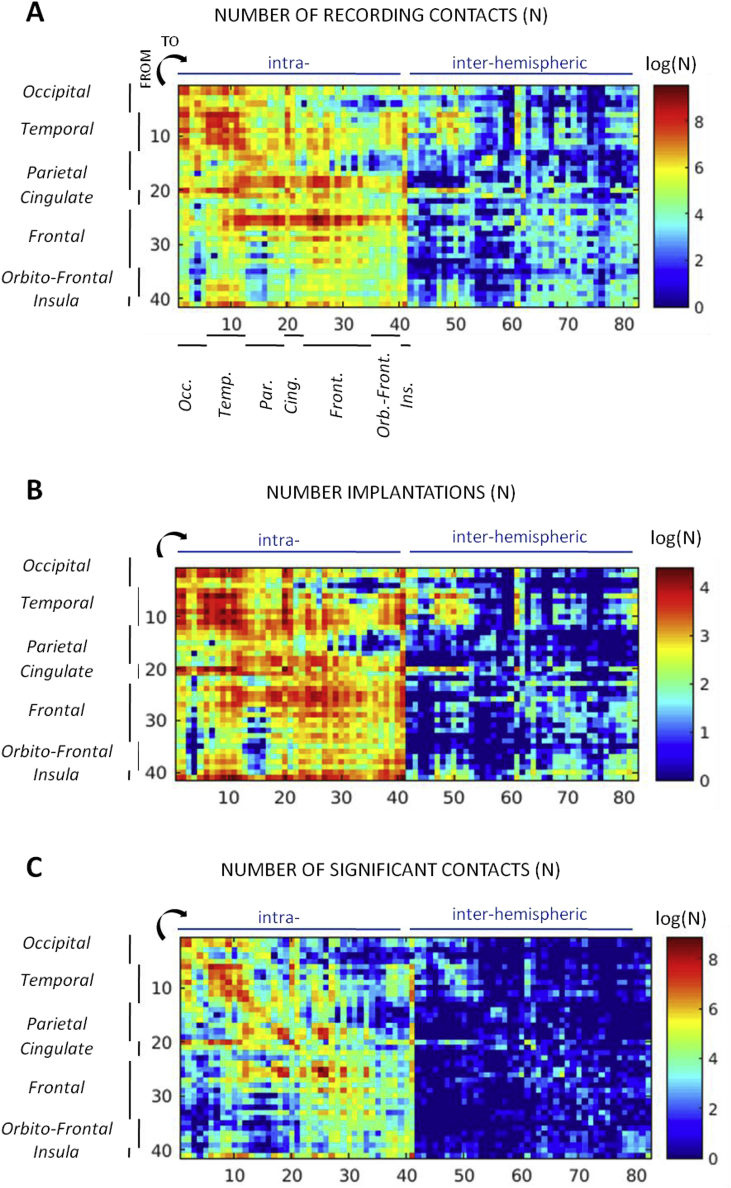
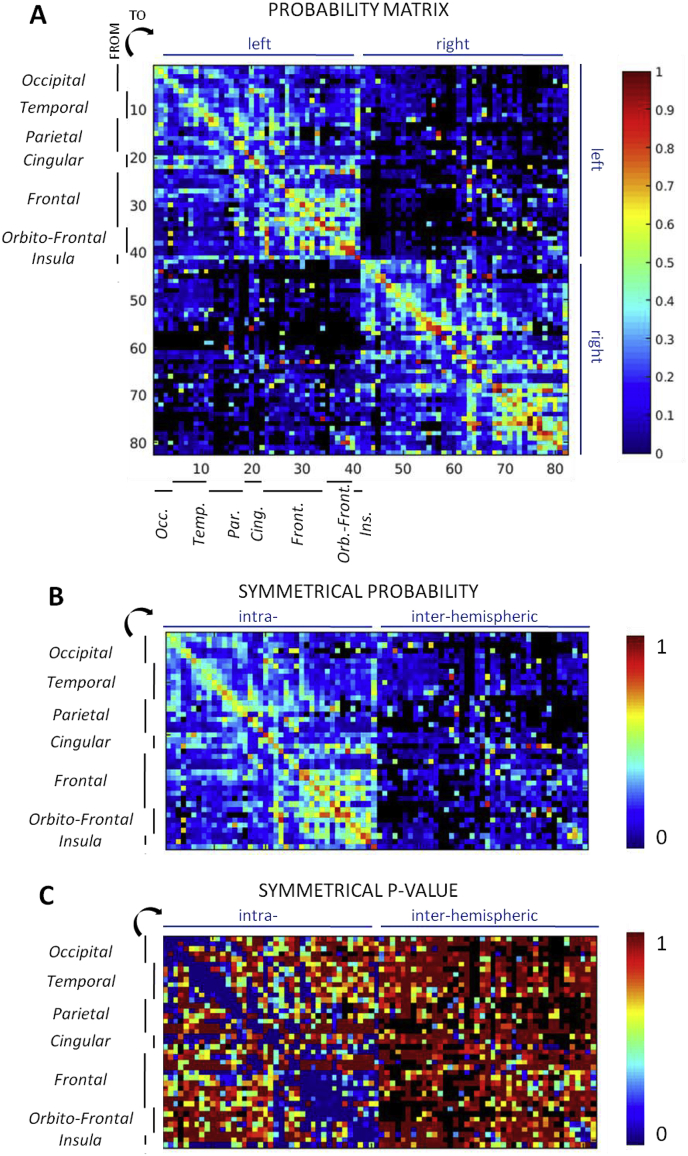
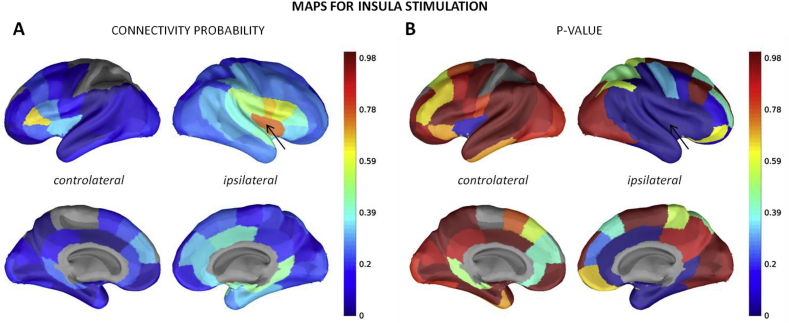
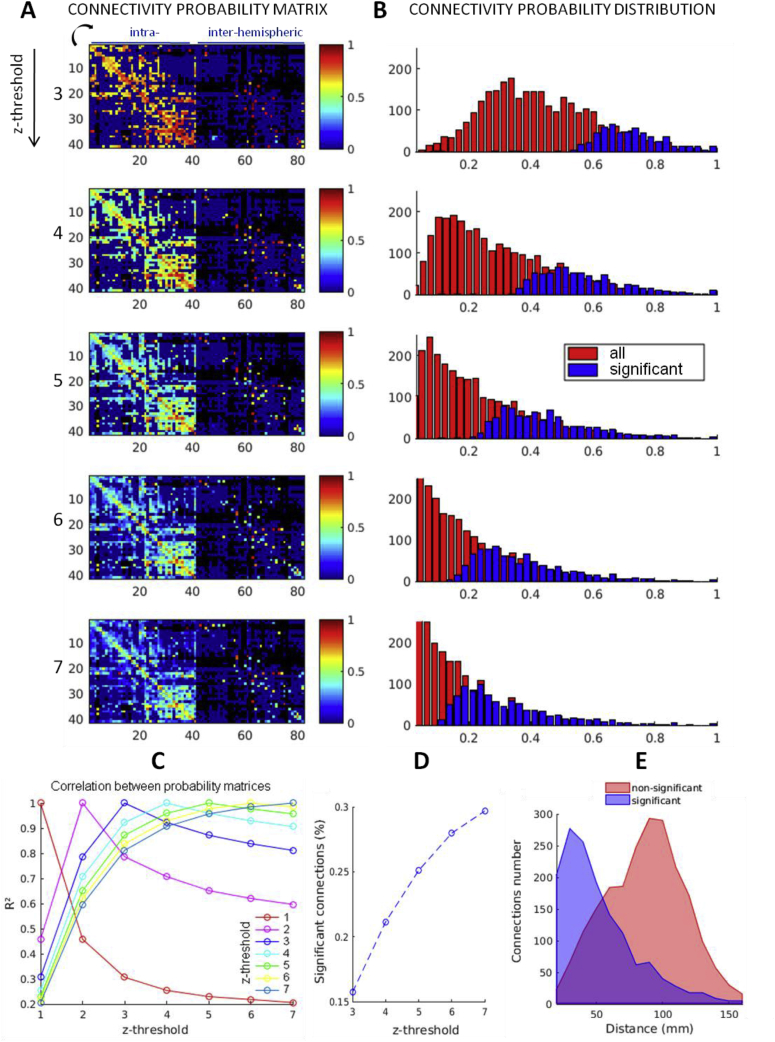
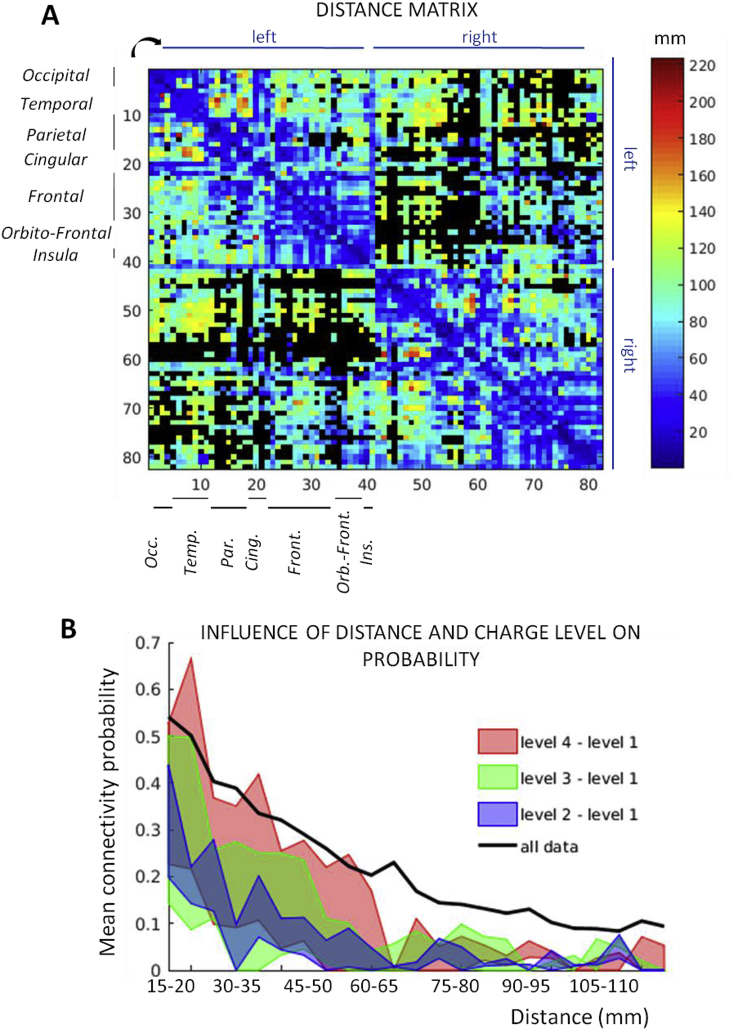
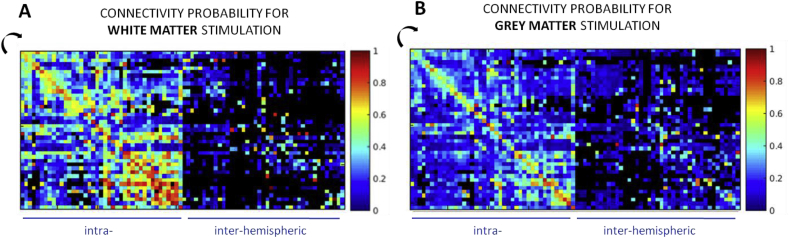
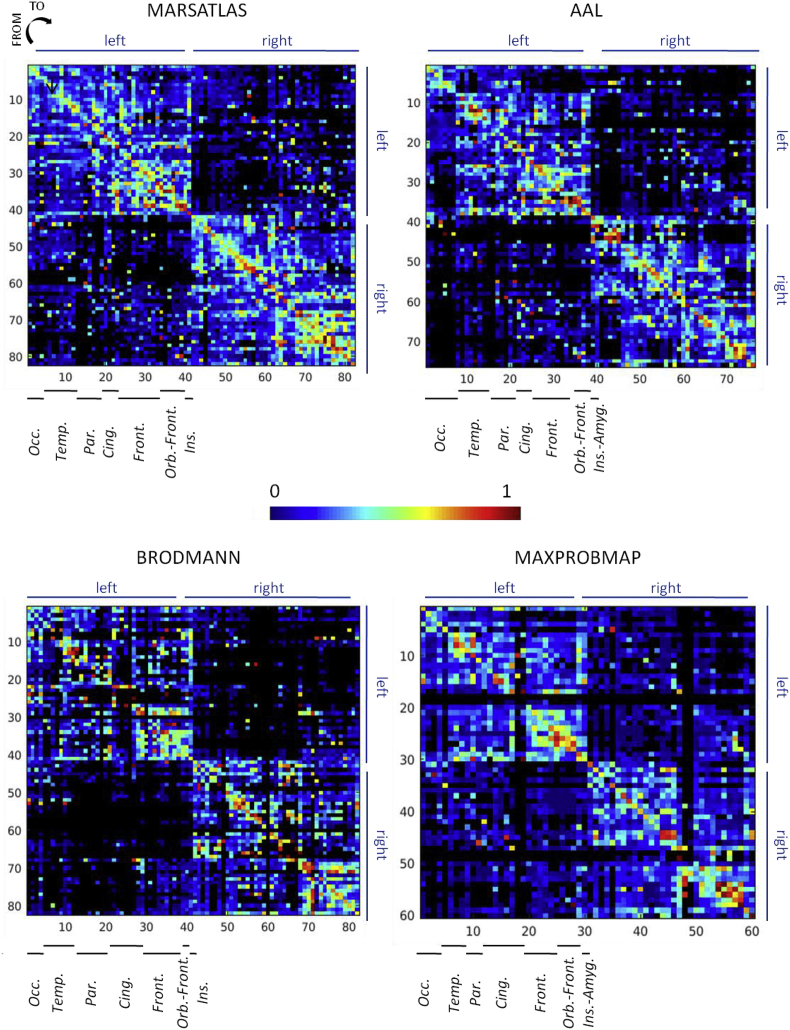
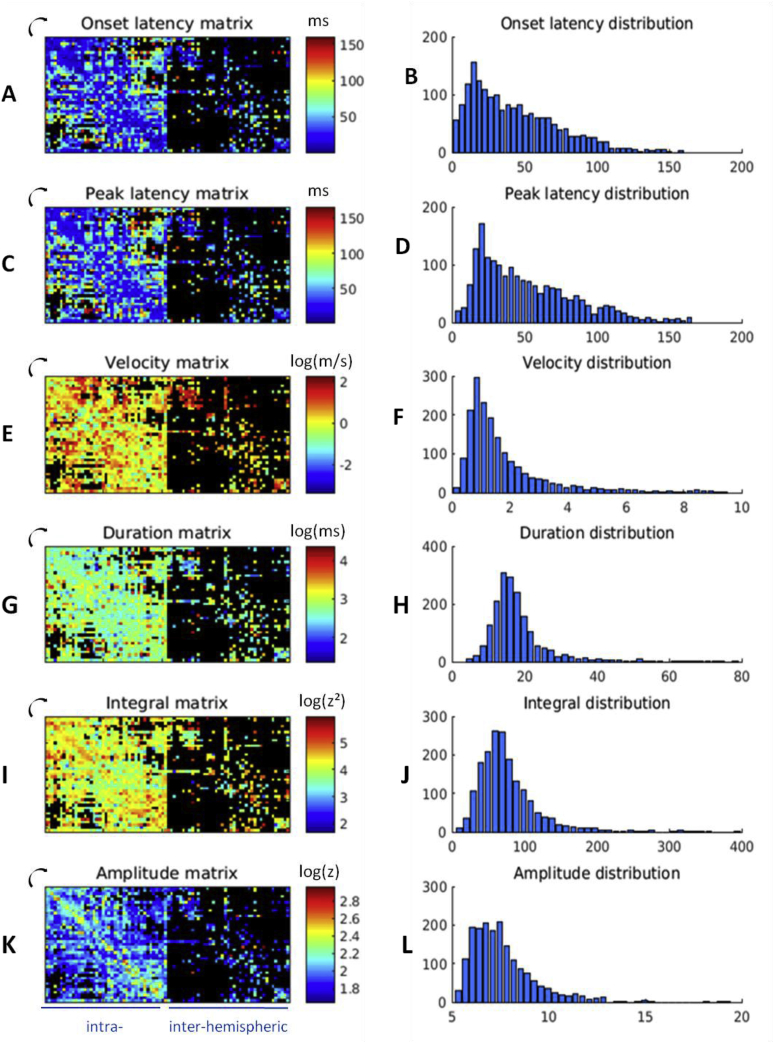
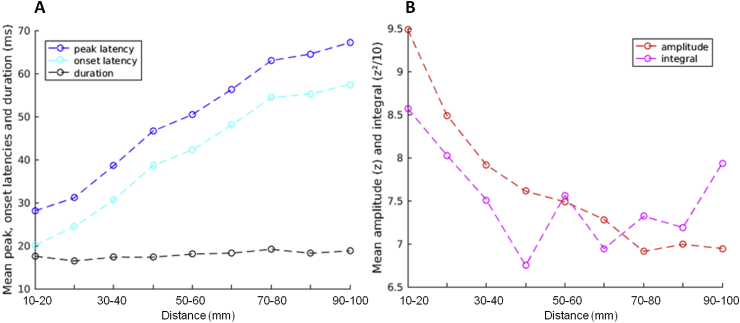
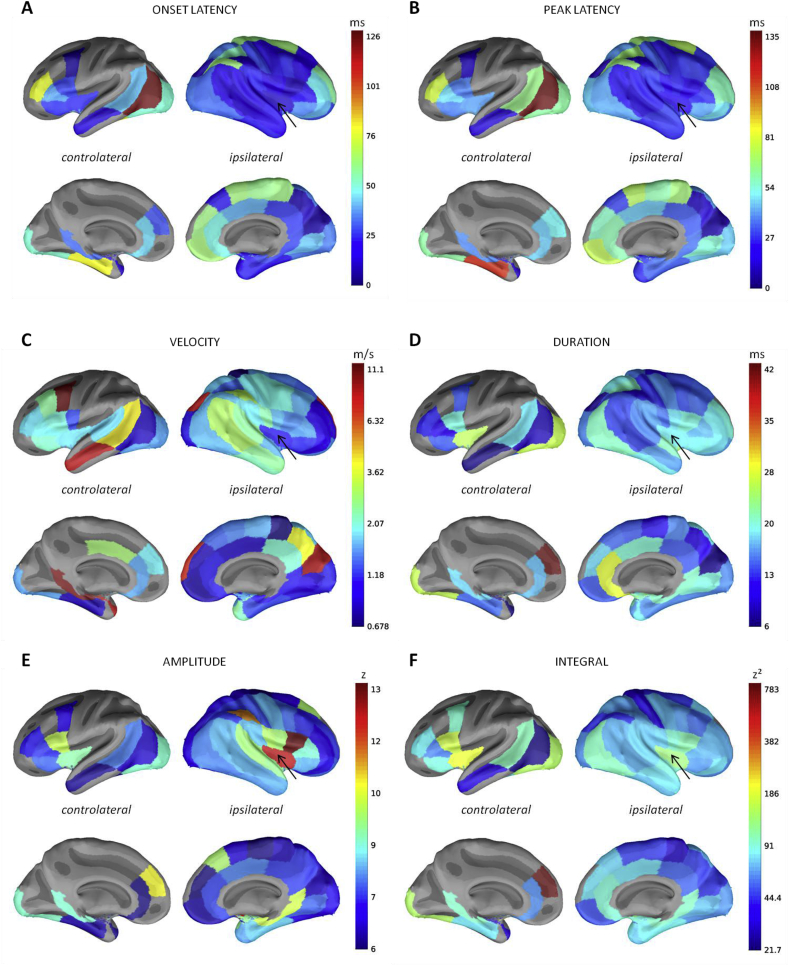
In patients with pharmaco-resistant focal epilepsies investigated with intracranial electroencephalography (iEEG), direct electrical stimulations of a cortical region induce cortico-cortical evoked potentials (CCEP) in distant cerebral cortex, which properties can be used to infer large scale brain connectivity. In 2013, we proposed a new probabilistic functional tractography methodology to study human brain connectivity. We have now been revisiting this method in the F-TRACT project (f-tract.eu) by developing a large multicenter CCEP database of several thousand stimulation runs performed in several hundred patients, and associated processing tools to create a probabilistic atlas of human cortico-cortical connections. Here, we wish to present a snapshot of the methods and data of F-TRACT using a pool of 213 epilepsy patients, all studied by stereo-encephalography with intracerebral depth electrodes. The CCEPs were processed using an automated pipeline with the following consecutive steps: detection of each stimulation run from stimulation artifacts in raw intracranial EEG (iEEG) files, bad channels detection with a machine learning approach, model-based stimulation artifact correction, robust averaging over stimulation pulses. Effective connectivity between the stimulated and recording areas is then inferred from the properties of the first CCEP component, i.e. onset and peak latency, amplitude, duration and integral of the significant part. Finally, group statistics of CCEP features are implemented for each brain parcel explored by iEEG electrodes. The localization (coordinates, white/gray matter relative positioning) of electrode contacts were obtained from imaging data (anatomical MRI or CT scans before and after electrodes implantation). The iEEG contacts were repositioned in different brain parcellations from the segmentation of patients' anatomical MRI or from templates in the MNI coordinate system. The F-TRACT database using the first pool of 213 patients provided connectivity probability values for 95% of possible intrahemispheric and 56% of interhemispheric connections and CCEP features for 78% of intrahemisheric and 14% of interhemispheric connections. In this report, we show some examples of anatomo-functional connectivity matrices, and associated directional maps. We also indicate how CCEP features, especially latencies, are related to spatial distances, and allow estimating the velocity distribution of neuronal signals at a large scale. Finally, we describe the impact on the estimated connectivity of the stimulation charge and of the contact localization according to the white or gray matter. The most relevant maps for the scientific community are available for download on f-tract. eu (David et al., 2017) and will be regularly updated during the following months with the addition of more data in the F-TRACT database. This will provide an unprecedented knowledge on the dynamical properties of large fiber tracts in human.
Keywords: Brain atlas; Connectivity mapping; Cortico-cortical evoked potentials; Epilepsy; Intracranial electroencephalogram.
Copyright © 2018 The Authors. Published by Elsevier Inc. All rights reserved.
Figures
References
-
- Ashburner J. Computational anatomy with the SPM software. Magn. Reson. Imaging. 2009;27:1163–1174. - PubMed
-
- Besson P., Bandt S.K., Proix T., Lagarde S., Jirsa V.K., Ranjeva J.-P., Bartolomei F., Guye M. Anatomic consistencies across epilepsies: a stereotactic-EEG informed high-resolution structural connectivity study. Brain. 2017:1–14. - PubMed
Publication types
MeSH terms
LinkOut - more resources
Full Text Sources
Other Literature Sources
Medical
Research Materials
