. 2019 Jan;16(1):18-25.
doi: 10.1016/j.hrthm.2018.07.019. Epub 2018 Jul 17.

Structural remodeling and conduction velocity dynamics in the human left atrium: Relationship with reentrant mechanisms sustaining atrial fibrillation

Affiliations

Structural remodeling and conduction velocity dynamics in the human left atrium: Relationship with reentrant mechanisms sustaining atrial fibrillation

Shohreh Honarbakhsh et al. Heart Rhythm. 2019 Jan.

Abstract

Background: Rate-dependent conduction velocity (CV) slowing is associated with atrial fibrillation (AF) initiation and reentrant mechanisms.

Objective: The purpose of this study was to assess the relationship between bipolar voltage, CV dynamics, and AF drivers.

Methods: Patients undergoing catheter ablation for persistent AF (<24 months) were enrolled. Unipolar electrograms were recorded with a 64-pole basket catheter during atrial pacing at 4 pacing intervals (PIs) during sinus rhythm. CVs were measured between pole pairs along the wavefront path and correlated with underlying bipolar voltage. CV dynamics within low-voltage zones (LVZs <0.5 mV) were compared to those of non-LVZs (≥0.5 mV) and were correlated to driver sites mapped using CARTOFINDER (Biosense Webster).

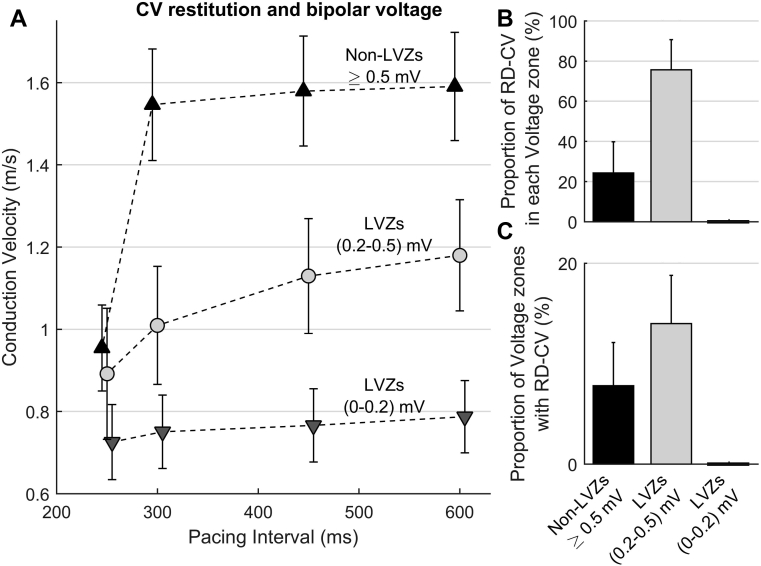
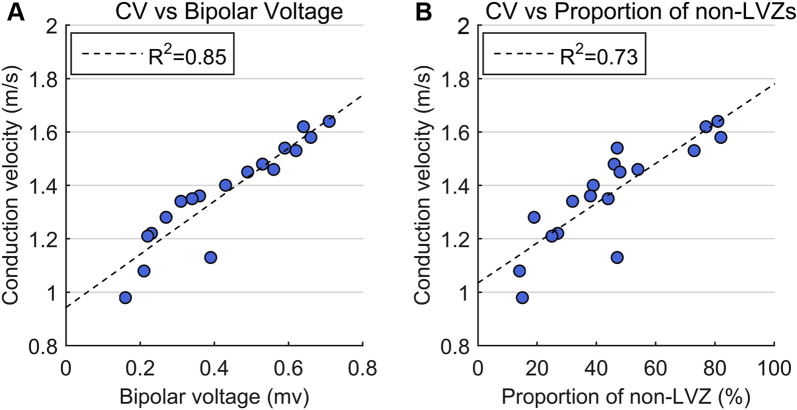
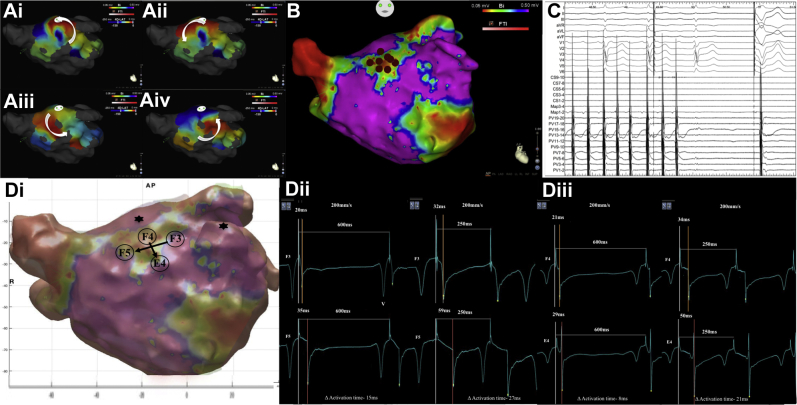
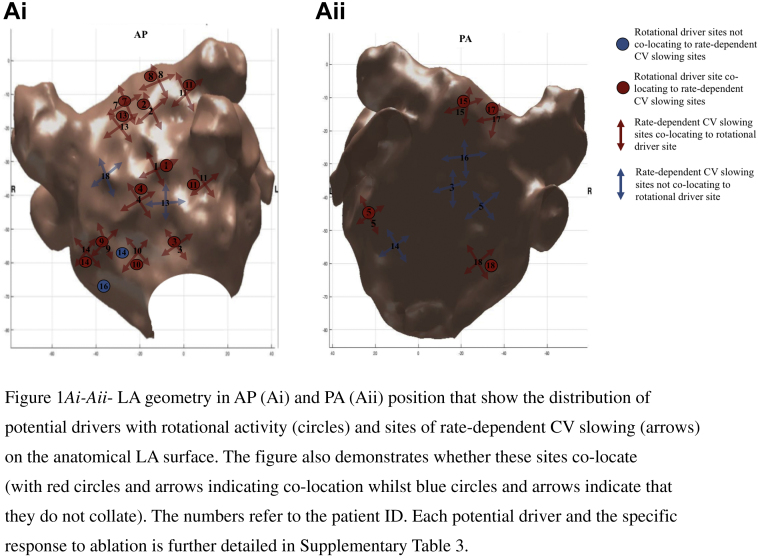
Results: Eighteen patients were included (age 62 ± 10 years). Mean CV at 600 ms was 1.59 ± 0.13 m/s in non-LVZs vs 0.98 ± 0.23 m/s in LVZs (P <.001). CV decreased incrementally over all 4 PIs in LVZs, whereas in non-LVZs a substantial decrease in CV was only seen between PIs 300-250 ms (0.59 ± 0.09 m/s; P <.001). Rate-dependent CV slowing sites measurements, defined as exhibiting CV reduction ≥20% more than the mean CV reduction seen between PIs 600-250 ms for that voltage zone, were predominantly in LVZs (0.2-0.5 mV; 75.6% ± 15.5%; P <.001). Confirmed rotational drivers were mapped to these sites in 94.1% of cases (sensitivity 94.1%, 95% CI 71.3%-99.9%; specificity 77.9%, 95% CI 74.9%-80.7%).

Conclusion: CV dynamics are determined largely by the extent of remodeling. Rate-dependent CV slowing sites are predominantly confined to LVZs (0.2-0.5 mV), and the resultant CV heterogeneity may promote driver formation in AF.

Keywords: Atrial fibrillation; Bipolar voltage; Conduction velocity; Drivers; Structural remodeling.


Figures

Figure 1
Figure 1
Anterior (A) and posterior (B) views of the left atrium showing the distribution of the low-voltage zones and rate-dependent conduction velocity slowing sites (percentage in brackets) in the patients involved in the study. Red indicates septum; green indicates lateral; blue indicates anterior; yellow indicates posterior; purple indicates roof.
Figure 2
Figure 2
A: Change in CV over the 4 pacing intervals in non-LVZs ≥0.5 mV (black triangles), LVZs (0.2–0.5 mV) (light gray circles), and LVZs (0–0.2 mV) (dark gray triangles). B, C: Bar chart showing the percentage of rate-dependent CV slowing sites in non-LVZs ≥0.5 mV, LVZs (0.2–0.5 mV), and LVZs (0–0.2 mV) (B) and the proportion of non-LVZs ≥0.5 mV, LVZs (0.2–0.5 mV), and LVZs (0–0.2 mV) demonstrating rate-dependent CV slowing (C). CV = conduction velocity; LVZ = low-voltage zone; RD-CV = rate-dependent conduction velocity.
Figure 3
Figure 3
Relationship between mean CV for each patient at pacing interval of 600 ms (the average of all the CV measured between all pole pairs in each patient) and mean bipolar voltage including all bipolar voltage points in each patient (A) and the proportion of non-LVZs in each patient (B). CV = conduction velocity; LVZ = low-voltage zone.
Figure 4
Figure 4
A: i–iv: Still CARTOFINDER map demonstrating a rotational driver at the anterior roof (B) in an area of LVZ as shown on the bipolar voltage map (C), where ablation resulted in atrial fibrillation termination to sinus rhythm on the Bard electrograms. D: i: Replicated CARTO geometry created in MATLAB demonstrating site of rate-dependent conduction velocity (CV) slowing at the anterior roof in an area of LVZ (0.2–0.5 mV) (F3–F5 electrodes; vertical and F4–E4 electrode: horizontal). ii: Electrograms obtained at F3 and F5 electrodes during left atrial appendage pacing at PI 600–250 ms show an increase in activation time difference of 12 ms (80% increase) between the 2 electrodes when reaching PI of 250 ms. (iii) Electrograms obtained at F4 and E4 electrodes during roof pacing at PI 600–250 ms show an increase in activation time difference of 13 ms (163% increase). LVZ = low-voltage zone; PI = pacing interval; V = far-field ventricular signal.
Supplemental Figure 1
Ai–Aii: LA geometry in AP (Ai) and PA (Aii) position that show the distribution of potential drivers with rotational activity (circles) and sites of rate-dependent CV slowing (arrows) on the anatomical LA surface. The figure also demonstrates whether these sites co-locate (with red circles and arrows indicating co-location whilst blue circles and arrows indicate that they do not collate). The numbers refer to the patient ID. Each potential driver and the specific response to ablation is further detailed in Supplementary Table 3.

References

    1. Miyamoto K., Tsuchiya T., Narita S., Yamaguchi T., Nagamoto Y., Ando S., Hayashida K., Tanioka Y., Takahashi N. Bipolar electrogram amplitudes in the left atrium are related to local conduction velocity in patients with atrial fibrillation. Europace. 2009;11:1597–1605. - PubMed
    1. Fukumoto K., Habibi M., Ipek E.G. Association of local left atrial conduction velocity with late gadolinium enhancement on cardiac magnetic resonance in patients with atrial fibrillation. Circ Arrhythm Electrophysiol. 2016;9:e002897. - PMC - PubMed
    1. Yagishita A., Gimbel J.R., DE Oliveira S., Manyam H., Sparano D., Cakulev I., Mackall J., Arruda M. Long-term outcome of left atrial voltage-guided substrate ablation during atrial fibrillation: a novel adjunctive ablation strategy. J Cardiovasc Electrophysiol. 2017;28:147–155. - PubMed
    1. Koller M.L., Maier S.K., Gelzer A.R., Bauer W.R., Meesmann M., Gilmour R.F., Jr. Altered dynamics of action potential restitution and alternans in humans with structural heart disease. Circulation. 2005;112:1542–1548. - PubMed
    1. Lalani G.G., Schricker A., Gibson M., Rostamian A., Krummen D.E., Narayan S.M. Atrial conduction slows immediately before the onset of human atrial fibrillation: a bi-atrial contact mapping study of transitions to atrial fibrillation. J Am Coll Cardiol. 2012;59:595–606. - PMC - PubMed

Publication types