. 2019 Jan;78(1):100-110.
doi: 10.1136/annrheumdis-2017-212863. Epub 2018 Jul 19.

Single-cell RNA-seq analysis reveals the progression of human osteoarthritis

Affiliations

Single-cell RNA-seq analysis reveals the progression of human osteoarthritis

Quanbo Ji et al. Ann Rheum Dis. 2019 Jan.

Abstract

Objectives: Understanding the molecular mechanisms underlying human cartilage degeneration and regeneration is helpful for improving therapeutic strategies for treating osteoarthritis (OA). Here, we report the molecular programmes and lineage progression patterns controlling human OA pathogenesis using single-cell RNA sequencing (scRNA-seq).

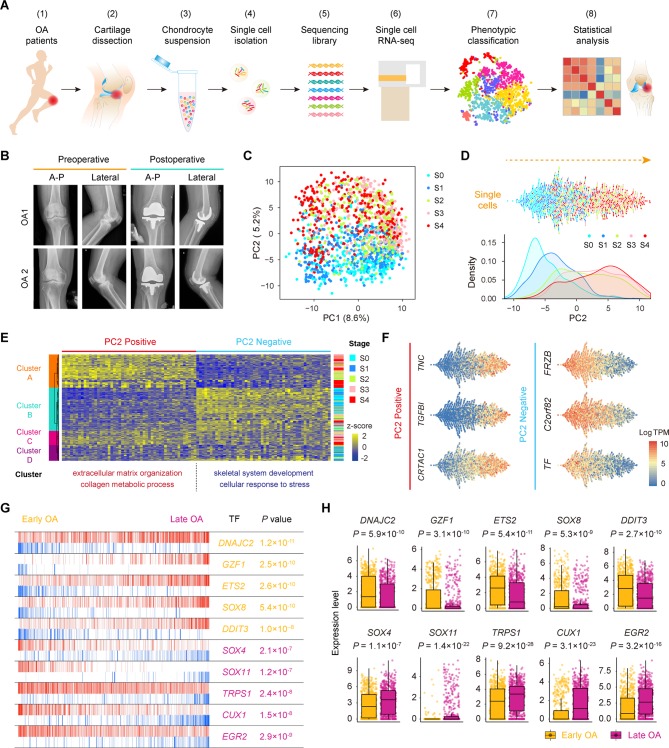
Methods: We performed unbiased transcriptome-wide scRNA-seq analysis, computational analysis and histological assays on 1464 chondrocytes from 10 patients with OA undergoing knee arthroplasty surgery. We investigated the relationship between transcriptional programmes of the OA landscape and clinical outcome using severity index and correspondence analysis.

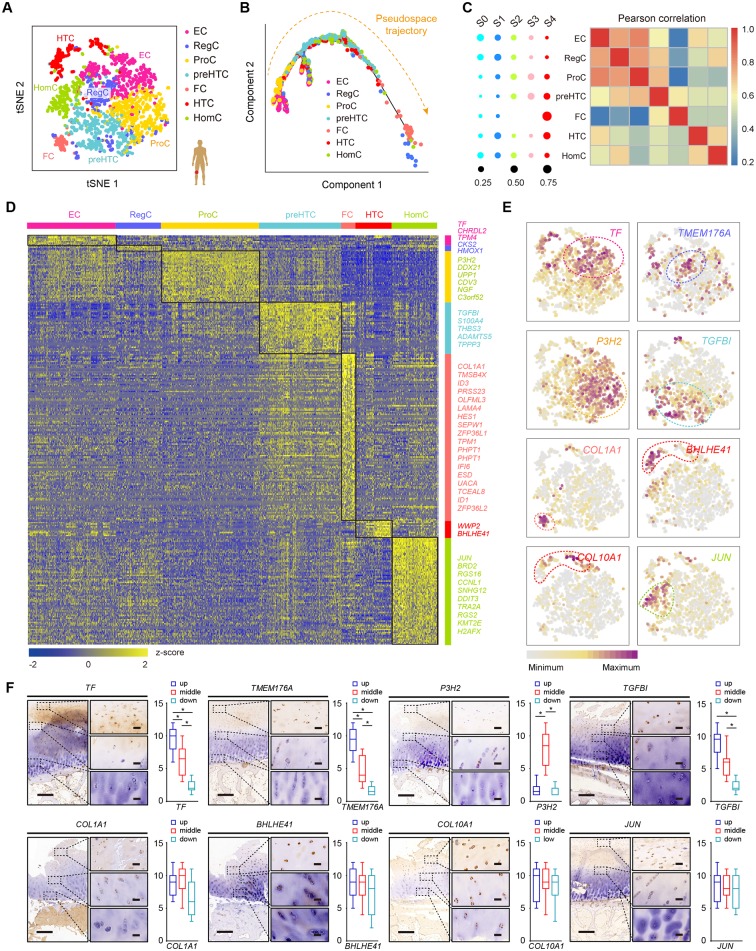
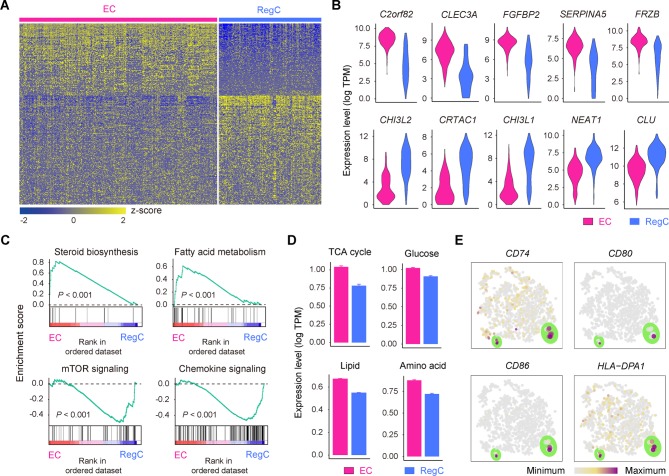
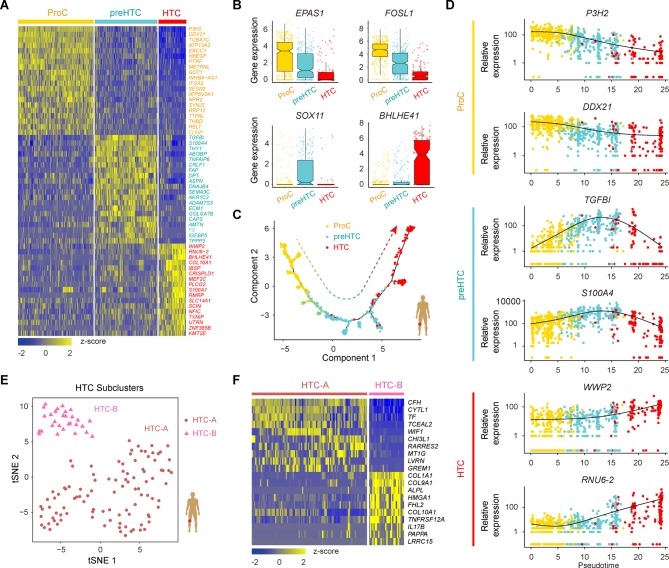
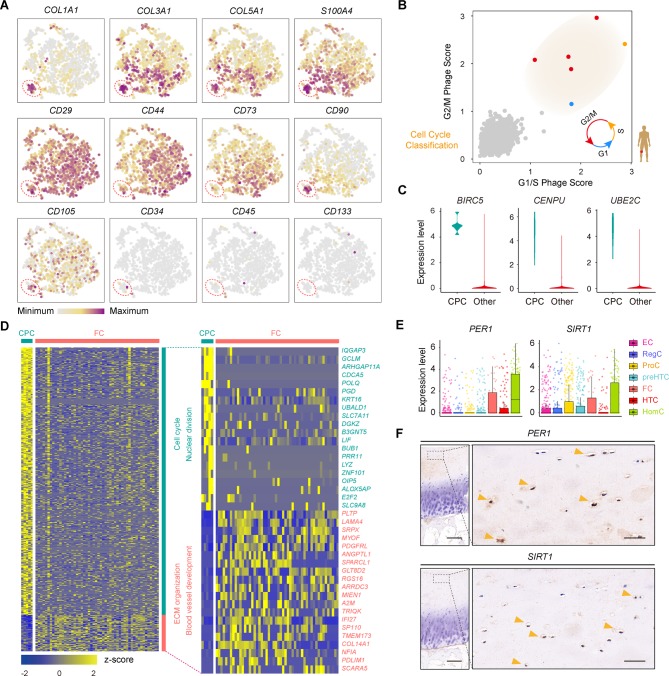
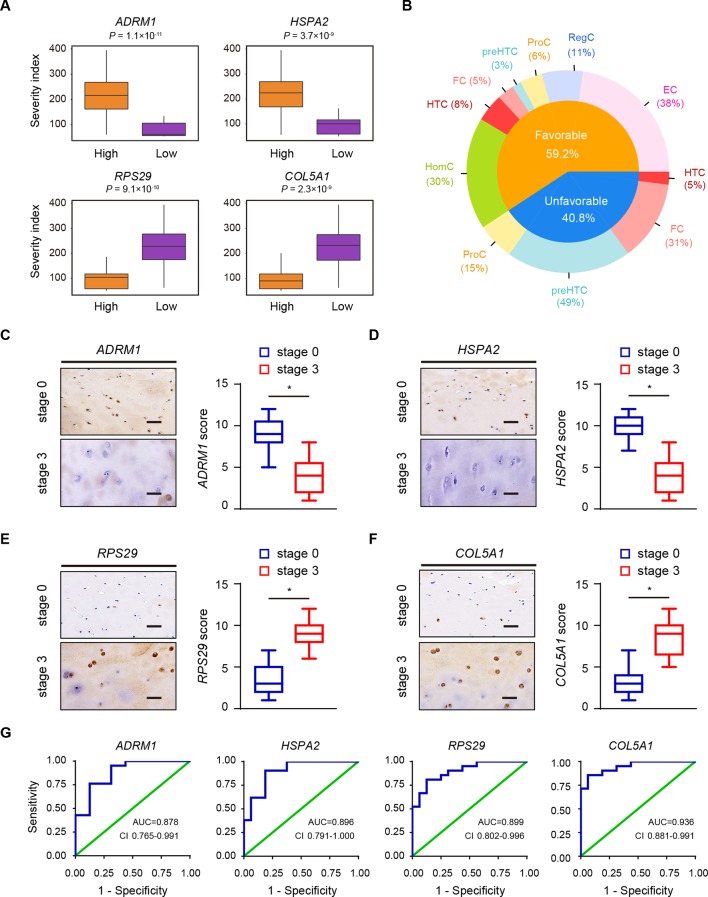
Results: We identified seven molecularly defined populations of chondrocytes in the human OA cartilage, including three novel phenotypes with distinct functions. We presented gene expression profiles at different OA stages at single-cell resolution. We found a potential transition among proliferative chondrocytes, prehypertrophic chondrocytes and hypertrophic chondrocytes (HTCs) and defined a new subdivision within HTCs. We revealed novel markers for cartilage progenitor cells (CPCs) and demonstrated a relationship between CPCs and fibrocartilage chondrocytes using computational analysis. Notably, we derived predictive targets with respect to clinical outcomes and clarified the role of different cell types for the early diagnosis and treatment of OA.

Conclusions: Our results provide new insights into chondrocyte taxonomy and present potential clues for effective and functional manipulation of human OA cartilage regeneration that could lead to improved health.

Keywords: chondrocytes; knee osteoarthritis; osteoarthritis.


Conflict of interest statement

Competing interests: None declared.

Figures

Figure 1
Figure 1
Single-cell RNA-seq of human OA cartilage chondrocytes. (A) Schematic workflow of the experimental strategy. (B) Representative preoperative and postoperative radiographs of patients with knee OA undergoing arthroplasty. (C) PCA plot of single-cell transcriptomes based on the 500 most variable genes. S0 to S4, stage 0 to 4. (D) Beeswarm plot showing all filtered cells according to their coordinates along PC2 and coloured according to the OA stage of the cartilage sample. The cell density distribution of each stage along PC2 is shown below. (E) Hierarchical clustering of cells (rows) using the 50 most positively correlated and 50 most negatively correlated genes (columns) along PC2. Cells are classified into four clusters (left sidebar). The enriched GO terms for the genes showing the greatest correlation along PC2 are shown below. (F) The expression levels of three representative genes showing positive and negative correlations along PC2. (G) The top 10 candidate transcription factors for early-stage (S0 and S1, yellow) and late-stage (S3 and S4, purple) OA identified by the master regulator analysis algorithm (MARINa). Genes are rank-sorted according to their expression levels on the x-axis for regulators, with the p value depicting the enrichment significance. (H) Boxplots showing the expression levels of early-stage and late-stage OA candidate transcription factors and p values representing the significance of expression levels. GO, gene ontology; PCA, principal component analysis; OA, osteoarthritis.
Figure 2
Figure 2
Identification of chondrocyte populations and gene signatures during human OA progression. (A) Visualisation of t-SNE coloured according to cell types for human OA cartilage single-cell transcriptomes. (B) Monocle pseudospace trajectory revealing the OA chondrocyte lineage progression coloured according to cell types. (C) Dot plots showing the stage distribution in each cluster. Heatmap showing the pairwise correlations. (D) Heatmap revealing the scaled expression of differentially expressed genes for each cluster defined in (A). Specific representative genes in each chondrocyte subsets are highlighted along the right margin. The colour scheme is based on z-scores. (E) Dot plots showing the expression of indicated markers for each cell cluster on the t-SNE map. (F) Representative immunohistochemistry assay of indicated genes in cartilage tissues. Scale bar, left, 500 µm; right, 50 µm. The scores of different areas (up, middle, down) in cartilage tissues based on the immunohistochemistry assay are shown. *p<0.05, otherwise, not significant. EC, effector chondrocyte; RegC, regulatory chondrocyte; ProC, proliferative chondrocyte; preHTC, prehypertrophic chondrocyte; FC, fibrocartilage chondrocyte; HTC, hypertrophic chondrocyte; HomC, homeostatic chondrocyte; OA, osteoarthritis; t-SNE, t-distributed stochastic neighbour embedding.
Figure 3
Figure 3
Definition of ECs and RegCs. (A) Heatmap showing scaled expression of differentially expressed genes defining the EC and RegC subsets. (B) Violin plots showing the expression levels of representative candidate marker genes for ECs and RegCs. (C) GSEA showing enrichment of pathways between ECs and RegCs. (D) The expression levels of genes associated with the TCA (p=1.4×10⁻²⁵) and with glucose (p=1.5×10⁻¹⁵), lipid (p=2.7×10–182) and amino acid (p=3.2×10–58) metabolism in ECs and RegCs. (E) The cells are coloured according to the expression levels of the indicated markers for antigen processing and presentation on the t-SNE map. Cells are shown enlarged in the section outlined in green. ECs, effector chondrocytes; RegCs, regulatory chondrocytes; GSEA, gene set enrichment analysis; TCA, tricarboxylic acid cycle; t-SNE, t-distributed stochastic neighbour embedding.
Figure 4
Figure 4
Characterisation of ProCs, preHTCs and HTCs, and the definition of HTC subsets. (A) Heatmap showing the scaled expression of the top 20 differentially expressed genes defining the ProC, preHTC and HTC populations. (B) Boxplots showing the expression levels of transcription factors specifically expressed in different cell types. (C) Monocle pseudotime trajectory revealing the progression of ProCs, preHTCs and HTCs. (D) Pseudotemporal expression dynamics of specific representative genes (corresponding to (A)) marking ProCs, preHTCs and HTCs. All single cells in the ProC, preHTC and HTC cell lineage are ordered based on pseudotime. (E) t-SNE visualisation of the HTC-A and HTC-B subpopulations. (F) Heatmap showing the scaled expression of the top 10 differentially expressed genes defining the HTC-A and HTC-B subsets. HTCs, hypertrophic chondrocytes; preHTCs, prehypertrophic chondrocytes; ProCs, proliferative chondrocytes; t-SNE, t- distributed stochastic neighbour embedding.
Figure 5
Figure 5
Identification of FCs and CPCs. (A) Cells are coloured according to the expression levels of the indicated markers on the t-SNE map. (B) Classification of cells categorised as proliferative cells (coloured according to their approximate phase) and quiescent cells (coloured in grey) based on the relative expression of genes associated with the G1/S stage and G2/M stage. (C) Violin plots showing the gene expression of representative candidate marker genes of CPCs. (D) Heatmap showing the scaled expression of differentially expressed genes defining the CPC and FC subsets. The top 20 markers for CPCs and FCs are shown in the right. (E) Boxplots showing the expression levels of PER1 and SIRT1 in seven OA chondrocyte populations. (F) Representative immunohistochemical staining of the indicated markers in OA cartilage tissues (stage 0). Scale bar: left, 500 µm; right, 50 µm. CPCs, cartilage progenitor cells; ECs, effector chondrocytes; RegCs, regulatory chondrocytes; ProCs, proliferative chondrocytes; preHTCs, prehypertrophic chondrocytes; FCs, fibrocartilage chondrocytes; HTCs, hypertrophic chondrocytes; HomCs, homeostatic chondrocytes; OA, osteoarthritis; t-SNE, t-distributed stochastic neighbour embedding.
Figure 6
Figure 6
Clinical outcome in relation to the structure of the OA landscape. (A) Examples of the relationship between the severity index and predictive genes. Orange and purple boxplots corresponding to two groups of samples with high and low levels of gene expression, respectively. (B) Favourable and unfavourable predictive gene distributions in different OA chondrocyte types. (C–F) Representative immunohistochemistry assay of ADRM1 (C), HSPA2 (D), RPS29 (E) and COL5A1 (F) in cartilage tissues of OA stage 0 and stage 3. Scale bar, 50 µm. The scores of the indicated genes in cartilage tissues based on the immunohistochemistry assay are shown. *p<0.05. (G) ROC curve for the individual ADRM1 (RT<0.6569, sensitivity 0.762, specificity 0.875), HSPA2 (RT<0.7473, sensitivity 0.901, specificity 0.813), RPS29 (RT>1.186, sensitivity 0.810, specificity 0.875) and COL5A1 (RT>1.352, sensitivity 0.857, specificity 0.938) to separate patients with OA from health controls. AUC, area under curve; ECs, effector chondrocytes; RegCs, regulatory chondrocytes; ProCs, proliferative chondrocytes; preHTCs, prehypertrophic chondrocytes; FCs, fibrocartilage chondrocytes; HTCs, hypertrophic chondrocytes; HomCs, homeostatic chondrocytes; OA, osteoarthritis; ROC, receiver-operating characteristic; RT, ratio threshold.

References

    1. Edwards JJ, Khanna M, Jordan KP, et al. Quality indicators for the primary care of osteoarthritis: a systematic review. Ann Rheum Dis 2015;74:490–8. 10.1136/annrheumdis-2013-203913 - DOI - PMC - PubMed
    1. Jin X, Beguerie JR, Zhang W, et al. Circulating C reactive protein in osteoarthritis: a systematic review and meta-analysis. Ann Rheum Dis 2015;74:703–10. 10.1136/annrheumdis-2013-204494 - DOI - PubMed
    1. Wang TY, Chen D. Differential roles of TGF-β signalling in joint tissues during osteoarthritis development. Ann Rheum Dis 2016;75:e72 10.1136/annrheumdis-2016-210312 - DOI - PMC - PubMed
    1. Kim JH, Jeon J, Shin M, et al. Regulation of the catabolic cascade in osteoarthritis by the zinc-ZIP8-MTF1 axis. Cell 2014;156:730–43. 10.1016/j.cell.2014.01.007 - DOI - PubMed
    1. Jiang Y, Tuan RS. Origin and function of cartilage stem/progenitor cells in osteoarthritis. Nat Rev Rheumatol 2015;11:206–12. 10.1038/nrrheum.2014.200 - DOI - PMC - PubMed

Publication types