. 2018 Jul 19;8(1):10957.
doi: 10.1038/s41598-018-29069-3.

Chronic Electrical Stimulation Promotes the Excitability and Plasticity of ESC-derived Neurons following Glutamate-induced Inhibition In vitro

Affiliations

Chronic Electrical Stimulation Promotes the Excitability and Plasticity of ESC-derived Neurons following Glutamate-induced Inhibition In vitro

Charles-Francois V Latchoumane et al. Sci Rep. .

Abstract

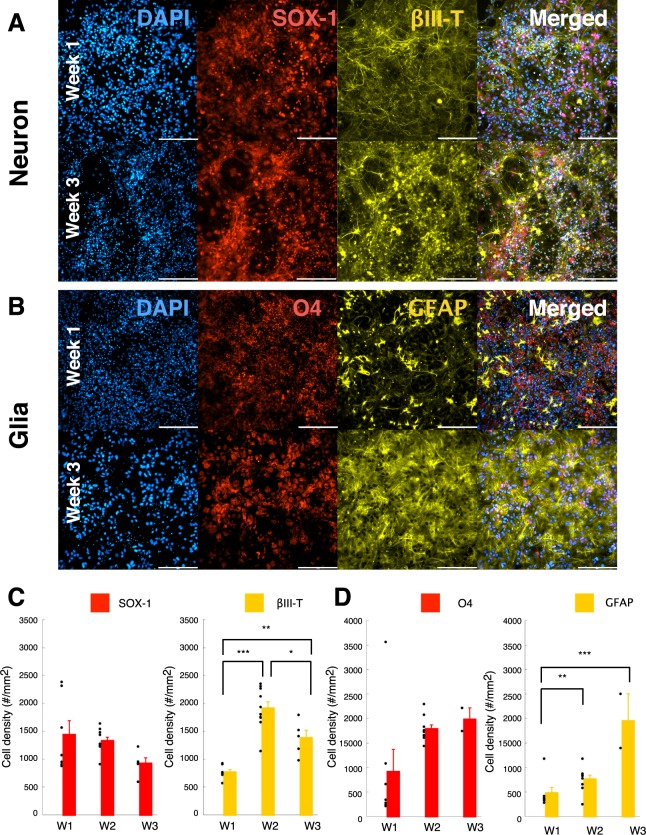
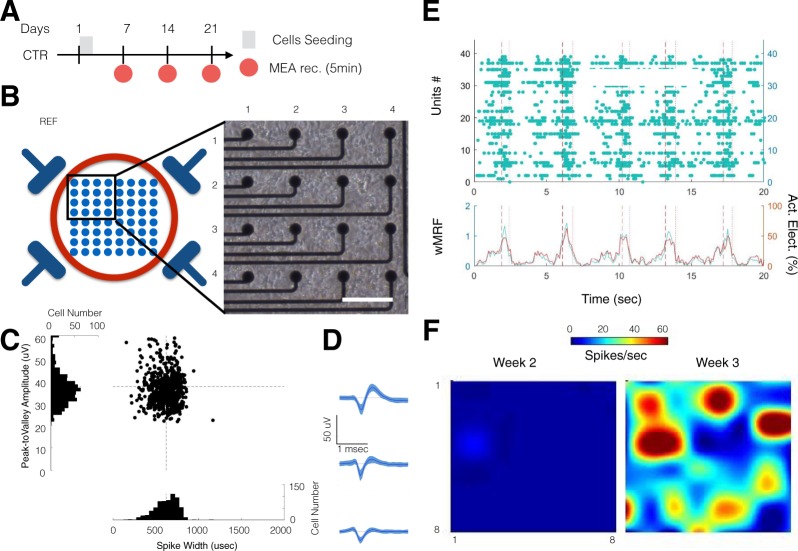
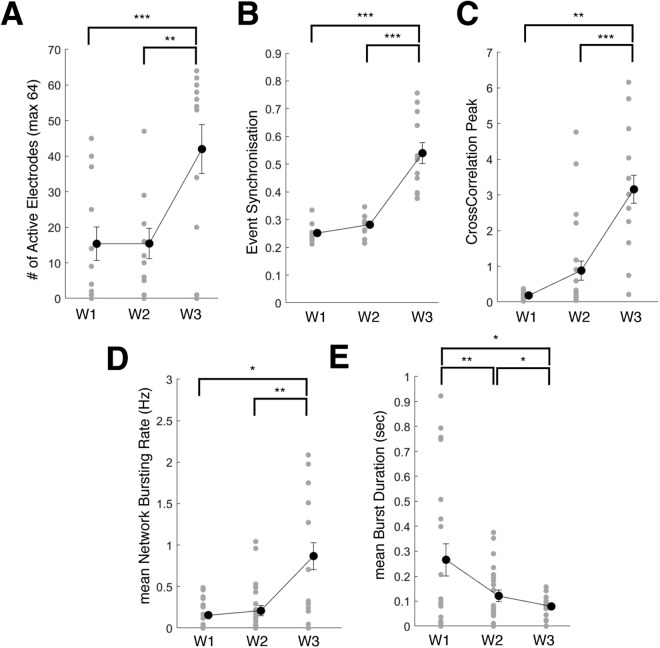
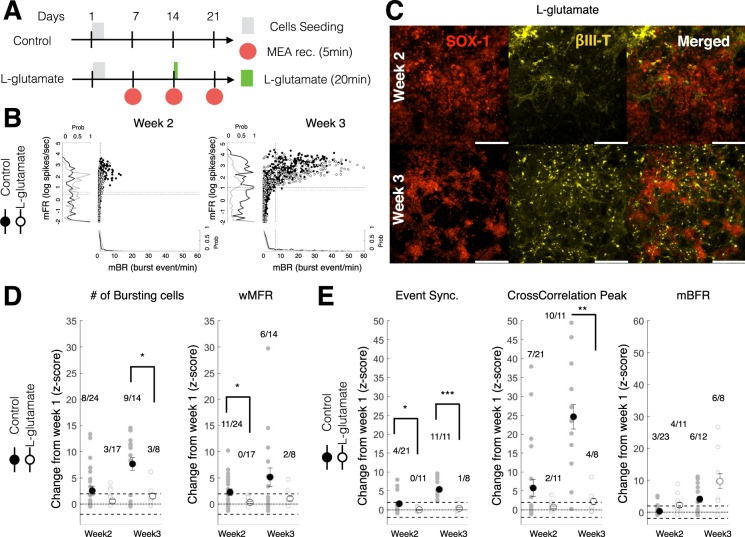
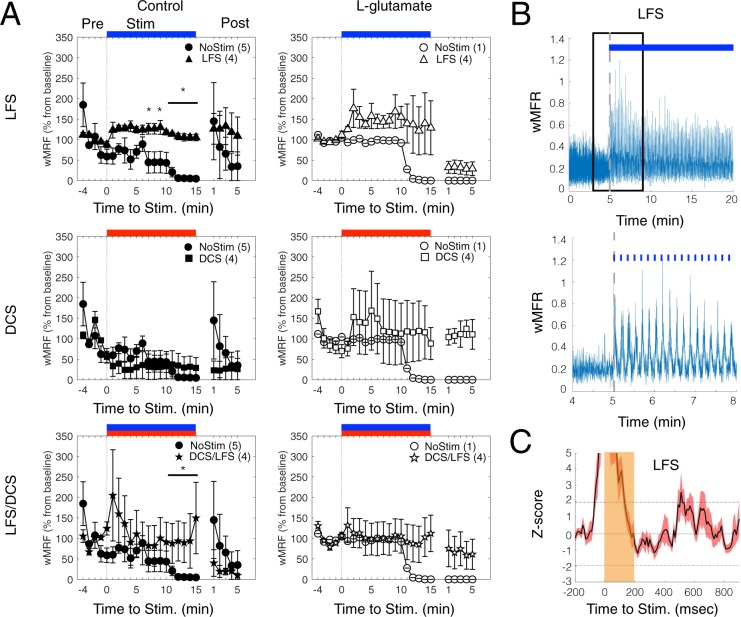
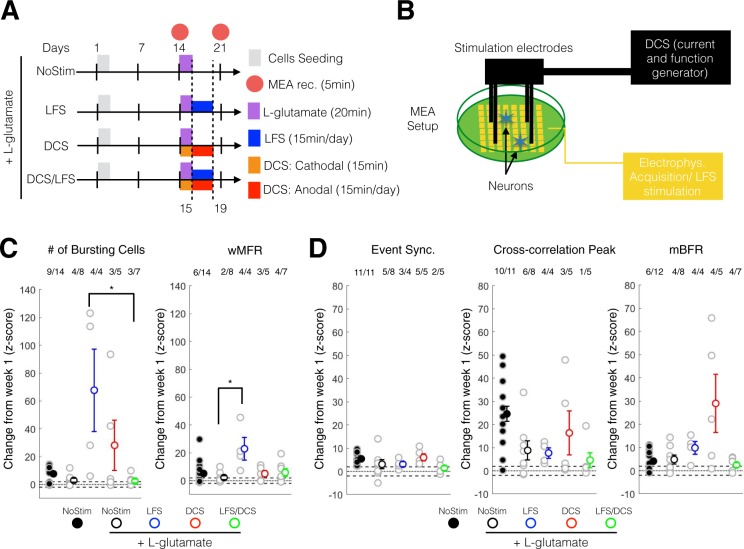
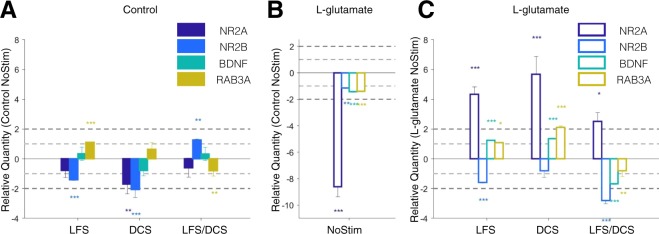
Functional electrical stimulation (FES) is rapidly gaining traction as a therapeutic tool for mediating the repair and recovery of the injured central nervous system (CNS). However, the underlying mechanisms and impact of these stimulation paradigms at a molecular, cellular and network level remain largely unknown. In this study, we used embryonic stem cell (ESC)-derived neuron and glial co-cultures to investigate network maturation following acute administration of L-glutamate, which is a known mediator of excitotoxicity following CNS injury. We then modulated network maturation using chronic low frequency stimulation (LFS) and direct current stimulation (DCS) protocols. We demonstrated that L-glutamate impaired the rate of maturation of ESC-derived neurons and glia immediately and over a week following acute treatment. The administration of chronic LFS and DCS protocols individually following L-glutamate infusion significantly promoted the excitability of neurons as well as network synchrony, while the combination of LFS/DCS did not. qRT-PCR analysis revealed that LFS and DCS alone significantly up-regulated the expression of excitability and plasticity-related transcripts encoding N-methyl-D-aspartate (NMDA) receptor subunit (NR2A), brain-derived neurotrophic factor (BDNF) and Ras-related protein (RAB3A). In contrast, the simultaneous administration of LFS/DCS down-regulated BDNF and RAB3A expression. Our results demonstrate that LFS and DCS stimulation can modulate network maturation excitability and synchrony following the acute administration of an inhibitory dose of L-glutamate, and upregulate NR2A, BDNF and RAB3A gene expression. Our study also provides a novel framework for investigating the effects of electrical stimulation on neuronal responses and network formation and repair after traumatic brain injury.


Conflict of interest statement

Dr. Stice has a financial interest in ArunA Biomedical Inc., a company that develops cell-free biologics for CNS therapies. All other authors declare no potential conflict of interest.

Figures

Figure 1
Figure 1
ESC-derived neurons and glia mimic the cellular composition of mature neural tissue. (A) ESC-derived neuronal population for the control condition (CTR, no treatment) at week 1 (top panels) and week 3 (bottom panels). Panels from left to right are DAPI, SOX-1 (Neural progenitor origin marker), βIII-Tubulin (Neuronal marker) and merged image representing all 3 fluorescent markers. Scale = 200 µm. (B) ESC-derived glial population for the control condition (CTR, no treatment) at week 1 (top panels) and week 3(bottom panels). Panels from left to right indicate DAPI, O4 (Oligodendrocyte marker), GFAP (Glial marker) and merged image representing all 3 fluorescent markers. Scale = 200 µm. (C) Neuronal cell density (#/mm2) estimated for the control condition (CTR) over week1 through week3. Quantification of the SOX-1 marker (Neural Stem Cell marker; left panel) and Beta-III tubulin (Neuronal marker; right panel). (D) Glial cell density (#/mm2) estimated for the control condition (CTR) over week1 through week3. Quantification of GFP marker (Differentiated motor neurons; left panel), O4 marker (Oligodendrocyte marker; middle panel) and GFAP (Astrocyte marker; right panel). Data is shown as scatter plot of individual plate quantifications and bar plot representing mean and s.e.m. * indicates p < 0.05, ** indicates p < 0.01 and *** indicates p < 0.001 using post-hoc multiple comparison with Holm-Sidak correction.
Figure 2
Figure 2
ESC-derived neurons and glia form functional neural network on MEA. (A) Experimental schedule for neural stem cell seeding and culture. For the control group, recordings were performed from week1 to week 3. (B) Representative micro-electrode array (MEA) recording setup. Schematic of the bottom of the well with 4 reference electrodes and 8 × 8 electrode array (left). Top left quadrant of a 64-channel MEA plate, 2 weeks after stem cells seeding (right; Scale = 100 μm). (C) Scatter distribution of the spike width (µsec; x-axis) against the peak-to-valley amplitude (µVolt; y-axis) for individual unit recorded from control condition at week 3. The distribution (cell count per bin) is displayed as a projection of each axis. The dashed black line represents the average of spike width (vertical) and peak-to-valley amplitude (horizontal). (D) Representative average spike wave forms obtained from 3 electrodes at week 3 from the control group. Data is shown as mean and s.e.m. (E) Raster plot of one well recorded at week 3 (top panel). The population instantaneous firing rate (left y-axis in green; wMFR, spikes/bin/electrode) and the percentage of active electrodes per bin (right y-axis, in red; active electrode in %). The vertical dashed and dotted lines indicate the start and stop of a detected population burst, respectively. (F) Heat map showing the evolution of the average activity in a control well from week 2 to week 3.
Figure 3
Figure 3
Temporal maturation of ESC network connectivity (A) Change in number of active electrodes quantified from week 1 through week 3 in control condition. (B) Change in Event Synchronization values from week 1 through week 3 in control condition. (C) Change in Cross-correlation Peak values from week 1 through week 3 in control condition. (D) Change in mean Network Bursting Rate values from week 1 through week 3 in control condition. (E) Change in mean Burst Duration values from week 1 through week 3 in control condition. Data is shown as scatter plots of individual well quantifications and error bars representing mean and s.e.m. * indicates p < 0.05, ** indicates p < 0.01 and *** indicates p < 0.001 using post-hoc multiple comparison with Holm-Sidak correction.
Figure 4
Figure 4
Acute L-glutamate treatment impaired network activity and synchrony immediately and over a week post-administration. (A) Experimental schedule for ESC-derived neuron seeding, culture and L-glutamate treatment. In the treatment group, 100 µM of L-glutamate was administered at day14 for 20 min then washed out. MEA recordings were performed from week 1 to week 3. (B) Scatter distribution of the mean burst firing rate (mBR; Burst event/min; x-axis) against the mean firing rate (mFR; log of spike/sec; y-axis) for individual unit recorded from CTR (black filled circles) and L-glut (black open circle) groups. Data is shown for week 2 (left panel) and week 3 (right panel). The normalized distribution CTR (black line) and L-glut (gray line) groups are displayed as a projection of each axis. The dashed black line represents the average for the CTR group. The dotted black line represents the average for the L-glut group. mFR: mean firing rate for individual electrodes; mBR: mean bursting rate for individual electrodes. (C) ESC-derived neurons after L-glutamate treatment (L-glut; 100 µM for 20 min at day 14) at week 2 (top panels) and week 3 (bottom panels). From left to right panels are shown SOX-1, βIII-Tubulin and merged image of both fluorescent markers. Scale = 200 μm. (D) Change at week 2 and week 3 (expressed as a Z-score from week1 baseline) of the number of bursting cells (left panel) and weighted mean firing rate (wMFR; right panel). For each group, the number of wells with significantly increasing change over the total number of wells recorded is shown above the scatter plot. wMFR: weighted mean population firing rate. (E) Change in network synchrony at week 2 and week 3 (expressed as a Z-score from week1 baseline) for event synchronization (left panel), cross-correlation peak (middle panel) and mean network burst firing rate (mBFR; right panel). For each group, the number of wells with significantly increasing change over the total number of wells recorded is shown above the scatter plot. For post-hoc two-sample test *, ** and *** indicate p < 0.05, p < 0.01 and p < 0.001, respectively. mBFR: mean population burst firing rate.
Figure 5
Figure 5
Evoked Network Response from different FES protocols. (A) Average wMFR as a percentage of the baseline (Pre) during the pre-stimulation, stimulation (Stim, marked by blue, red and blue/red colored bars for LFS, DCS and LFS/DCS, respectively) and post-stimulation (Post) period. The dashed dark lines indicates the start of the 15 min electrical stimulation. * indicate p < 0.05, ranksum between NoStim and Stimulation. (B) Representative trace showing the instantaneous wMFR (100 msec binning, stimulation duration 15 min) for the LFS condition (upper panel; pulse of 200 msec duration at 0.1 Hz, blue marks/bar) and a magnified representation of a 4 min section of activity (lower panel; marked with a black box in the upper panel); dashed gray line indicate the start of stimulation. (C) Average peri-stimulus histogram of the population activity (pulse duration: 200 msec) expressed as a z-score (baseline: 200 msec prior stimulation; Average of 90 pulses). Note: rebound activity following activity suppression by the stimulation.
Figure 6
Figure 6
DCS and LFS stimulation enhanced the maturation in excitability and neural synchrony following acute L-glutamate treatment. (A) Experimental schedule for ESC-derived neuron seeding, culture and treatment. L-glutamate (100 µM) was administered at day14 for 20 min then washed out. LFS was administered from day 15 to day 19 using 10 µA at 0.1 Hz, 15 min/day. DCS was administered in two phases: day14 a cathodal stimulation was performed for 15 min; from day 15 to day 19, anodal stimulation was administered for 15 min per day. Recording was performed on day 14 (week 2) and day 21 (week 3). (B) Schematic set up for electrical stimulation on MEA plate. LFS stimulation (10 µA, 0.1 Hz, 15 min/day) was delivered through the MEA electrode using the Maestro system. Four stainless screws were positioned above the MEA cultured neurons and were used to deliver a controlled current (DCS: single-time 10 µA monophonic cathodal 15 min and daily 10 µA monophonic anodal current, 15 min/day) using a custom battery-powered system. (C) Change at week 3 (expressed as a Z-score from week1 baseline) of the number of bursting cells (left panel) and wMFR (right panel). For post-hoc multiple comparison using Dunn-Sidak correction *, ** and *** indicate p < 0.05, p < 0.01 and p < 0.001, respectively. wMFR: weighted mean population firing rate. (D) Change at week 3 (expressed as a Z-score from week1 baseline) of the event synchronization (left panel), cross-correlation peak (middle panel) and mBFR (right panel). For post-hoc multiple comparison using Dunn-Sidak correction *, ** and *** indicate p < 0.05, p < 0.01 and p < 0.001, respectively. mBFR: mean population burst firing rate.
Figure 7
Figure 7
DCS and LFS stimulation alters the expression profile of NR2A, NR2B, BDNF and RAB3A. (A) Relative quantity (RQ to Control NoStim) of gene expression change in response to LFS, DCS and LFS/DCS stimulation without toxicity at week 3. (B) Relative quantity (RQ to Control NoStim) of gene expression change following L-glutamate toxicity at week 3 (L-glutamate NoStim). (C) Relative quantity (RQ to L-glutamate NoStim) for gene expression change for LFS, DCS and LFS/DCS stimulation following L-glutamate toxicity at week 3. Data is shown as mean +/−SEM. *, ** and *** indicate p < 0.05, p < 0.01 and p < 0.001, respectively, on two-sample student t-test between test and control samples (n = 6 repeats per group). Light and dark gray dashed lines mark 1- and 2 fold change in expression. Bar plots in order from left to right represent NR2A: NMDA receptor sub unit 2A, NR2B: NMDA receptor sub unit 2B, BDNF: brain-derived neurotrophic factor, RAB3A: RAS-related protein rab3.

References

    1. Brunoni AR, et al. Clinical research with transcranial direct current stimulation (tDCS): challenges and future directions. Brain Stimul. 2012;5:175–195. doi: 10.1016/j.brs.2011.03.002. - DOI - PMC - PubMed
    1. Poreisz C, Boros K, Antal A, Paulus W. Safety aspects of transcranial direct current stimulation concerning healthy subjects and patients. Brain Res Bull. 2007;72:208–214. doi: 10.1016/j.brainresbull.2007.01.004. - DOI - PubMed
    1. Lefaucheur JP, et al. The use of repetitive transcranial magnetic stimulation (rTMS) and transcranial direct current stimulation (tDCS) to relieve pain. Brain Stimul. 2008;1:337–344. doi: 10.1016/j.brs.2008.07.003. - DOI - PubMed
    1. Lefaucheur JP, et al. Evidence-based guidelines on the therapeutic use of transcranial direct current stimulation (tDCS) Clin Neurophysiol. 2017;128:56–92. doi: 10.1016/j.clinph.2016.10.087. - DOI - PubMed
    1. Boggio PS, et al. A randomized, double-blind clinical trial on the efficacy of cortical direct current stimulation for the treatment of major depression. Int J Neuropsychopharmacol. 2008;11:249–254. doi: 10.1017/S1461145707007833. - DOI - PMC - PubMed

Publication types

Substances