

Review
doi: 10.1038/s41467-018-05293-3.
Controls on explosive-effusive volcanic eruption styles
Affiliations
- PMID: 30026543
- PMCID: PMC6053376
- DOI: 10.1038/s41467-018-05293-3
Item in Clipboard
Review
Controls on explosive-effusive volcanic eruption styles
Nat Commun.
.
Abstract
One of the biggest challenges in volcanic hazard assessment is to understand how and why eruptive style changes within the same eruptive period or even from one eruption to the next at a given volcano. This review evaluates the competing processes that lead to explosive and effusive eruptions of silicic magmas. Eruptive style depends on a set of feedback involving interrelated magmatic properties and processes. Foremost of these are magma viscosity, gas loss and external properties such as conduit geometry. Ultimately, these parameters control the speed at which magmas ascend, decompress and outgas en route to the surface, and thus determine eruptive style and evolution.
Figures
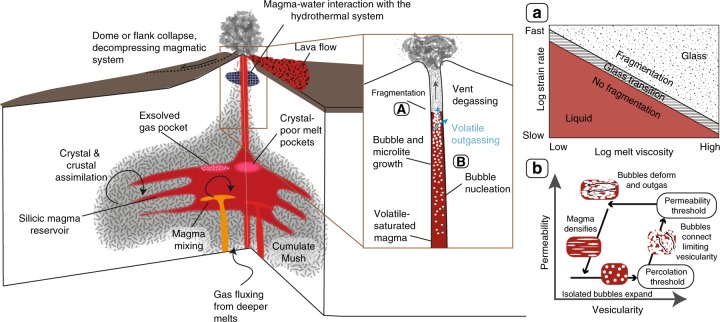
Annotated volcano schematic, illustrating the range of processes that can affect eruptive style from storage to surface, prior to or during volcanic eruptions. a Shows how fragmentation is a function of the melt viscosity and strain rate. Fast strain rates (i.e., high decompression rates) favour brittle fragmentation as it passes the glass transition for a given viscosity. At slow strain rates, magma generally behaves as a liquid. Figure adapted from Gonnermann and Manga. b Shows the cycle of volatile outgassing, from nucleation, coalescence to densification from permeability and porosity data in Rust and Cashman, figure reproduced from Cashman and Sparks, under fair usage terms
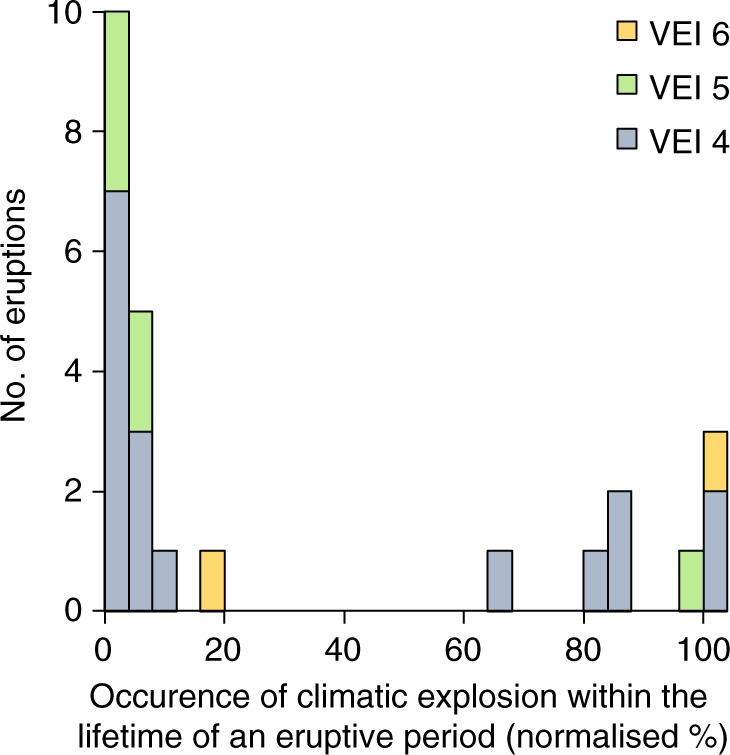
Graph of known eruptive time periods with both climactic explosions (VEI ≥ 4) and dome growth (including crypto-domes) from the Domehaz database. All eruptive time periods (which includes smaller explosions, dome extrusion) have been normalized. Two-thirds of the climactic eruptions occur at the start of their eruptive period (first quarter), irrespective of VEI. However, ~1/3 of climactic eruptions occur in the latter half of an eruptive cycle
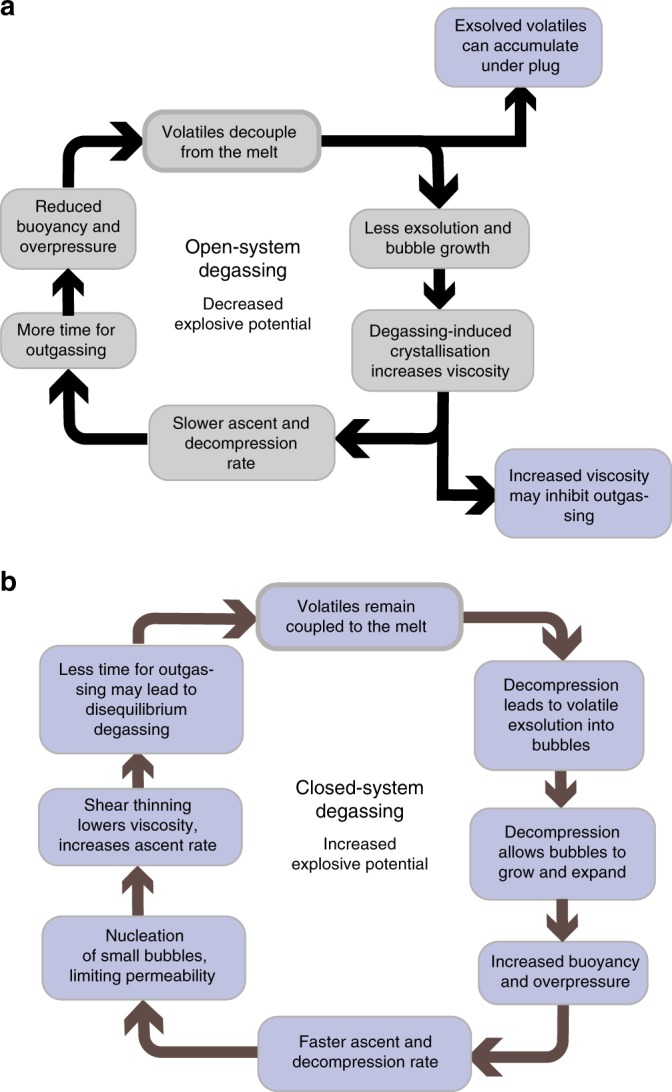
Open- and closed-system degassing feedbacks have a strong control magma ascent and eruptive style. a For open-system degassing, the release of volatiles will decrease the buoyancy and overpressure of the magma, leading to slower ascent and allowing more time for equilibrium degassing and outgassing. Crystallization and viscosity increase enhance this positive feedback and left unchecked, this will normally lead to slow decompression rate, thus diminishing the likelihood of overpressure building up and leading to effusive eruptions,,. However, negative feedbacks can also occur (purple boxes in a), to counteract the loss of volatiles which may lead to more explosive eruptions. b The added buoyancy from volatile exsolution and bubble expansion will drive faster ascent, making outgassing less efficient–, which may lead to disequilibrium degassing. This positive feedback is further enhanced by nucleation of small bubbles, which may limit bubble coalescence. In addition, for more silicic magmas or when decompression rates are high enough, decompression-induced crystallization will be suppressed. This may have two effects, first it keeps the viscosity low to enable faster ascent and second, it provides less bubble nucleation sites and thus less potential for outgassing. For some non-Newtonian magmas excess deformation of leads to shear thinning behaviour, decreasing viscosity and thus further increasing ascent rate. These feedbacks promote more explosive behaviour
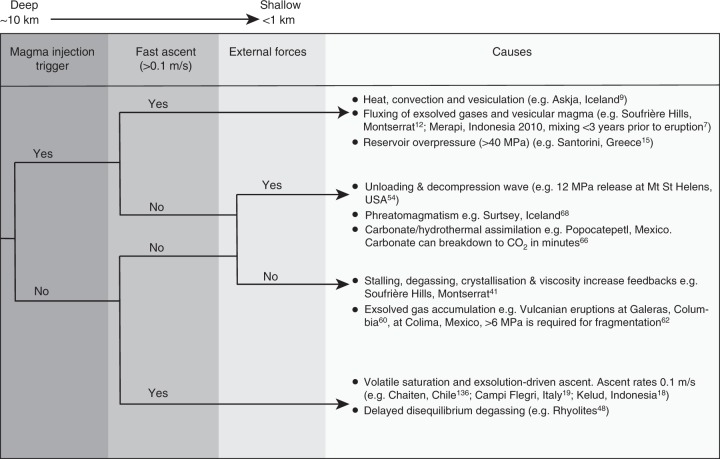
Event tree diagram showing the different processes/conditions that may lead to explosive eruptions. Slow ascent scenarios often involve transitions between explosive and effusive activity. Speed of ascent may fluctuate during an eruptive phase, this diagram refers to the average ascent rate from storage to the surface
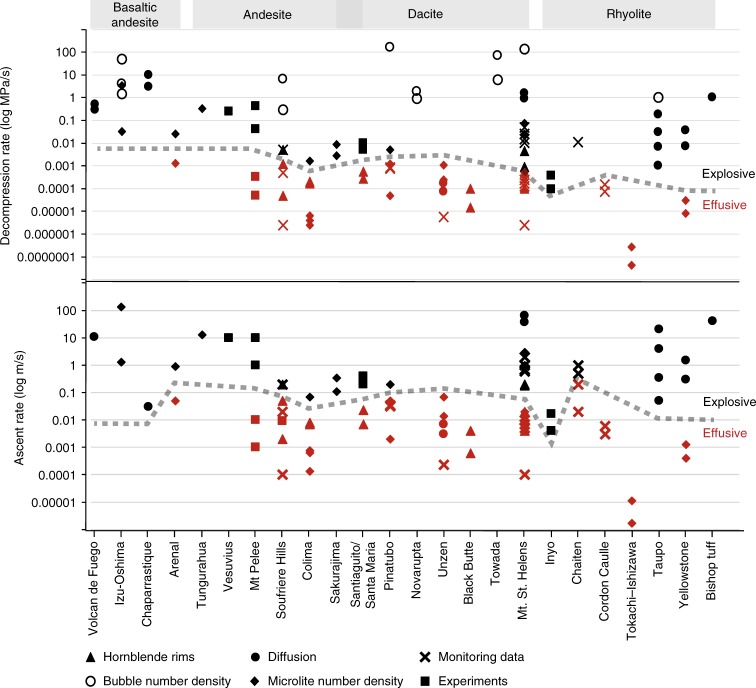
Comparison of all syn-eruptive ascent rates estimates, from multiple volcanoes ranging from basaltic andesite to rhyolites (Supplementary data 1). This plot collects ascent and decompression rate data from a range of different techniques, including microlite crystallinity, bubble number density, experiments, hornblende rims, seismicity, extrusion rate and diffusion rates. Where decompression rates were not given, these were calculated from the ascent rates using an assumed lithostatic pressure gradient of 0.025 MPa/m. Magma ascent and decompression rates are from the following sources, from left to right: Volcan de Fuego, Guatemala; Izu-Oshima, Japan,; Chaparrastique volcano, El Salvador; Arenal, Costa Rica; Tungurahua, Ecuador; Vesuvius, Italy; Mt Pelee, Martinique; Soufriere Hills, Montserrat–; Colima, Mexico,; Sakurajima, Japan; Santiaguito/Santa Maria, Guatemala,; Pinatubo, Philippines,,; Novarupta, USA; Unzen, Japan–; Black Butte, USA; Towada, Japan; Mt St Helens, USA,–; Inyo domes, USA; Chaiten, Chile,; Cordon Caulle, Chile; Tokachi–Ishizawa, Japan; Taupo, New Zealand–; Yellowstone, USA,; and Bishop tuff, USA
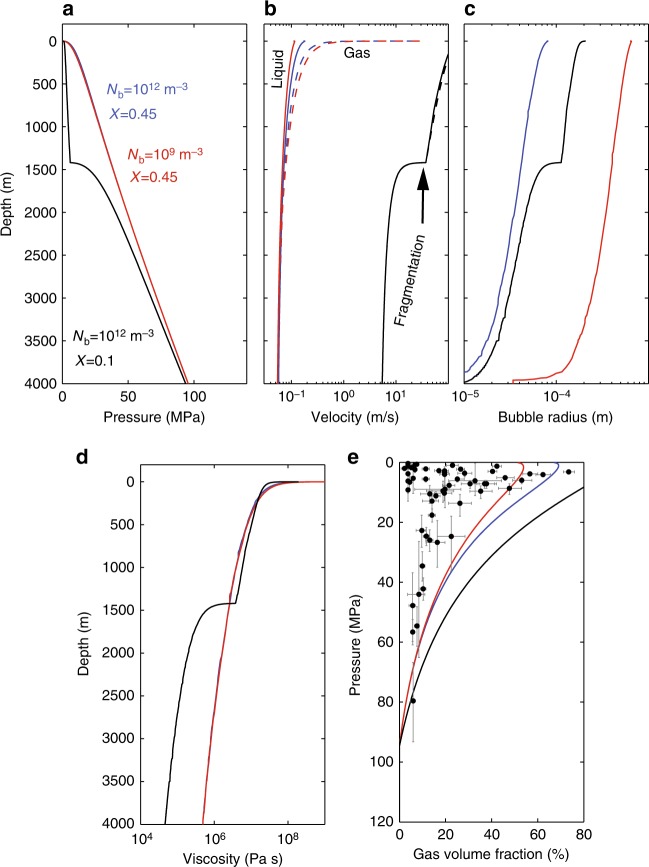
Comparing the properties during ascent of hydrous leucogranite with different bubble number densities (Nb) and crystal contents (X). The model simulates magma ascent and gas escape, computed using the steady one-dimensional model of Degruyter et al., showing how a pressure, b melt (solid curves) and gas (dashed curves) velocities, c bubble radius and d magma viscosity evolve during ascent; e shows how vesicularity varies with pressure. Also, included vesicularity and the inferred pre-eruptive depth of clasts evacuated from the conduit during the 1997 Vulcanian eruptions at Soufrière Hills Volcano, Montserrat,. These samples are thought to capture conditions during ascent for the dome-forming eruptions. Errors bars from Burgisser et al. account for uncertainty in measured water content (pressure) and vesicularity. Note that the volume fraction of exsolved gas in the clasts is lower than expected when gas is allowed to escape from the rising magma. The effect of crystal fraction on viscosity is based on the model of Costa and the melt viscosity model is that of Hess and Dingwell. Fragmentation occurs at a gas volume fraction of 85%. In the model, crystals do not grow, and Nb does not change during ascent. Homogeneous bubble nucleation and equilibrium degassing are assumed. Volatile content at depth is 4 weight %. Temperature is 886 °C. The percolation threshold for gas flow through the magma is zero, tortuosity factor is 3, bubble throat to radius ratio is 1, and the friction coefficient for gas flow through the magma is 10, values as used in Degruyter et al.
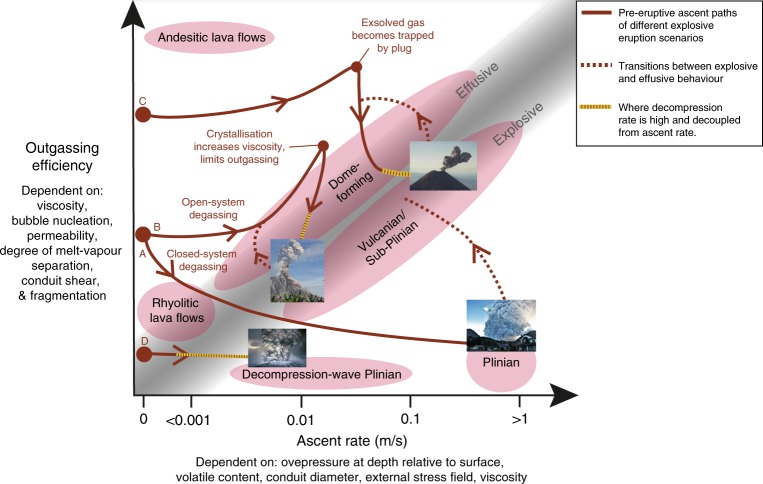
Schematic plot, where an diffuse threshold distinguishes effusive from explosive eruptions. Points a–d represent different eruptive scenarios: a = Ascent controlled (bottom-up), b = Viscosity controlled, c = Exsolved gas accumulation and plug controlled, and d = Decompression-wave controlled. The red lines are pre-eruptive ascent paths and do not represent transitions between effusive and explosive behaviour, where the eruption photo represents a magma reaching the surface. The starting position on the outgassing efficiency axis depends on the magma rheology (composition and crystallinity) and permeability. Note that this figure is schematic, the ascent rates are based on Fig. 3 (syn-eruptive averages). However, currently no data exists on how ascent and decompression rates evolve during transit from storage to surface. In addition, due to the complex and variable nature of magmatic outgassing, and how this changes with crystallization, viscosity and bubble nucleation during ascent, data on this parameter are currently lacking. Nevertheless, quantifying these parameters during the magma’s transit from storage to surface in the future, may prove crucial for understanding the controls on eruptive style and where in the crust these controls are most important. Eruption photos in this figure are sourced from Chaiten in 2008 (Daniel Basualto), Soufrière Hills, 1997, Volcan de Colima (Mike Cassidy) and Mt St. Helens in 1980
References
-
- Brown, S. K., Jenkins, S. F., Sparks, R. S. J., Odbert, H. & Auker, M. R. Volcanic fatalities database: analysis of volcanic threat with distance and victim classification. J. Appl. Volcanol. 6, 15 (2017).
-
- Cionia R, Bertagnini A, Santacroce R, Andronico D. Explosive activity and eruption scenarios at Somma-Vesuvius (Italy): towards a new classification scheme. J. Volcanol. Geotherm. Res. 2008;178:331–346. doi: 10.1016/j.jvolgeores.2008.04.024. - DOI
-
- Venzke, E. (Ed). Global Volcanism Program | Volcanoes of the World (VOTW) Database Information v. 4.6.6 (Smithsonian Institution, Washington, DC, 2013). Available at: http://volcano.si.edu/gvp_votw.cfm.
-
- National Academies of Sciences, E. and M. Volcanic Eruptions and Their Repose, Unrest, Precursors, and Timing (National Academies Press, Washington, DC, 2017). 10.17226/24650.
-
- Cashman KV, Stephen R, Sparks J. How volcanoes work: a 25 year perspective. Bull. Geol. Soc. Am. 2013;125:664–690. doi: 10.1130/B30720.1. - DOI
Publication types
Grants and funding
- NE/N014286/1/Natural Environment Research Council (NERC)/International
- NSF-1521855 Hazard SEES/National Science Foundation (NSF)/International
- Royal Society Wolfson Merit Award/Royal Society/International
- 200021_178928/Schweizerischer Nationalfonds zur Förderung der Wissenschaftlichen Forschung (Swiss National Science Foundation)/International
LinkOut - more resources
Full Text Sources
Other Literature Sources
Research Materials
