. 2019 Jan;33(1):205-216.
doi: 10.1038/s41375-018-0203-0. Epub 2018 Jul 19.

Heterogeneous expression of cytokines accounts for clinical diversity and refines prognostication in CMML

Affiliations

Heterogeneous expression of cytokines accounts for clinical diversity and refines prognostication in CMML

Sandrine Niyongere et al. Leukemia. 2019 Jan.

Abstract

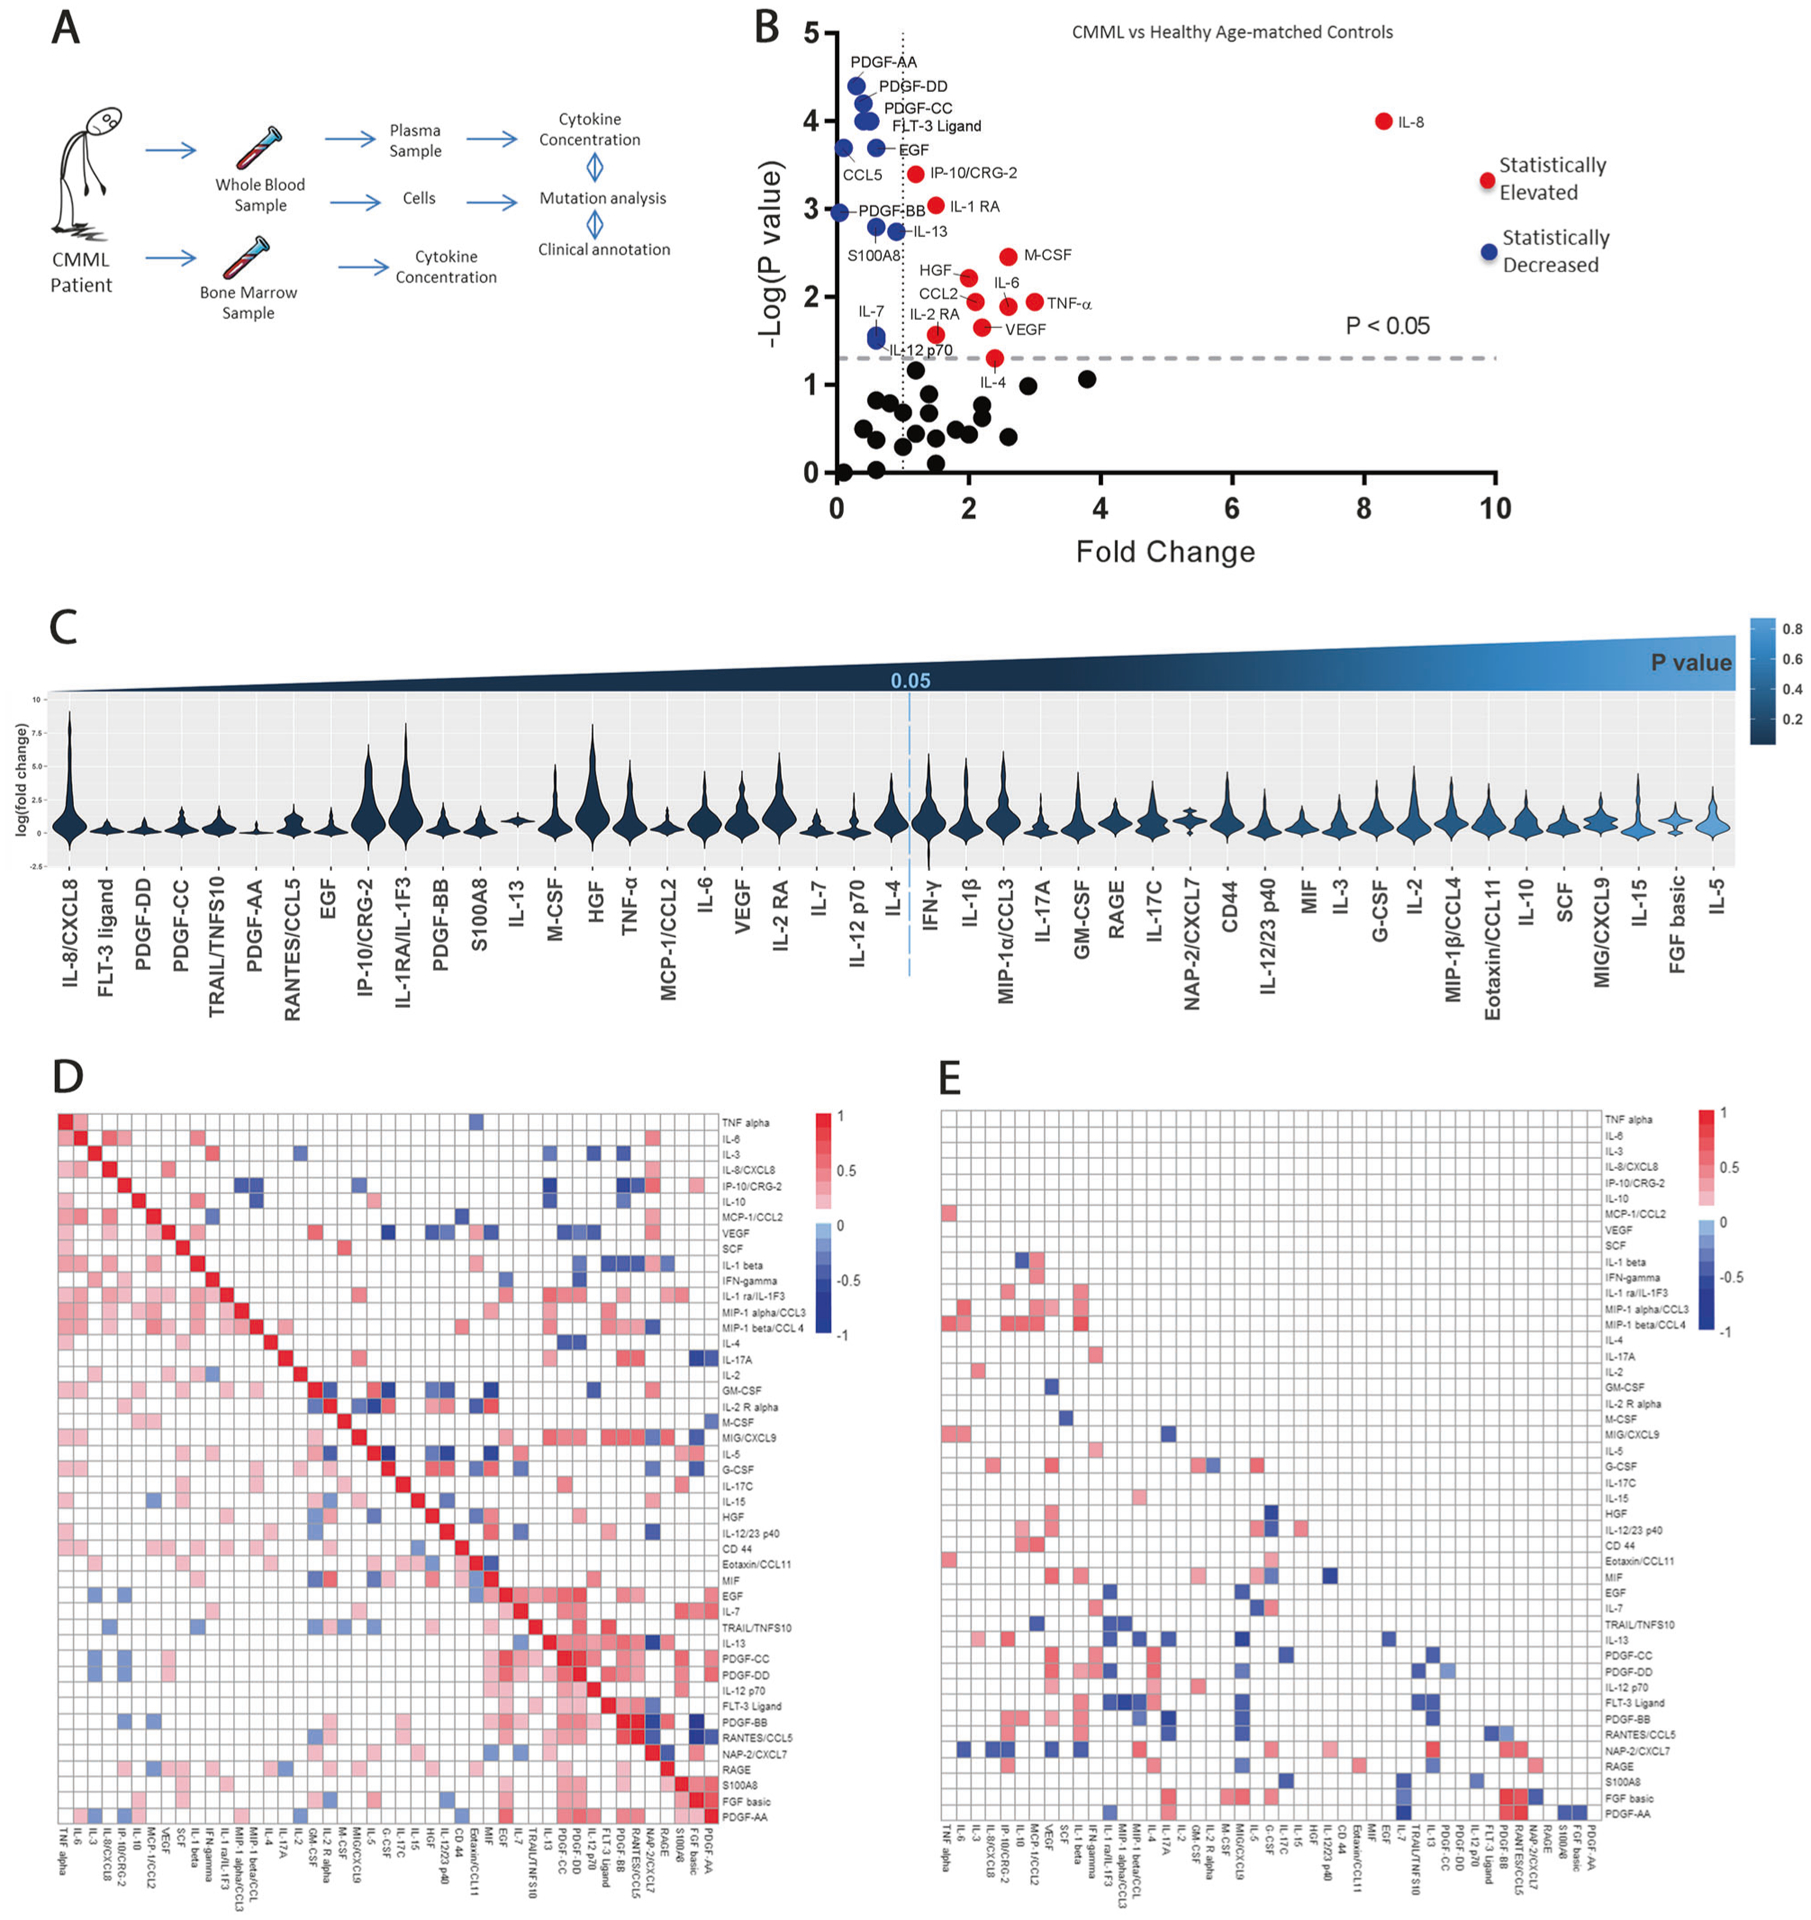
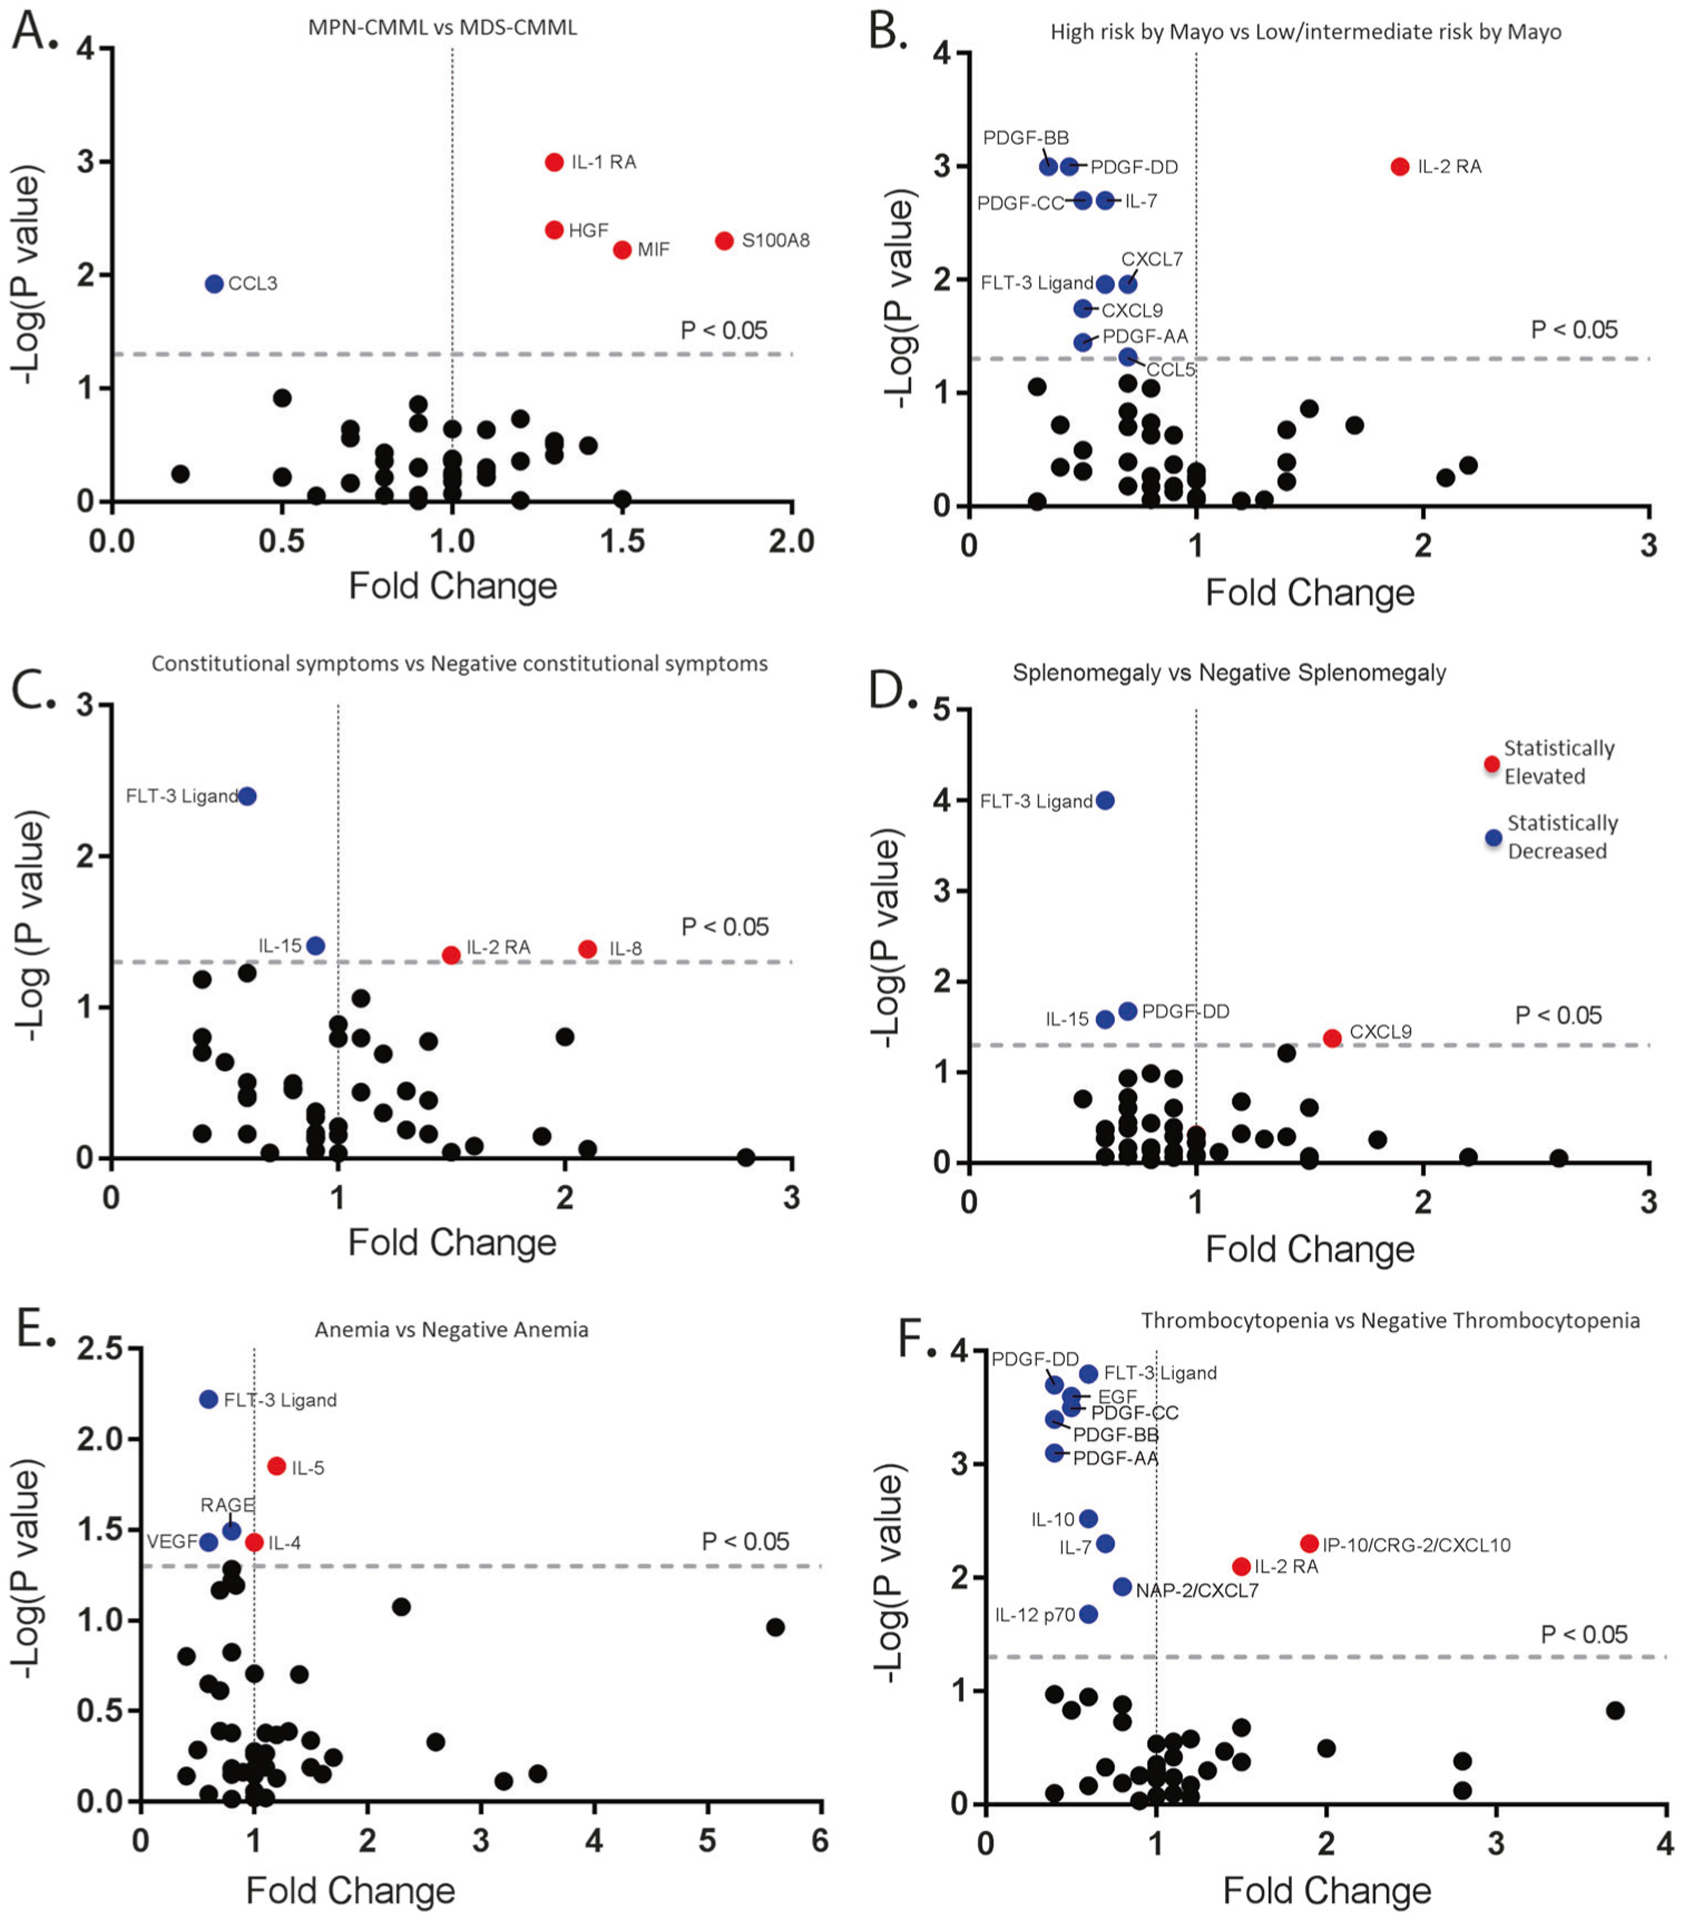
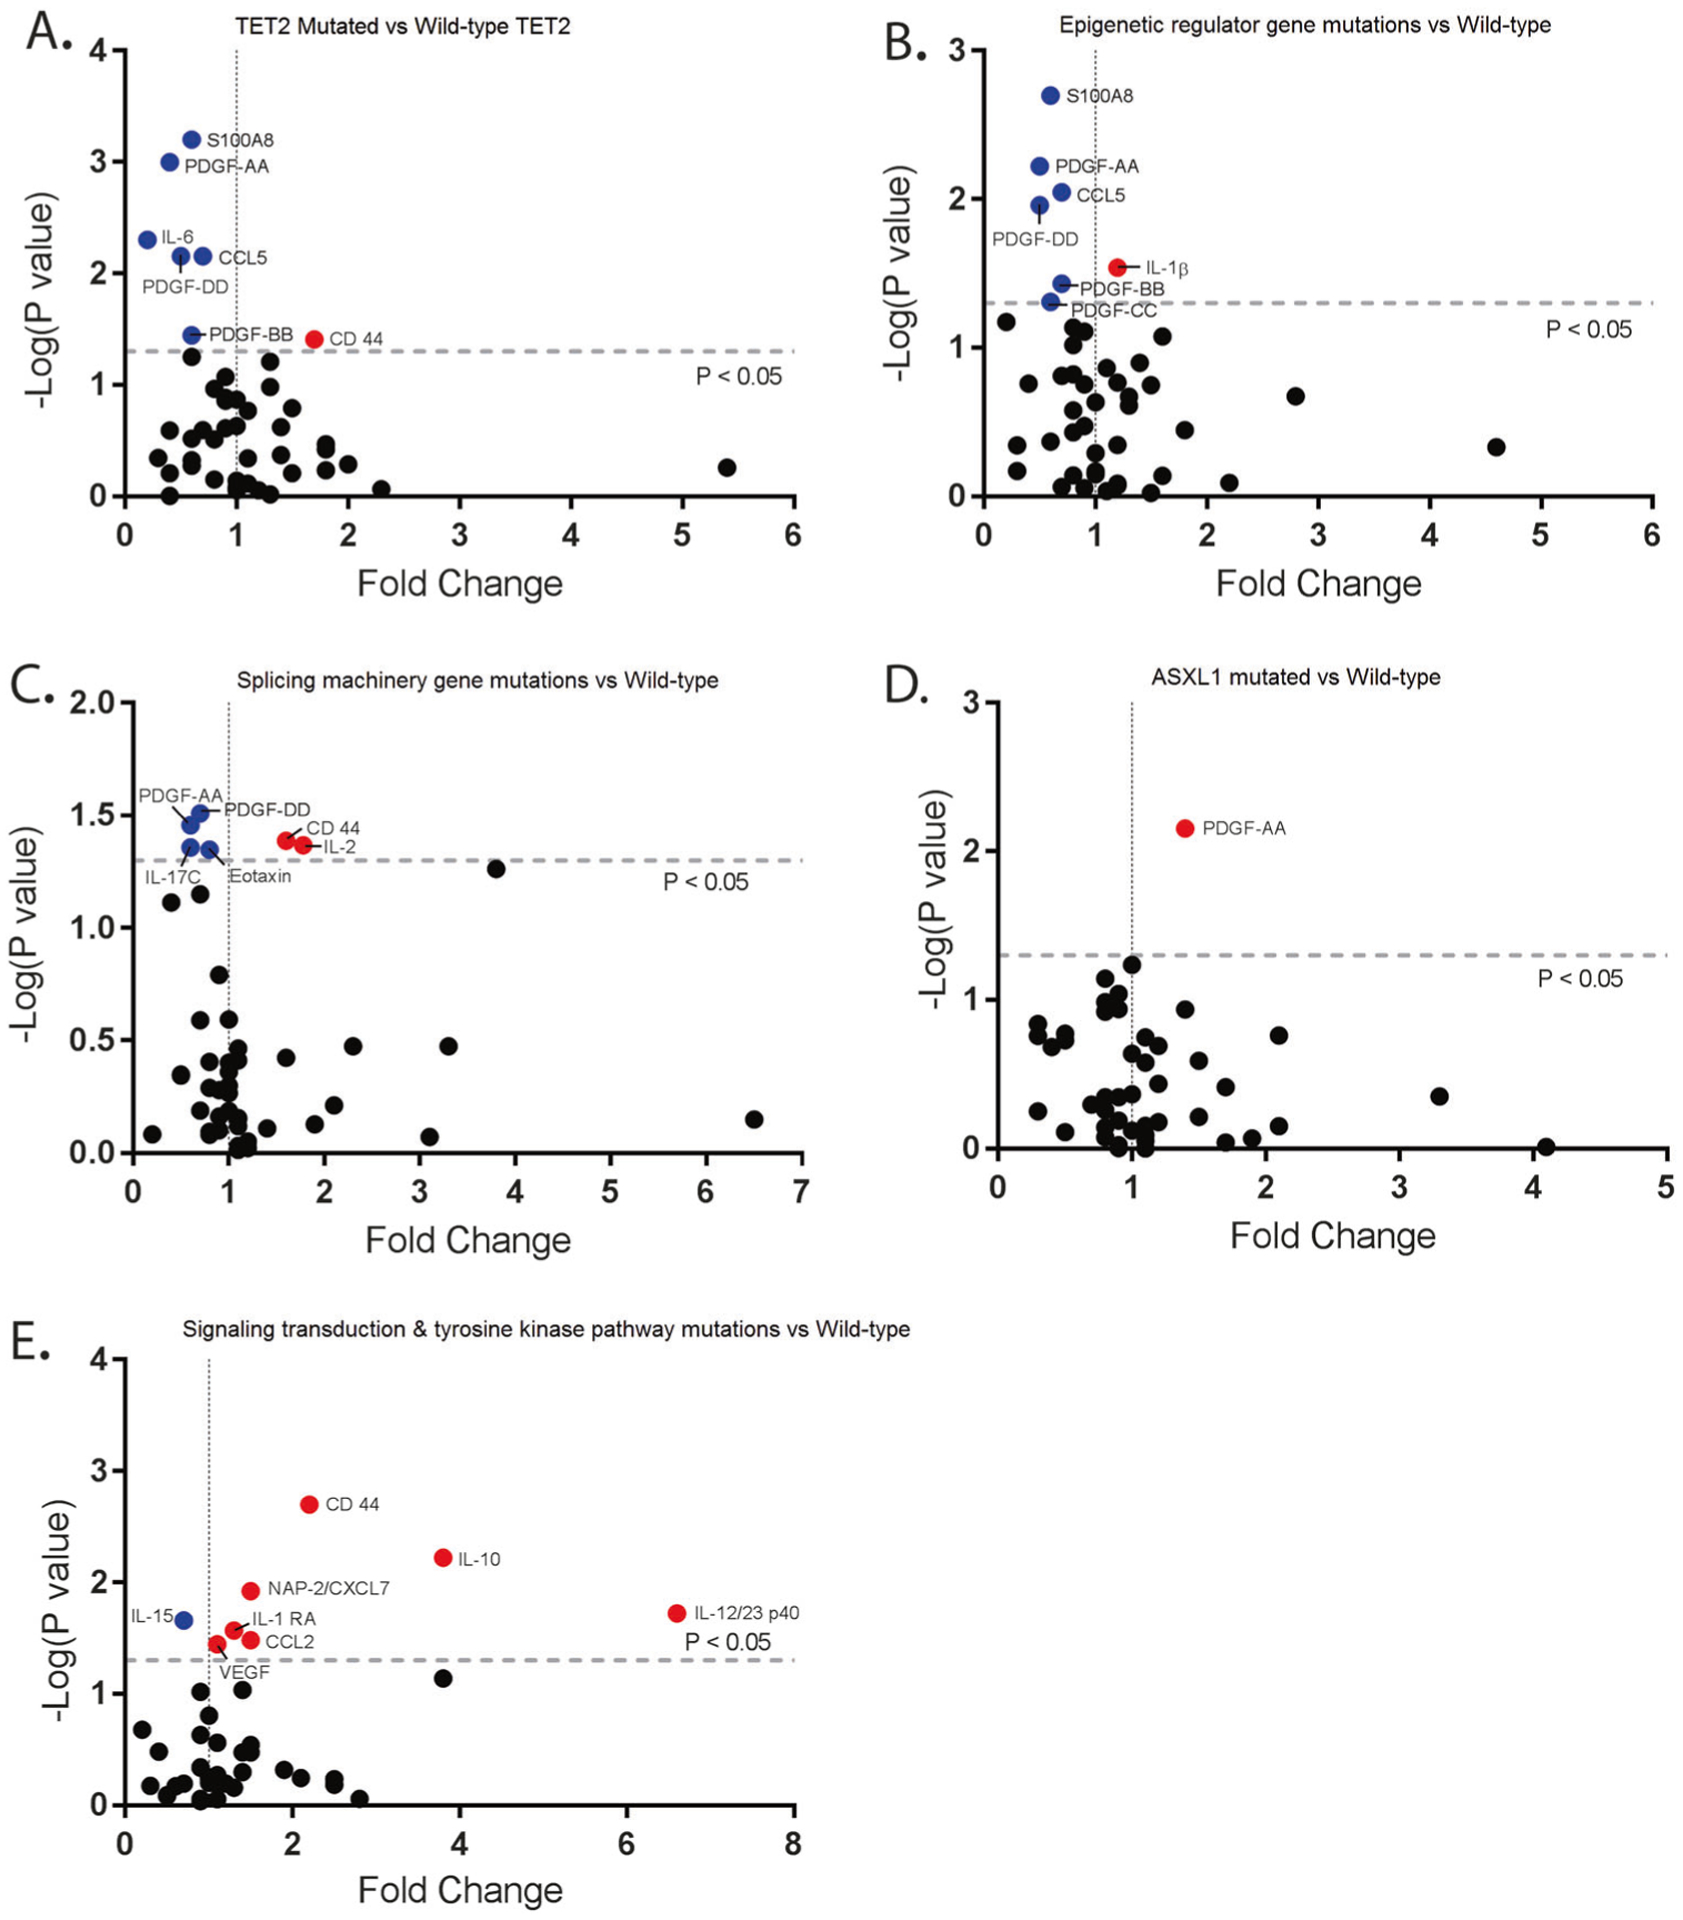
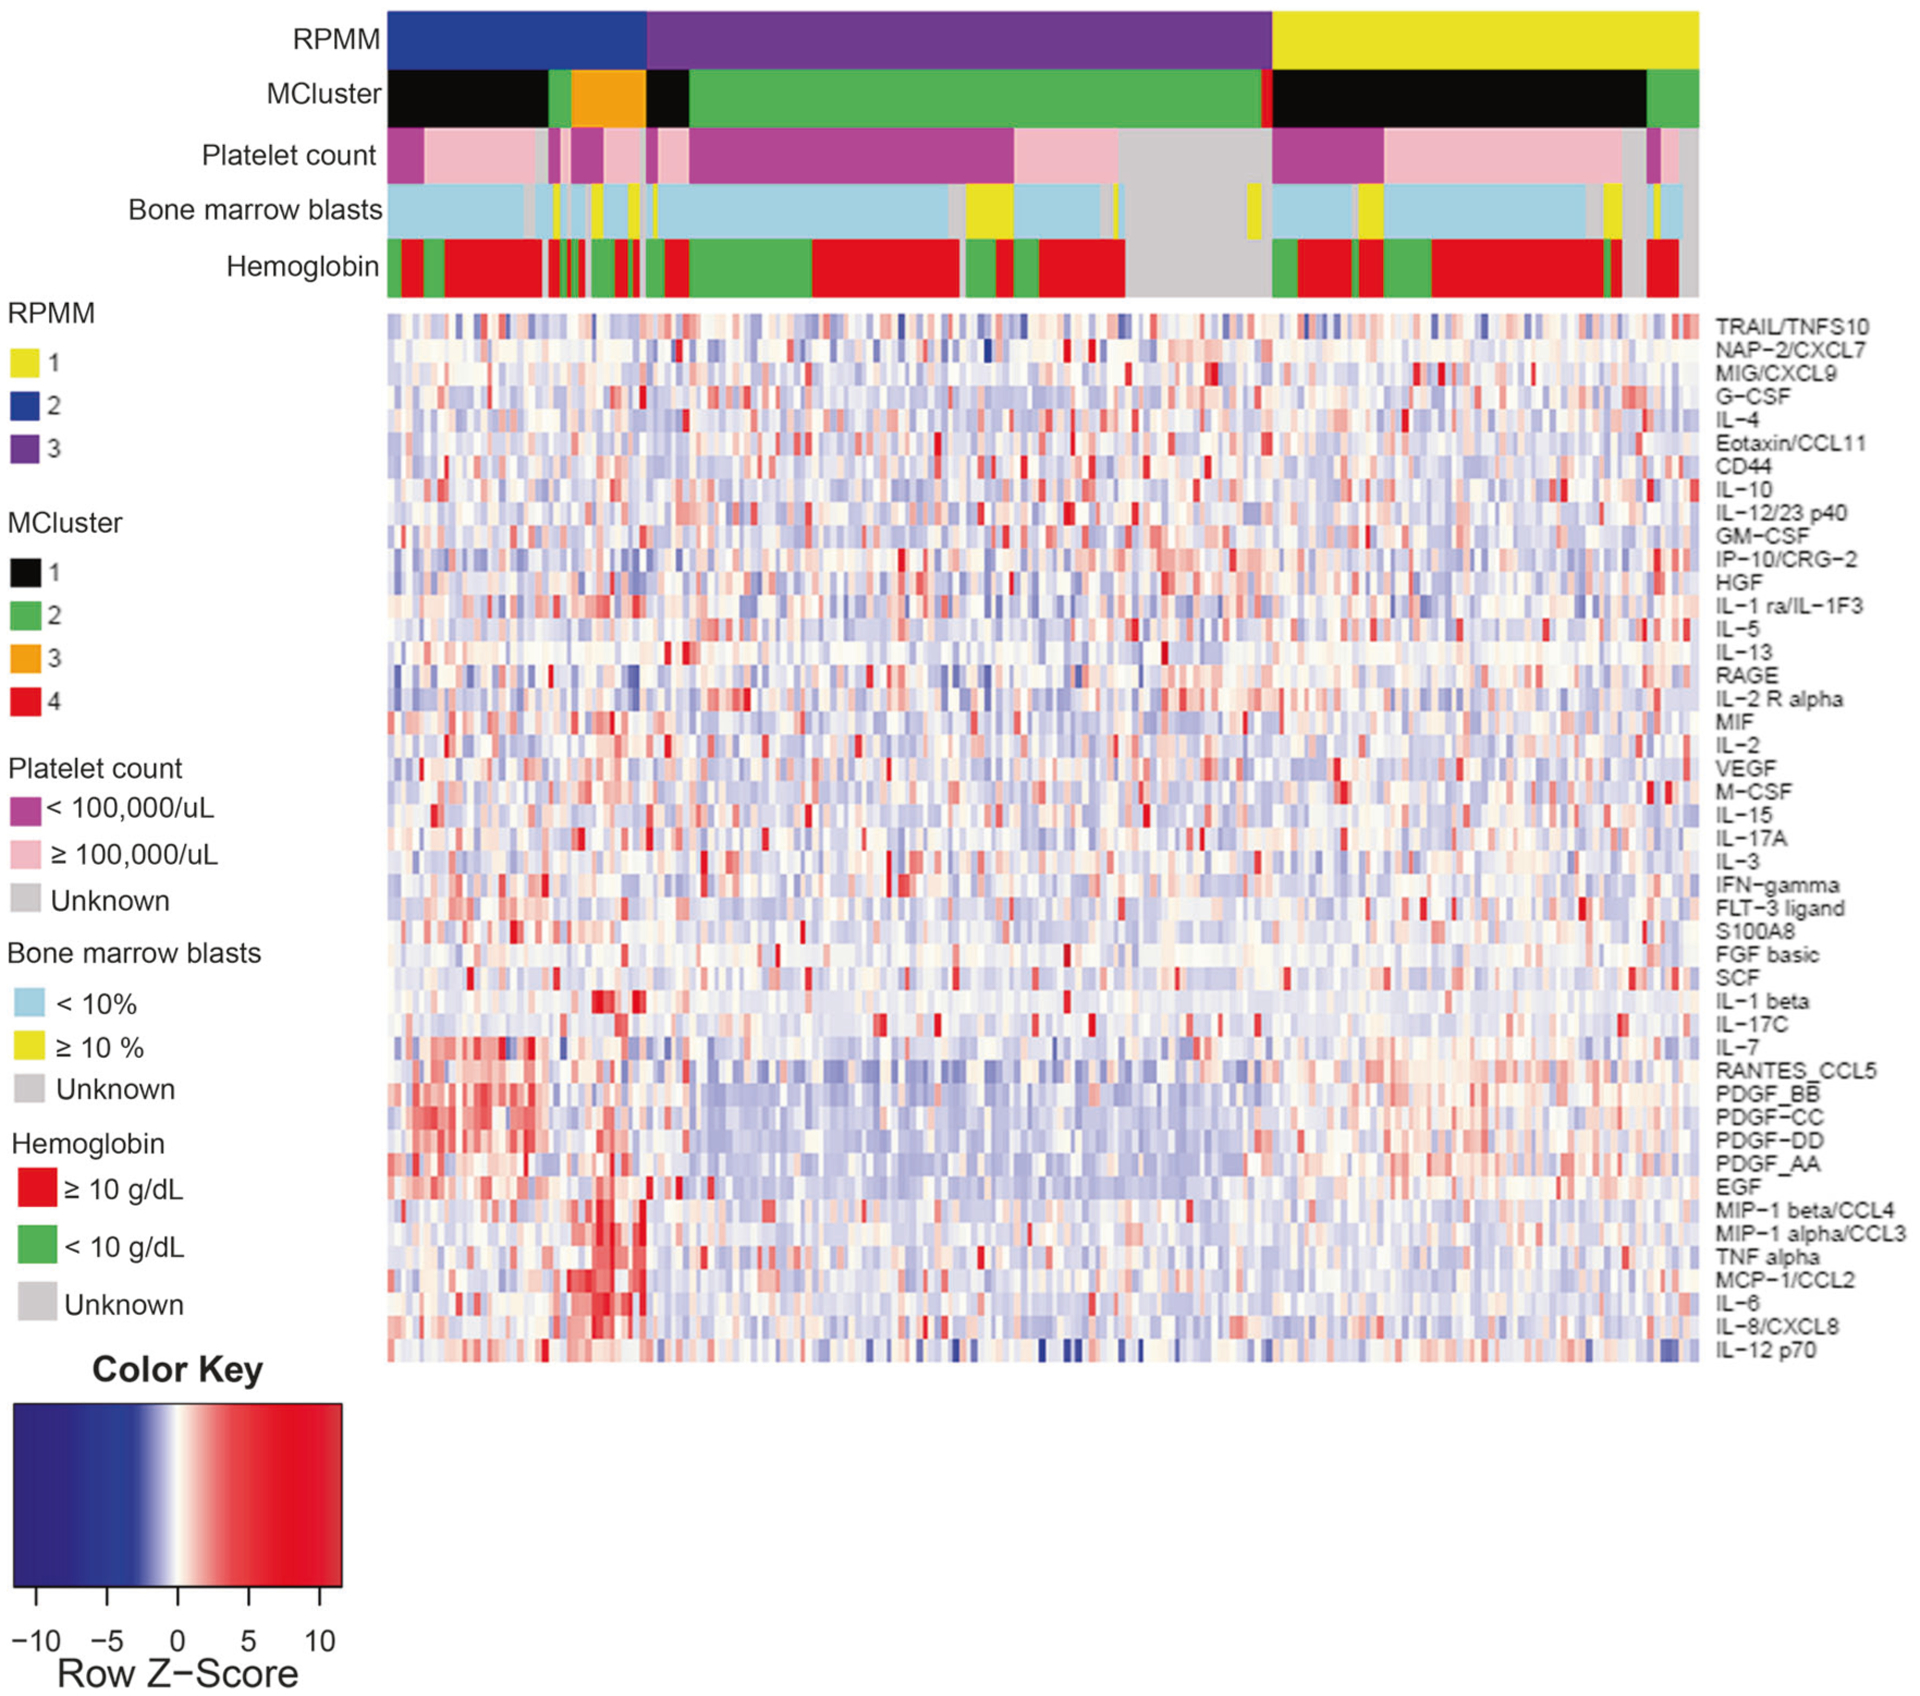
Chronic myelomonocytic leukemia (CMML) is a clinically heterogeneous neoplasm in which JAK2 inhibition has demonstrated reductions in inflammatory cytokines and promising clinical activity. We hypothesize that annotation of inflammatory cytokines may uncover mutation-independent cytokine subsets associated with novel CMML prognostic features. A Luminex cytokine profiling assay was utilized to profile cryopreserved peripheral blood plasma from 215 CMML cases from three academic centers, along with center-specific, age-matched plasma controls. Significant differences were observed between CMML patients and healthy controls in 23 out of 45 cytokines including increased cytokine levels in IL-8, IP-10, IL-1RA, TNF-α, IL-6, MCP-1/CCL2, hepatocyte growth factor (HGF), M-CSF, VEGF, IL-4, and IL-2RA. Cytokine associations were identified with clinical and genetic features, and Euclidian cluster analysis identified three distinct cluster groups associated with important clinical and genetic features in CMML. CMML patients with decreased IL-10 expression had a poor overall survival when compared to CMML patients with elevated expression of IL-10 (P = 0.017), even when adjusted for ASXL1 mutation and other prognostic features. Incorporating IL-10 with the Mayo Molecular Model statistically improved the prognostic ability of the model. These established cytokines, such as IL-10, as prognostically relevant and represent the first comprehensive study exploring the clinical implications of the CMML inflammatory state.


Conflict of interest statement

Conflict of interest The authors declare that they have no conflict of interest.

Figures

Fig. 1
Fig. 1
Inflammatory cytokines are heterogeneously expressed in CMML patients. a Study design. b Significant differences observed in measured inflammatory cytokines in patients with CMML compared to healthy aged-matched controls. Y-axis is negative log(P-value). X-axis is fold change of CMML compared to healthy aged-matched controls. c Violin plot displaying the variable distribution of cytokine expression for each cytokine in CMML patients. On the y-axis is the log of the fold change for CMML patients. On the x-axis is each of the 45 cytokines evaluated. Cytokines to left of vertical dotted line were statistically significant when comparing expression in CMML patients to normal controls (P < 0.05). d Pearson correlation displaying cytokine–cytokine interaction in 45 cytokines measured in CMML patients. Top figure displays positive and negative cytokine interactions in normal patients and bottom section of figure displays cytokine interactions in CMML patients. Blue notes negative R coefficient correlation while red notes positive R coefficient correlation. e The difference of correlation between CMML patients and normal patients. The colored squares represent all statistically significant interactions. The more blue present in the square denotes more negative R coefficient correlation between two cytokines while the more red in the square denotes more positive R coefficient correlation. Interactions between cytokines that were not statistically significant are shaded white
Fig. 2
Fig. 2
Cytokine–phenotype associations in CMML. a Cytokine expression in patients with MPN-CMML compared to patients categorized in MDS-CMML. Y-axis is negative log(P-value). X-axis is the calculated fold change from the mean of the batch-adjusted cytokine levels normalized to healthy controls. b Cytokine expression in patients with high-risk CMML by Mayo Prognostic Model compared to patients categorized to low-risk CMML by Mayo Prognostic Model. c Cytokine expression in CMML patients with constitutional symptoms compared to CMML patients without constitutional symptoms. d Cytokine expression in CMML patients with splenomegaly compared to CMML patients without the presence of splenomegaly. e Cytokine expression in CMML patients with hemoglobin <10 g/dL compared to CMML patients with hemoglobin >10 g/dL. f Cytokine expression in CMML patients with platelet count <100,000/μL compared to CMML patients with platelet count >100,000/μL
Fig. 3
Fig. 3
Cytokine genotype associations in CMML. a Cytokine expression in patients in CMML patients with the TET2 mutations compared to CMML patients without TET2 mutations. Y-axis is negative log (P-value). X-axis is the calculated fold change from the mean of the batch-adjusted cytokine levels normalized to healthy controls. b Cytokine expression in patients in CMML patients with the mutations in epigenetic regular genes compared to CMML patients without those mutations. c Cytokine expression in patients in CMML patients with mutations involving splicing machinery compared to CMML patients without those mutations. d Cytokine expression in patients in CMML patients with ASXL1 mutations compared to CMML patients without ASXL1 mutations. e Cytokine expression in patients in CMML patients with mutations involving signal transduction and tyrosine kinase pathway compared to CMML patients without those mutations
Fig. 4
Fig. 4
Unsupervised cluster analysis identifies three groups driven by cytokine signatures. Heatmap of batch-adjusted cytokine levels with cluster assignments denoted on the legend based on either RPMM (3 clusters) or Gaussian mixed-model clustering (4 clusters) when cytokine expression was analyzed in CMML patients (N = 213)

References

    1. Arber DA, Orazi A, Hasserjian R, Thiele J, Borowitz MJ, Le Beau MM, et al. The2016 revision to the World Health Organization classification of myeloid neoplasms and acute leukemia. Blood. 2016;127:2391–405. - PubMed
    1. Bennett JM, Catovsky D, Daniel MT, Flandrin G, Galton DA, Gralnick HR, et al. Proposals for the classification of the acute leukaemias. French-American-British (FAB) co-operative group. Br J Haematol. 1976;33:451–8. - PubMed
    1. Elena C, Galli A, Such E, Meggendorfer M, Germing U, Rizzo E, et al. Integrating clinical features and genetic lesions in the risk assessment of patients with chronic myelomonocytic leukemia. Blood. 2016;128:1408–17. - PMC - PubMed
    1. Ball M, List AF, Padron E. When clinical heterogeneity exceeds genetic heterogeneity: thinking outside the genomic box in chronic myelomonocytic leukemia. Blood. 2016;128:2381–7. - PubMed
    1. Merlevede J, Droin N, Qin T, Meldi K, Yoshida K, Morabito M, et al. Mutation allele burden remains unchanged in chronic myelomonocytic leukaemia responding to hypomethylating agents. Nat Commun. 2016;7:10767. - PMC - PubMed

Publication types