. 2017 Oct;212(1-2):523-551.
doi: 10.1007/s11214-017-0330-3. Epub 2017 Apr 3.

Thermosphere-Ionosphere-Electrodynamics General Circulation Model for the Ionospheric Connection Explorer: TIEGCM-ICON

Thermosphere-Ionosphere-Electrodynamics General Circulation Model for the Ionospheric Connection Explorer: TIEGCM-ICON

Astrid Maute. Space Sci Rev. 2017 Oct.

Abstract

The NASA Ionospheric Connection explorer (ICON) will study the coupling between the thermosphere and ionosphere at low- and mid-latitudes by measuring the key parameters. The ICON mission will also employ numerical modeling to support the interpretation of the observations, and examine the importance of different vertical coupling mechanisms by conducting numerical experiments. One of these models is the Thermosphere-Ionosphere-Electrodynamics General Circulation Model-ICON (TIEGCM-ICON) which will be driven by tidal perturbations derived from ICON observations using the Hough Mode Extension method (HME) and at high latitude by ion convection and auroral particle precipitation patterns from the Assimilative Mapping of Ionospheric Electrodynamics (AMIE). The TIEGCM-ICON will simulate the thermosphere-ionosphere (TI) system during the period of the ICON mission. In this report the TIEGCM-ICON is introduced, and the focus is on examining the effect of the lower boundary on the TI-system to provide some guidance for interpreting future ICON model results.

Keywords: ICON explorer; atmospheric tides; numerical modeling.


Figures

Fig. 1
Fig. 1
Monthly background climatology based on HWM07 and MSISE00 for the TIEGCM lower boundary. The values for middle of January are depicted at month index 0.5, for February at month index 1.5 and so on.
Fig. 2
Fig. 2
Geophysical conditions for 2009: 3-hourly Kp index (top), and daily F10.7 solar flux (bottom).
Fig. 3
Fig. 3
Daily varying background based on TIMEGCM 2009 simulation (Häusler et al., 2015). The TIMEGCM quantities are interpolated to Z=−7 pressure level and the diurnal and zonal mean taken.
Fig. 4
Fig. 4
Neutral temperature amplitude [K] at the lower boundary of TIEGCM-ICON based on the 27-day averaged diurnal TIMEGCM variation (left), and based on daily diurnal TIMEGCM variation (right).
Fig. 5
Fig. 5
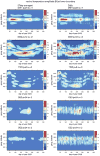
Neutral temperature amplitude at Z=−4.125 (approximately 120 km) for DW1, SW2, TW3, DE3, and DE2 based a daily processing window for the simulations: 27 day averaged TIMEGCM diurnal perturbation and climatological background (left, 27PCB), daily TIMEGCM perturbation and climatological background (middle, DPCB), and daily TIMEGCM perturbations and background (right, DPDB).
Fig. 5
Fig. 5
Neutral temperature amplitude at Z=−4.125 (approximately 120 km) for DW1, SW2, TW3, DE3, and DE2 based a daily processing window for the simulations: 27 day averaged TIMEGCM diurnal perturbation and climatological background (left, 27PCB), daily TIMEGCM perturbation and climatological background (middle, DPCB), and daily TIMEGCM perturbations and background (right, DPDB).
Fig. 6
Fig. 6
Neutral temperature phase at Z=−4.125 (approximately 120 km) for DW1, SW2, TW3, DE3, and DE2 based a daily processing window for the simulations: 27 day averaged TIMEGCM diurnal perturbation and climatological background (left, 27PCB), daily TIMEGCM perturbation and climatological background (middle, DPCB), and daily TIMEGCM perturbations and background (right, DPDB). Phase is defined as the longitude of the maximum at 0UT.
Fig. 6
Fig. 6
Neutral temperature phase at Z=−4.125 (approximately 120 km) for DW1, SW2, TW3, DE3, and DE2 based a daily processing window for the simulations: 27 day averaged TIMEGCM diurnal perturbation and climatological background (left, 27PCB), daily TIMEGCM perturbation and climatological background (middle, DPCB), and daily TIMEGCM perturbations and background (right, DPDB). Phase is defined as the longitude of the maximum at 0UT.
Fig. 7
Fig. 7
Neutral temperature amplitude at Z=2.875 (approximately 300 km) for DW1, SW2, TW3, DE3, and DE2 based a daily processing window for the simulations: 27 day averaged TIMEGCM diurnal perturbation and climatological background (left, 27PCB), daily TIMEGCM perturbation and climatological background (middle, DPCB), and daily TIMEGCM perturbations and background (right, DPDB).
Fig. 7
Fig. 7
Neutral temperature amplitude at Z=2.875 (approximately 300 km) for DW1, SW2, TW3, DE3, and DE2 based a daily processing window for the simulations: 27 day averaged TIMEGCM diurnal perturbation and climatological background (left, 27PCB), daily TIMEGCM perturbation and climatological background (middle, DPCB), and daily TIMEGCM perturbations and background (right, DPDB).
Fig. 8
Fig. 8
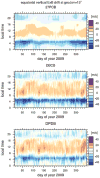
Local time variation of the vertical ExB drift [m/s] at magnetic equator (geographic latitude λ = 11°, geographic longitude ϕ = 15°, pressure level Z=2) for 2009 simulations: 27 day averaged TIMEGCM diurnal perturbation and climatological background (top, 27PCB); daily TIMEGCM perturbation and climatological background (middle, DPCB); daily TIMEGCM perturbations and background (bottom, DPDB).
Fig. 9
Fig. 9
Diurnal variation of mean vertical ExB drift [m/s] (lines) and standard deviation (colored filled) at geographic latitude λ = 11°, geographic longitude ϕ = 15°, pressure level Z=2) for 2009 simulations: daily TIMEGCM perturbations and background (blue, DPDB); daily TIMEGCM perturbation and climatological background (red, DPCB), 27 day averaged TIMEGCM diurnal perturbation and climatological background (black, 27PCB).
Fig. 10
Fig. 10
Local time and geographic longitude variation of vertical ExB drift [m/s] at the magnetic equator for the 2009 simulations: 27 day averaged TIMEGCM diurnal perturbation and climatological background (1a–1d, left panels, 27PCB); daily TIMEGCM perturbation and climatological background (2a–2d; middle panels, DPCB); daily TIMEGCM perturbations and background (3a–3d, right panels, DPDB). The depicted variations are an 15-day average from day of year (doy) 15–30 (1a, 2a, 3a), doy 70–85 (1b, 2b,3b), doy 180–195 (1c,2c,3c), and doy 260–275 (1d, 2d, 3d).
Fig. 11
Fig. 11
Latitudinal variation of NmF2 log10 [1/cm3] (left panels) and hmF2 [km] (right panels) at 13 local time for 2009 simulations: 27 day averaged TIMEGCM diurnal perturbation and climatological background (27PCB, top panels), daily TIMEGCM perturbation and climatological background (DPCB, middle panels), and daily TIMEGCM perturbations and background (DPDB, bottom panels).
Fig. 12
Fig. 12
Mean latitudinal variation of NmF2 log10 [1/cm3] at 13 local time and 15° geographic longitude (12 UT) for January–February and October–December (left panel), June–August (right panel) for the simulations: 27 day averaged TIMEGCM diurnal perturbation and climatological background (black, 27PCB), daily TIMEGCM perturbation and climatological background (red, DPCB), and daily TIMEGCM perturbations and background (blue, DPDB).
Fig. 13
Fig. 13
Variation over magnetic latitudinal and longitude of NmF2 log10 [1/cm3] at 13 local time for 2009 simulations: 27 day averaged TIMEGCM diurnal perturbation and climatological background (1a–1d, left panels, 27PCB); daily TIMEGCM perturbation and climatological background (2a–2d; middle panels, DPCB); daily TIMEGCM perturbations and background (3a=3d, right panels, DPDB). The depicted variations are an 15-day average from day of year (doy) 15–30 (1a, 2a, 3a), doy 70–85 (1b, 2b,3b), doy 180–195 (1c,2c,3c), and doy 260–275 (1d, 2d, 3d).
Fig. 14
Fig. 14
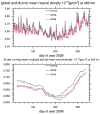
Global mean neutral density at 400 km for the simulations: 27 day averaged TIMEGCM diurnal perturbation and climatological background (black, 27PCB), daily TIMEGCM perturbation and climatological background (red, DPCB), and daily TIMEGCM perturbations and background (blue, DPDB). The top panels shows the daily mean density and the bottom panels illustrates the 30 day running mean.
Fig. 15
Fig. 15
Zonal and diurnal mean [O]/[N2] ratio in mass mixing ratio for Z=2.875 (approximately 300km; left panels) and Z=−4.125 (approximately 120 km; right panels) for the simulations: 27 day averaged TIMEGCM diurnal perturbation and climatological background (27PCB, top panels), daily TIMEGCM perturbation and climatological background (DPCB, middle panels), and daily TIMEGCM perturbations and background (DPDB, bottom panels).
Fig. 16
Fig. 16
Mean latitudinal variation of [O]/[N2] mass mixing ratio [−] for Z=2.875 (approximately 300km) for January–February and October–December (left panel), June–August (right panel) for the simulations: 27 day averaged TIMEGCM diurnal perturbation and climatological background (black, 27PCB), daily TIMEGCM perturbation and climatological background (red, DPCB), and daily TIMEGCM perturbations and background (blue, DPDB).
Fig. 17
Fig. 17
Global mean height variation for time-averaged profiles between doy 43 to 73: relative change in total neutral density (top), difference in temperature (middle), relative change in O (green) and N2 (purple) number density (bottom) for the 27PCB simulation with respect to DPCB simulation.

References

    1. Akmaev RA, Shved GM. Modelling of the composition of the lower thermosphere taking account of the dynamics with applications to tidal variations of the forbidden O I 5577 A airglow. Journal of Atmospheric and Terrestrial Physics. 1980;42:705–716.
    1. Alken P, Chulliat A, Maus S. Longitudinal and seasonal structure of the ionospheric equatorial electric field. Journal of Geophysical Research: Space Physics. 2013;118(3):1298–1305. doi: 10.1029/2012JA018314. - DOI
    1. Burns AG, Solomon SC, Wang W, Qian L, Zhang Y, Paxton LJ. Daytime climatology of ionospheric NmF2 and hmF2 from COSMIC data. Journal of Geophysical Research: Space Physics. 2012;117(A9) doi:10.1029/2012JA017529, a09315.
    1. Dickinson RE, Ridley E, Roble R. Thermospheric general circulation with coupled dynamics and composition. Journal of the Atmospheric Sciences. 1984;41(2):205–219.
    1. Drob DP, et al. An empirical model of the earth’s horizontal wind fields: Hwm07. Journal of Geophysical Research: Space Physics. 2008;113(A12) doi:10.1029/2008JA013668, a12304.

LinkOut - more resources