

Children who are both wasted and stunted are also underweight and have a high risk of death: a descriptive epidemiology of multiple anthropometric deficits using data from 51 countries
- PMID: 30026945
- PMCID: PMC6047117
- DOI: 10.1186/s13690-018-0277-1
Children who are both wasted and stunted are also underweight and have a high risk of death: a descriptive epidemiology of multiple anthropometric deficits using data from 51 countries
Abstract
Background: Wasting and stunting are common. They are implicated in the deaths of almost two million children each year and account for over 12% of disability-adjusted life years lost in young children. Wasting and stunting tend to be addressed as separate issues despite evidence of common causality and the fact that children may suffer simultaneously from both conditions (WaSt). Questions remain regarding the risks associated with WaSt, which children are most affected, and how best to reach them.
Methods: A database of cross-sectional survey datasets containing data for almost 1.8 million children was compiled. This was analysed to determine the intersection between sets of wasted, stunted, and underweight children; the association between being wasted and being stunted; the severity of wasting and stunting in WaSt children; the prevalence of WaSt by age and sex, and to identify weight-for-age z-score and mid-upper arm circumference thresholds for detecting cases of WaSt. An additional analysis of the WHO Growth Standards sought the maximum possible weight-for-age z-score for WaSt children.
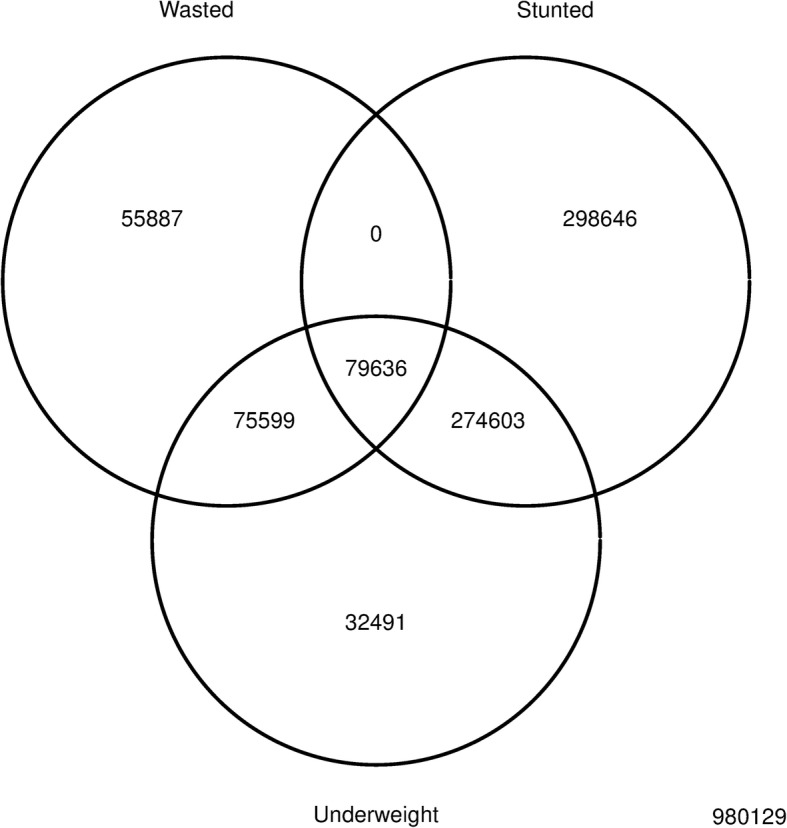
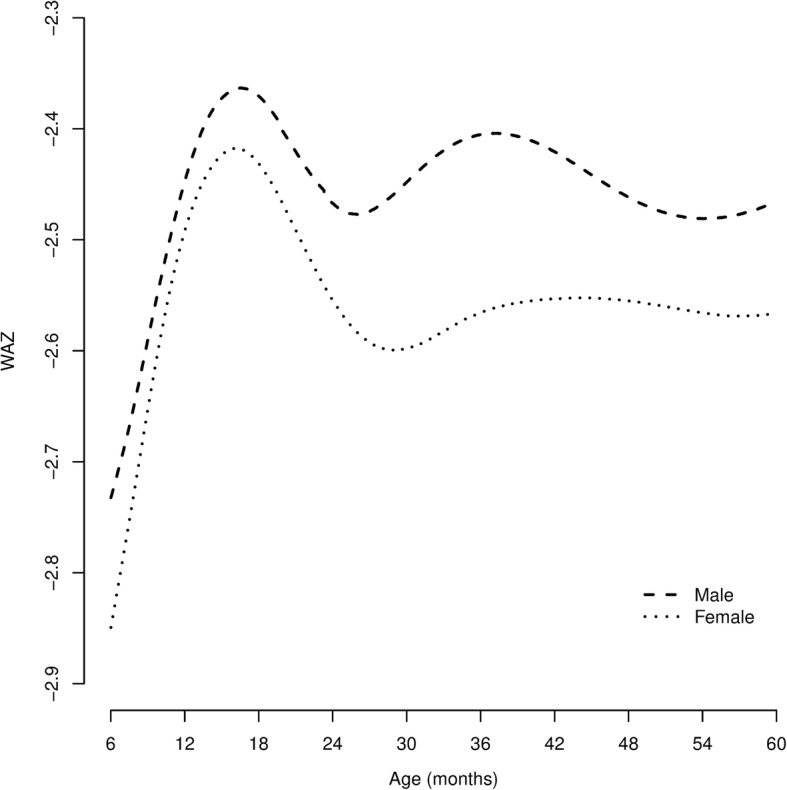
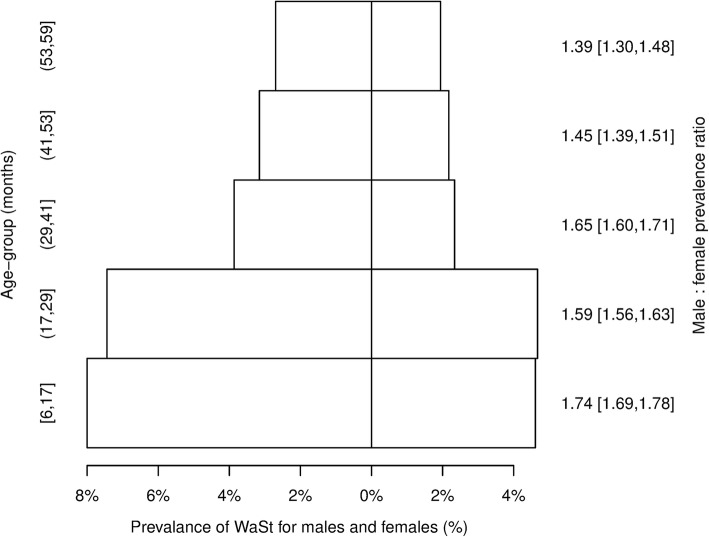
Results: All children who were simultaneously wasted and stunted were also underweight. The maximum possible weight-for-age z-score in these children was below - 2.35. Low WHZ and low HAZ have a joint effect on WAZ which varies with age and sex. WaSt and "multiple anthropometric deficits" (i.e. being simultaneously wasted, stunted, and underweight) are identical conditions. The conditions of being wasted and being stunted are positively associated with each other. WaSt cases have more severe wasting than wasted only cases. WaSt cases have more severe stunting than stunted only cases. WaSt is largely a disease of younger children and of males. Cases of WaSt can be detected with excellent sensitivity and good specificity using weight-for-age.
Conclusions: The category "multiple anthropometric deficits" can be abandoned in favour of WaSt. Therapeutic feeding programs should cover WaSt cases given the high mortality risk associated with this condition. Work on treatment effectiveness, duration of treatment, and relapse after cure for WaSt cases should be undertaken. Routine reporting of the prevalence of WaSt should be encouraged. Further work on the aetiology, prevention, case-finding, and treatment of WaSt cases as well as the extent to which current interventions are reaching WaSt cases is required.
Keywords: Anthropometry; Mortality; Multiple anthropometric deficits; Prevalence; Stunting; Wasting.
Conflict of interest statement
This study performed a secondary analysis of data that had already been collected for prevalence assessment in emergency and development settings. No persons could be identified from the data. No clinical data were used. No experiments were performed on human subjects. Ethical approval for the work described in this article is not required under the Declaration of Helsinki (all revisions) and was not sought. Whenever possible, data were collected following ethical approval from locally responsible ethics committees. Some data were collected during complex emergencies when no locally responsible ethics committees were operating. In these cases ethical approval was granted solely by the institutional review bodies of the non-governmental organization (NGO) or United Nations organization (UNO) which collected the data. Permissions were sought and given by local ministries of health and, where appropriate, by local police departments and military and / or paramilitary commanders. Identifying data were collected for programmatic purposes (i.e. for recruitment of cases of acute malnutrition into feeding programs) but this data was either not entered or was removed prior to data being made available for analysis. Participation in the surveys was voluntary. Children were not (and could not be) measured without the consent of their parents or guardians. Verbal informed consent was sought from the primary caregiver of the child. Written consent is almost never sought in these types of survey: It is usually not required and levels of literacy are often low. The existence of the data is proof of consent.Not applicable.The authors declare that they have no competing interests.Springer Nature remains neutral with regard to jurisdictional claims in published maps and institutional affiliations.
Figures
References
-
- Development Initiatives, Global Nutrition Report 2017 : Nourishing the SDGs, Development Initiatives, Bristol, UK, 2017.
-
- Isanaka S, Boundy EO, Grais RF, Myatt M, Briend A. Improving Estimates of Numbers of Children With Severe Acute Malnutrition Using Cohort and Survey Data. Am J Epidemiol Dec. 2016;184(12):861–69. - PubMed
LinkOut - more resources
Full Text Sources
Other Literature Sources
