. 2018 May 18;5(7):1700540.
doi: 10.1002/advs.201700540. eCollection 2018 Jul.

HPV Oncogene Manipulation Using Nonvirally Delivered CRISPR/Cas9 or Natronobacterium gregoryi Argonaute

Affiliations

HPV Oncogene Manipulation Using Nonvirally Delivered CRISPR/Cas9 or Natronobacterium gregoryi Argonaute

Yeh-Hsing Lao et al. Adv Sci (Weinh). .

Abstract

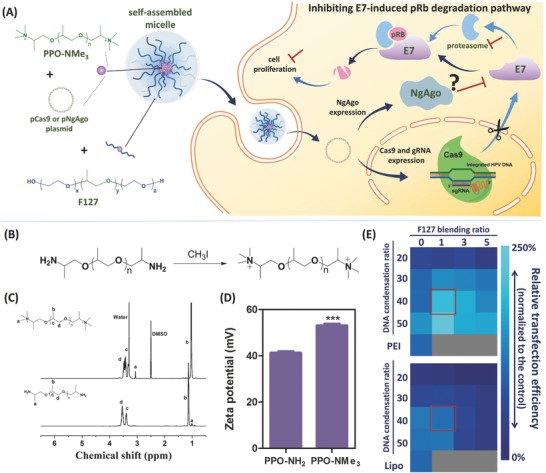
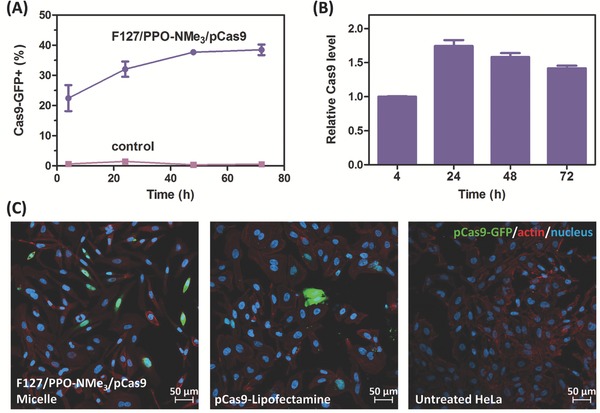
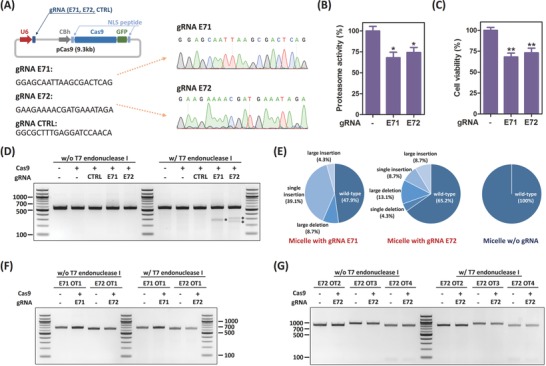
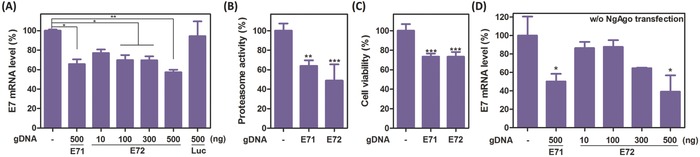
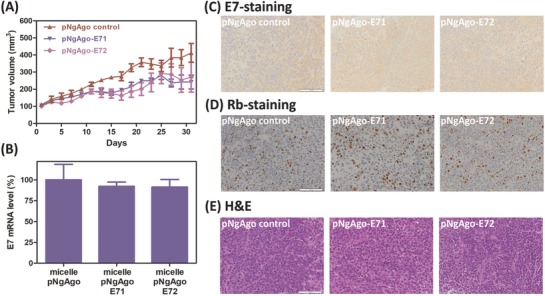
CRISPR/Cas9 technology enables targeted gene editing; yet, the efficiency and specificity remain unsatisfactory, particularly for the nonvirally delivered, plasmid-based CRISPR/Cas9 system. To tackle this, a self-assembled micelle is developed and evaluated for human papillomavirus (HPV) E7 oncogene disruption. The optimized micelle enables effective delivery of Cas9 plasmid with a transient transgene expression profile, benefiting the specificity of Cas9 recognition. Furthermore, the feasibility of using the micelle is explored for another nucleic acid-guided nuclease system, Natronobacterium gregoryi Argonaute (NgAgo). Both systems are tested in vitro and in vivo to evaluate their therapeutic potential. Cas9-mediated E7 knockout leads to significant inhibition of HPV-induced cancerous activity both in vitro and in vivo, while NgAgo does not show significant E7 inhibition on the xenograft mouse model. Collectively, this micelle represents an efficient delivery system for nonviral gene editing, adding to the armamentarium of gene editing tools to advance safe and effective precision medicine-based therapeutics.

Keywords: CRISPR/Cas9; Natronobacterium gregoryi Argonaute (NgAgo); gene delivery; gene editing; gene silencing; human papillomavirus (HPV).


Figures

Figure 1
Figure 1
Design and optimization of the proposed micellar system for gene manipulation. A) HPV oncogene manipulation with the micelle proposed in this study. B) Synthesis, C) 1H NMR, and D) zeta potential characterization of PPO‐NMe3. Data are represented as average ± standard error of mean (SEM; n = 3). Two‐tailed Student's t‐test was used for p‐value calculation. The significant level is represented as ∗∗∗ (p < 0.001). E) Influence of DNA condensation and F127 blending ratios on micelle's Cas9 transfection efficiency.
Figure 2
Figure 2
Cas9 transfection using optimized F127/PPO‐NMe3/pCas9 (40/40/1) micelle. A) Transgene expression kinetics in HeLa cells. B) Relative Cas9 expression level in transfected HeLa cells (data normalized to the Cas9‐GFP fluorescent intensity at 4 h post‐transfection). Data are represented as average ± SEM (n = 3). C) CLSM images of HeLa cells incubated with F127/PPO‐NMe3/pCas9 micelle or pCas9‐loaded Lipofectamine for 24 h.
Figure 3
Figure 3
HPV E7 disruption using F127/PPO‐NMe3/pCas9 micelle. A) pCas9 construct design and gRNAs. B) Proteasome activity of Cas9‐transfected HeLa cells. Data are represented as average ± SEM (n = 3). C) Cell viability of Cas9‐transfected HeLa cells. Proteasome activity and cell viability were measured at 72 h post‐transfection. Data are represented as average ± SEM (n = 4). One‐way ANOVA with Dunnett's multiple comparison test was used for p‐value calculation. The significant level is represented as ∗ (p < 0.05); ∗∗ (p < 0.01). D) T7EI assay to verify E7 gene disruption. E) Sequencing analysis of micelle‐transfected cells. T7EI assays to verify the off‐targeting based on the prediction using F) Cas9‐OFFinder and G) BLAST (for (C) through (G), the cells were sorted using GFP marker at 24 h post‐transfection and genomic DNAs were extracted at 96 h post‐transfection).
Figure 4
Figure 4
HPV E7 knockdown using the optimized micelle with the NgAgo system. A) HPV18‐E7 mRNA expression level in NgAgo‐transfected HeLa cell at 48 h post‐gDNA transfection. Data are presented as average ± SEM (n = 3). B) Proteasome activity of NgAgo‐transfected HeLa cells. Data are presented as average ± SEM (n = 4). C) Cell viability of NgAgo‐transfected HeLa cells. Data are presented as average ± SEM (n = 6). Proteasome activity and cell viability were measured at 72 h post‐NgAgo transfection. D) HPV18‐E7 mRNA expression level in the cells transfected with gDNA only (n = 4). One‐way ANOVA with Dunnett's multiple comparison test was used for p‐value calculation. The significant level is represented as ∗ (p < 0.05); ∗∗ (p < 0.01); ∗∗∗ (p < 0.001).
Figure 5
Figure 5
Therapeutic effect of using micelle‐delivered Cas9 on the HeLa xenograft model. A) Tumor growth in response to locally administered micelle, pCas9‐loaded micelle, and E7‐targeting pCas9‐loaded micelles (E71 and E72). B) Tumor volume comparison on the day when mice were sacrificed (day 31). C) Changes in body weight throughout the whole treatment course. Data are presented as average ± SEM (n = 5 for PBS and micelle controls; n = 6 for pCas9 control and the E71, E72 groups). One‐way ANOVA with Dunnett's multiple comparison test was used for p‐value calculation. The significant level is represented as ∗ (p < 0.05). Representative images of D) E7‐stained, E) Rb‐stained, and F) H&E‐stained tumor tissue sections. Scale bar represents 100 µm. G) Sequencing analysis for the genomic DNAs extracted from the tumor tissue treated with micelle‐delivered pCas9 and gRNA E72 (insets: representative sequencing results).
Figure 6
Figure 6
Therapeutic effect of using micelle‐delivered NgAgo on the HeLa xenograft model. A) Tumor growth in response to locally administered pNgAgo‐loaded micelle and pNgAgo‐loaded micelles with E7‐targeting gDNAs (E71 and E72). B) HPV18‐E7 mRNA expression level in the NgAgo‐treated tumor data are presented as average ± SEM (n = 5). One‐way ANOVA with Dunnett's multiple comparison test was used for p‐value calculation. Representative images of C) E7‐stained, D) Rb‐stained, and E) H&E‐stained tumor tissue sections. Scale bar represents 100 µm.

References

    1. a) Doudna J. A., Charpentier E., Science 2014, 346, 1258096; - PubMed
    2. b) Dominguez A. A., Lim W. A., Qi L. S., Nat. Rev. Mol. Cell Biol. 2016, 17, 5. - PMC - PubMed
    1. Cong L., Ran F. A., Cox D., Lin S. L., Barretto R., Habib N., Hsu P. D., Wu X. B., Jiang W. Y., Marraffini L. A., Zhang F., Science 2013, 339, 819. - PMC - PubMed
    1. Ran F. A., Cong L., Yan W. X., Scott D. A., Gootenberg J. S., Kriz A. J., Zetsche B., Shalem O., Wu X. B., Makarova K. S., Koonin E. V., Sharp P. A., Zhang F., Nature 2015, 520, 186. - PMC - PubMed
    1. Zetsche B., Gootenberg J. S., Abudayyeh O. O., Slaymaker I. M., Makarova K. S., Essletzbichler P., Volz S. E., Joung J., van der Oost J., Regev A., Koonin E. V., Zhang F., Cell 2015, 163, 759. - PMC - PubMed
    1. Xu S., Cao S. S., Zou B. J., Yue Y. Y., Gu C., Chen X., Wang P., Dong X. H., Xiang Z., Li K., Zhu M. S., Zhao Q. S., Zhou G. H., Genome Biol. 2016, 17, 186. - PMC - PubMed