. 2018 Jul 10;5(3):ENEURO.0174-18.2018.
doi: 10.1523/ENEURO.0174-18.2018. eCollection 2018 May-Jun.

Extending the Time Domain of Neuronal Silencing with Cryptophyte Anion Channelrhodopsins

Affiliations

Extending the Time Domain of Neuronal Silencing with Cryptophyte Anion Channelrhodopsins

Elena G Govorunova et al. eNeuro. .

Abstract

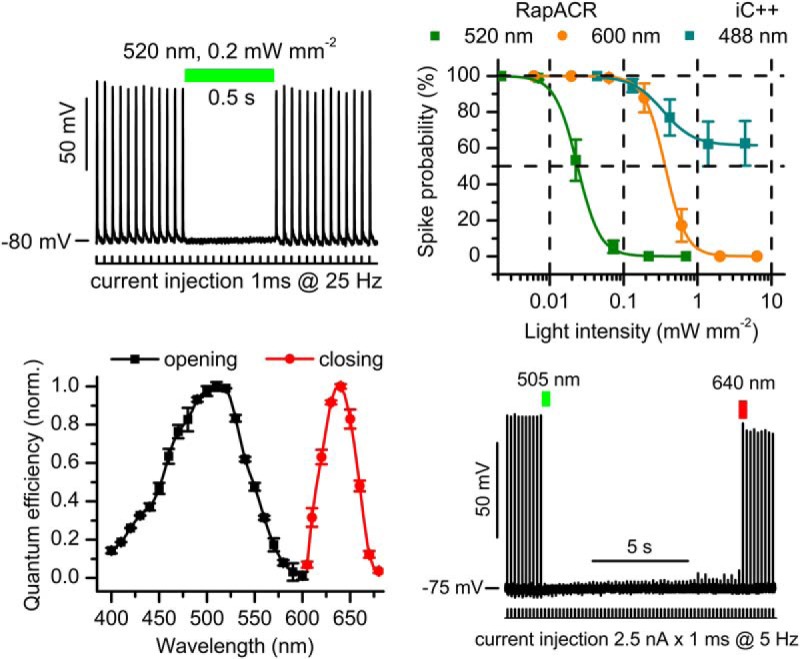
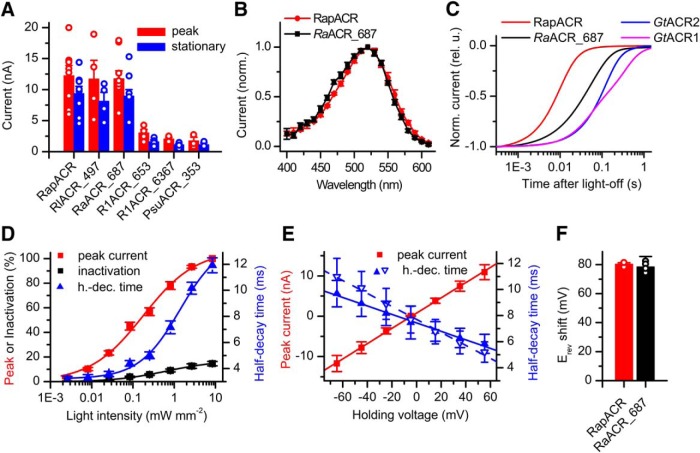
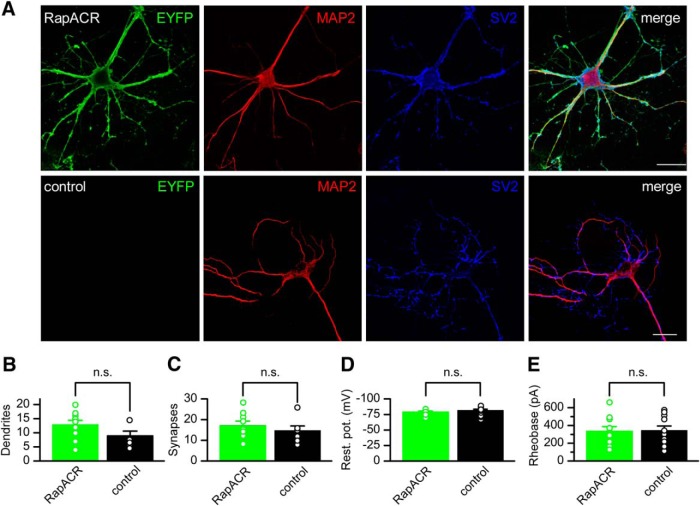
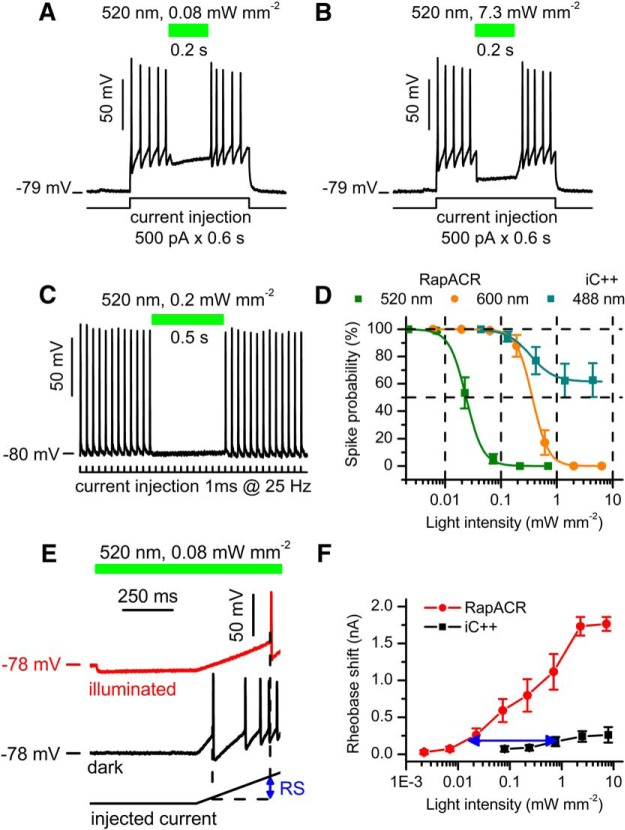
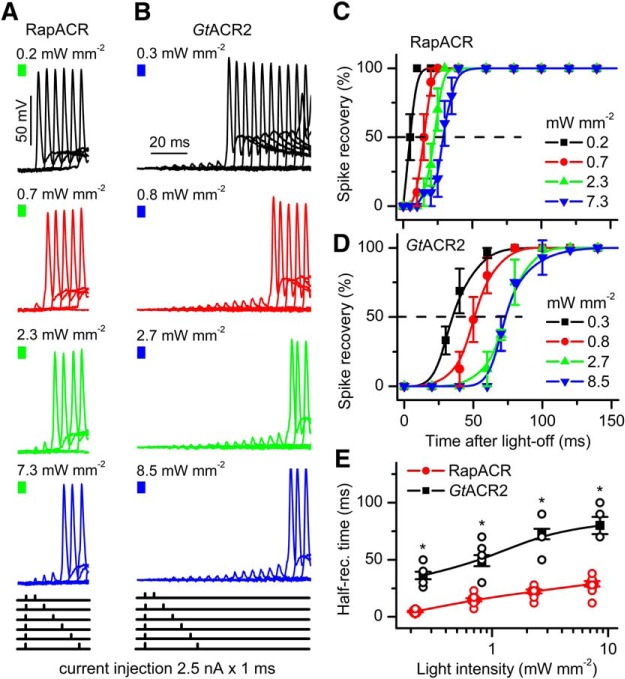
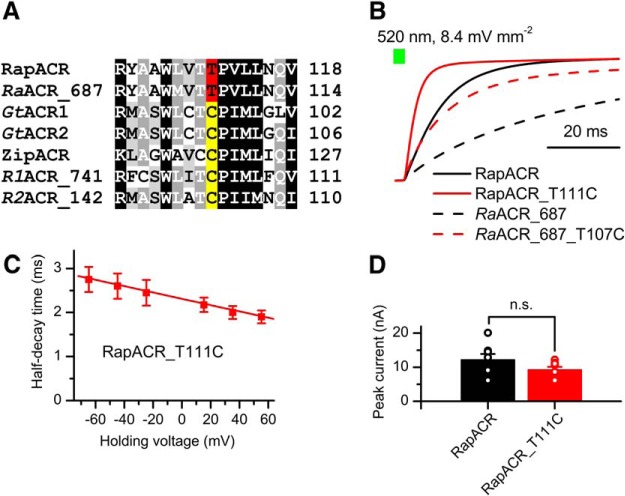
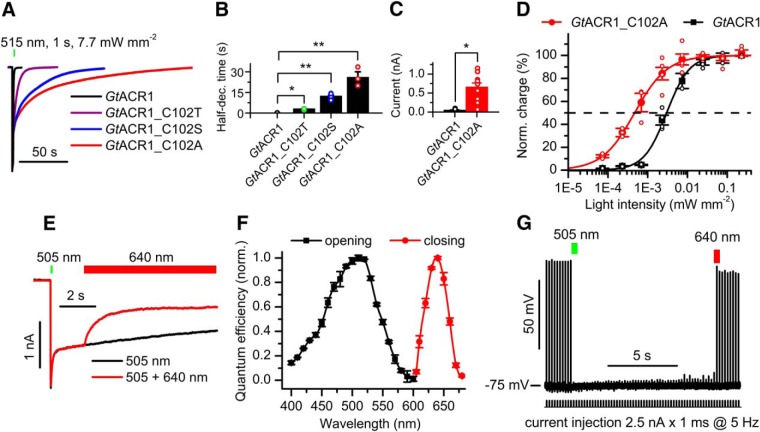
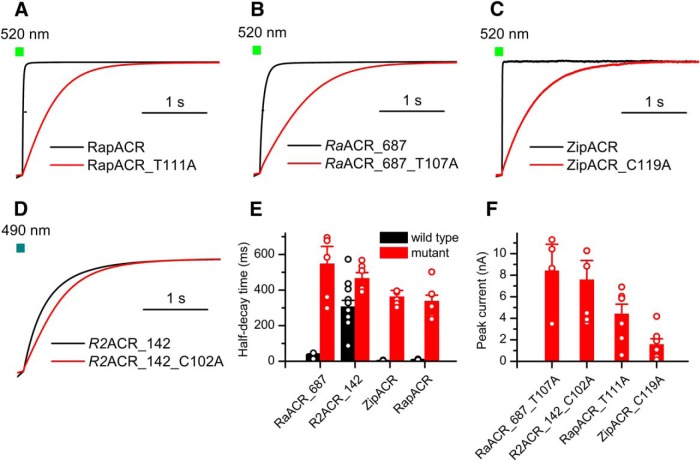
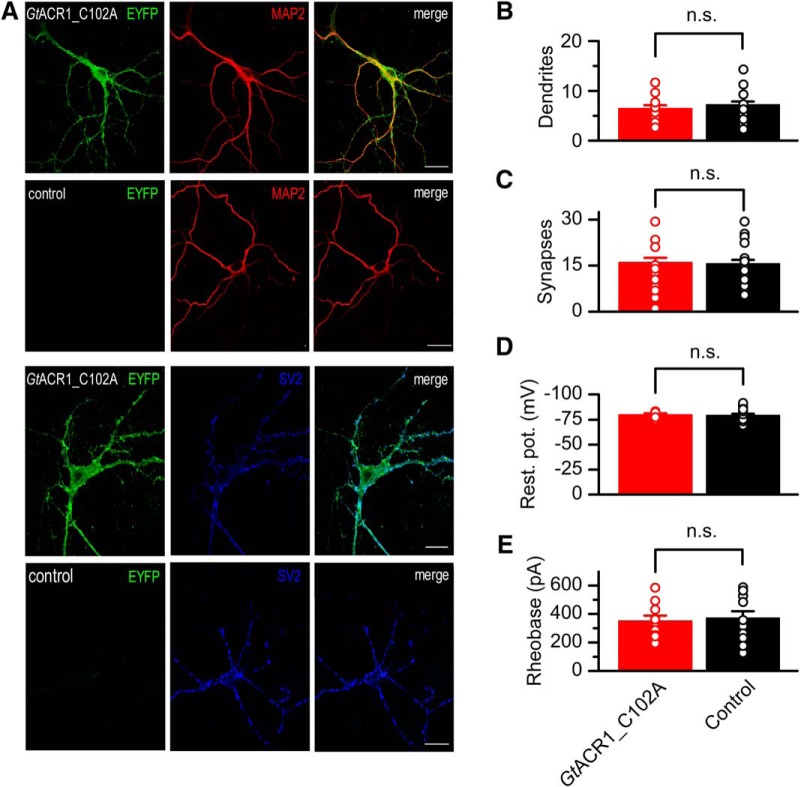
Optogenetic inhibition of specific neuronal types in the brain enables analysis of neural circuitry and is promising for the treatment of a number of neurological disorders. Anion channelrhodopsins (ACRs) from the cryptophyte alga Guillardia theta generate larger photocurrents than other available inhibitory optogenetic tools, but more rapid channels are needed for temporally precise inhibition, such as single-spike suppression, of high-frequency firing neurons. Faster ACRs have been reported, but their potential advantages for time-resolved inhibitory optogenetics have not so far been verified in neurons. We report RapACR, nicknamed so for "rapid," an ACR from Rhodomonas salina, that exhibits channel half-closing times below 10 ms and achieves equivalent inhibition at 50-fold lower light intensity in lentivirally transduced cultured mouse hippocampal neurons as the second-generation engineered Cl--conducting channelrhodopsin iC++. The upper limit of the time resolution of neuronal silencing with RapACR determined by measuring the dependence of spiking recovery after photoinhibition on the light intensity was calculated to be 100 Hz, whereas that with the faster of the two G. theta ACRs was 13 Hz. Further acceleration of RapACR channel kinetics was achieved by site-directed mutagenesis of a single residue in transmembrane helix 3 (Thr111 to Cys). We also show that mutation of another ACR (Cys to Ala at the same position) with a greatly extended lifetime of the channel open state acts as a bistable photochromic tool in mammalian neurons. These molecules extend the time domain of optogenetic neuronal silencing while retaining the high light sensitivity of Guillardia ACRs.

Keywords: channelrhodopsins; chloride ion channels; neuronal inhibition; optogenetics.


Figures

None
Graphical abstract
Figure 1.
Figure 1.
Screening of ACR homologs. A, The amplitude of photocurrents generated by tested ACR homologs expressed in HEK293 cells in response to the first pulse of continuous light at the wavelength of the maximal sensitivity for each homolog (Table 3) at -60 mV at the amplifier output in standard solutions. The stationary current was measured at the end of a 1-s light pulse. The data are the mean values ± SEM (n = 3–10 cells). The data obtained in each individual cell are shown as empty circles. B, The action spectra of photocurrents generated by RapACR (RsACR_665) and RaACR_687. The data are the mean values ± SEM (n = 4 and n = 8 scans, respectively). C, The kinetics of the photocurrent decay after switching off the continuous light (1-s duration) at -60 mV. D, The dependence of the normalized peak amplitude, inactivation, and half-decay time of RapACR photocurrents recorded in response to 1-s pulses of 520-nm light on the stimulus intensity. The data points are mean ± SEM (n = 5 cells). E, The dependence of the peak amplitude (red) and half-decay time (blue) of RapACR photocurrents on the holding voltage corrected for the liquid junction potential. Filled symbols, solid lines, measurements using standard HEK293 solutions (Table 1); empty downward triangles, dashed line, measurements using neuronal solutions (Table 2). The data points are mean ± SEM (n = 6 cells). F, The shifts of the reversal potential on partial replacement of Cl with Asp- in the bath. The data are the mean values ± SEM (n = 3 and n = 5 cells for RapACR and RaACR_687, respectively).
Figure 2.
Figure 2.
RapACR expression does not change morphologic and physiologic parameters of neurons. A, Immunofluorescent images of neurons transduced with RapACR_EYFP fusion (top row) or control (non-transduced) neurons (bottom row) and stained with antibodies against EYFP (green channel), MAP2 (microtubule associated protein 2) as the dendrite marker (red channel), and SV2 (synaptic vesicle protein 2) as the synapse marker (blue channel). Scale bar, 20 µm. B, C, The number of dendrites per neuron and synapses per dendritic length of 20 µm, respectively. The data points are mean ± SEM (n = 10 and n = 7 cells for RapACR and control, respectively). D, E, The resting potential (abbreviated as rest. pot. on the y-axis in panel D) and rheobase in the dark. The data points are mean ± SEM (n = 9 and n = 13 cells for RapACR and control, respectively, tested 8–14 d after transduction). Statistical significance was tested by the Mann–Whitney test.
Figure 3.
Figure 3.
RapACR is more efficient for neuronal silencing than the second-generation engineered Cl-conducting channelrhodopsin iC++. A, B, Photoinhibition of spiking in a neuron expressing RapACR at two different light intensities. Spiking was induced by depolarization of the membrane by prolonged current injection as shown at the bottom. The time course of illumination is shown as green bars on top. C, A representative voltage trace recorded from a neuron expressing RapACR and stimulated with a train of 1-ms pulses of 2.5 nA delivered at 25 Hz. Passive response of the membrane (recorded under complete inhibition of spiking with light) was digitally subtracted. The time course of illumination is shown as a green bar. D, The dependence of neuronal inhibition on the light intensity for RapACR and iC++ photoactivated at different wavelengths. The data points are mean ± SEM (n = 15 and n = 14 neurons for RapACR and iC++, respectively) approximated with a logistic function; fitting parameters are listed in Table 4. E, Voltage traces recorded from a neuron transduced with RapACR and stimulated with a depolarizing current ramp (0–2 nA, 1 s; bottom trace) injected 500 ms after the onset of illumination (red) or in the dark (black). The blue arrow shows the photoinduced rheobase shift (RS). F, The dependence of the rheobase shift on the light intensity in neurons transduced with RapACR or iC++. The current ramp was from 0 to 2 nA in 1 s. The blue arrow shows the difference in the light sensitivity between the two tested channels. The data points are mean ± SEM (n = 9 and n = 6 neurons for RapACR and iC++, respectively).
Figure 4.
Figure 4.
Using RapACR improves temporal resolution of neuronal silencing. A, B, Representative series of overlaid voltage traces recorded from neurons expressing RapACR or GtACR2, respectively, illuminated for 500 ms (the end of the light pulse is shown as a colored bar on top) at 520 or 470 nm, respectively, and stimulated with injection of a pair of 1-ms current pulses, the first of which was applied at the end of illumination, and the second of which, at an incrementally increased time after switching off the light (the injection protocols are schematically drawn at bottom; for GtACR2, only the first six protocols are shown). Passive response of the membrane (recorded under complete inhibition of spiking with light) was digitally subtracted. C, D, The time course of recovery of spiking after illumination measured as shown in panels A, B for cells that could be inhibited with 1% light intensity. The data points are the mean values ± SEM (n = 10 and n = 8 neurons for RapACR and GtACR2, respectively). E, The dependence of the time of 50% recovery of spiking on the light intensity calculated from the same cells as in C, D; *p < 0.001 (pairwise comparison of RapACR and GtACR2 data at each intensity by the Mann–Whitney test). Data obtained in each individual neuron are shown as empty circles.
Figure 5.
Figure 5.
Characterization of the fast RapACR_T111C and RaACR_687_T107C mutants. A, A ClustalW alignment of the 3d transmembrane helix around the Cys-128 position (CrChR2 numbering) from indicated ACRs. The Thr residues found in this position are highlighted red, Cys residues, yellow. B, Normalized photocurrent decay after 1-s illumination recorded from wild-type RapACR (black, solid) and RaACR_687 (black, dashed), and the corresponding T111C (red, solid) and T107C (red, dashed) mutants. C, The dependence of the half-decay time of RapACR_T111C photocurrent on the holding voltage corrected for the liquid junction potential. The data points are the mean ± SEM (n = 4 cells). D, Peak photocurrent amplitude at -60 mV. The wild-type data are from Figure 1A, the data for RapACR_T111C are the mean values ± SEM (n = 8 cells). Statistical significance was tested by the Mann–Whitney test. The values obtained in individual cells are shown as open circles.
Figure 6.
Figure 6.
Characterization of the GtACR1_C102X mutants and the use of GtACR1_C102A as a bistable photochromic silencing tool. A, Normalized photocurrent traces recorded at -60 mV in HEK293 cells. B, The half-time of the slow decay phase. The data are mean ± SEM (n = 4–12 cells; for exact numbers, see Table 5); *p < 0.05, **p = 0.01; Kruskal–Wallis test with Bonferroni correction. C, The amplitudes of stationary photocurrents in HEK293 cells at -60 mV after 200-s illumination. The wavelengths were 515 and 505 nm for GtACR1 and GtACR1_C102A, respectively. The data are mean ± SEM (n = 13 and n = 12 cells, respectively); *p < 0.001; Mann–Whitney test; see Table 6 for full statistics. D, The dependence of electrical charge transferred across the membrane during 100-s illumination at -60 mV. The data are mean ± SEM (n = 5 and n = 6 cells for GtACR1 and GtACR1_C102A, respectively). The fitting parameters are listed in Table 4. E, Opening and partial closing of GtACR1_C102A with light at -60 mV. F, The action spectra of GtACR1_C102A opening and closing. The data points are mean ± SEM (n = 8 scans). G, Bidirectional optical control of neuronal spiking with GtACR1_C102A. Passive response of the membrane (recorded under complete inhibition of spiking with light) was digitally subtracted. In panels B–D, also the data obtained in each individual cell are shown as empty circles.
Figure 7.
Figure 7.
Biophysical characteristics of slow ACR mutants. A–D, Normalized photocurrent decay after 1-s illumination recorded from wild-type ACRs (black) and their respective mutants in which the residue homologous to Cys-102 (GtAR1 numbering) was mutated to Ala (red). E, F, Photocurrent half-decay times (E) and peak photocurrent amplitudes (F) measured in wild-type ACRs and their indicated mutants. The data points are mean ± SEM (n = 5–12 cells; for exact numbers, see in Table 5).
Figure 8.
Figure 8.
GtACR1_C102A expression does not change morphologic and physiologic parameters of neurons. A, Immunofluorescent images of neurons transduced with GtACR1_EYFP fusion (odd rows) or control (non-transduced) neurons (even rows) and stained with antibodies against EYFP (green channel), MAP2 (microtubule associated protein 2) as the dendrite marker (red channel), and SV2 (synaptic vesicle protein 2) as the synapse marker (blue channel). Scale bar, 20 µm. B, C, The number of dendrites per neuron and synapses per dendritic length of 20 µm, respectively. The data points are mean ± SEM (n = 17 and n = 24 cells for GtACR1_C102A and control, respectively). D, E, The resting potential (abbreviated as rest. pot. on the y-axis in panel D) and rheobase in the dark. The data points are mean ± SEM (n = 10 and n = 13 cells for GtACR1_C102A and control, respectively, tested 8–14 d after transduction). Statistical significance was tested by the Mann–Whitney test (see full results in Table 6).

References

    1. Alfonsa H, Merricks EM, Codadu NK, Cunningham MO, Deisseroth K, Racca C, Trevelyan AJ (2015) The contribution of raised intraneuronal chloride to epileptic network activity. J Neurosci 35:7715–7726. 10.1523/JNEUROSCI.4105-14.2015 - DOI - PMC - PubMed
    1. Arguello AA, Richardson BD, Hall JL, Wang R, Hodges MA, Mitchell MP, Stuber GD, Rossi DJ, Fuchs RA (2017) Role of a lateral orbital frontal cortex-basolateral amygdala circuit in cue-induced cocaine-seeking behavior. Neuropsychopharmacology 42:727–735. 10.1038/npp.2016.157 - DOI - PMC - PubMed
    1. Barry PH (1994) JPCalc, a software package for calculating liquid junction potential corrections in patch-clamp, intracellular, epithelial and bilayer measurements and for correcting junction potential measurements. J Neurosci Methods 51:107–116. - PubMed
    1. Bergs A, Schultheis C, Fischer E, Tsunoda SP, Erbguth K, Husson SJ, Govorunova EG, Spudich JL, Nagel G, Gottschalk A, Liewald JF (2018) Rhodopsin optogenetic toolbox v2.0 for light-sensitive excitation and inhibition in Caenorhabditis elegans . PLoS One 13:e0191802. 10.1371/journal.pone.0191802 - DOI - PMC - PubMed
    1. Berndt A, Lee SY, Ramakrishnan C, Deisseroth K (2014) Structure-guided transformation of channelrhodopsin into a light-activated chloride channel. Science 344:420–424. 10.1126/science.1252367 - DOI - PMC - PubMed

Publication types

LinkOut - more resources