Editorial
. 2018 Sep;285(17):3175-3196.
doi: 10.1111/febs.14603. Epub 2018 Aug 4.

Impaired neural stem cell expansion and hypersensitivity to epileptic seizures in mice lacking the EGFR in the brain

Affiliations
Editorial

Impaired neural stem cell expansion and hypersensitivity to epileptic seizures in mice lacking the EGFR in the brain

Jonathan P Robson et al. FEBS J. 2018 Sep.

Abstract

Mice lacking the epidermal growth factor receptor (EGFR) develop an early postnatal degeneration of the frontal cortex and olfactory bulbs and show increased cortical astrocyte apoptosis. The poor health and early lethality of EGFR-/- mice prevented the analysis of mechanisms responsible for the neurodegeneration and function of the EGFR in the adult brain. Here, we show that postnatal EGFR-deficient neural stem cells are impaired in their self-renewal potential and lack clonal expansion capacity in vitro. Mice lacking the EGFR in the brain (EGFRΔbrain ) show low penetrance of cortical degeneration compared to EGFR-/- mice despite genetic recombination of the conditional allele. Adult EGFRΔ mice establish a proper blood-brain barrier and perform reactive astrogliosis in response to mechanical and infectious brain injury, but are more sensitive to Kainic acid-induced epileptic seizures. EGFR-deficient cortical astrocytes, but not midbrain astrocytes, have reduced expression of glutamate transporters Glt1 and Glast, and show reduced glutamate uptake in vitro, illustrating an excitotoxic mechanism to explain the hypersensitivity to Kainic acid and region-specific neurodegeneration observed in EGFR-deficient brains.

Keywords: Epidermal growth factor receptor; epilepsy; glutamate transporter; neural stem cells; neurodegeneration.


Figures

Figure 1
Figure 1
EGFR knock‐out mice display neurodegeneration (A) EGFR−/− newborn mice display an open‐eye phenotype (dotted circle). (B) Whole images of brains isolated from P2 and P7 EGFR knock‐out mice (EGFR−/−) and littermate controls illustrate reduced brain size in EGFR−/− mice. By P7 the majority (but not all) EGFR−/− brains show a bloody frontal cortex. (C, D) Concomitant with a loss of NeuN+ neurons is an increase in GFAP+ cells in P6 EGFR−/− mice compared with littermate controls.
Figure 2
Figure 2
EGFR ablated neural stem cells show a lack of clonal expansion in vitro. (A) Primary sphere forming unit assay (SFUA). Primary EGFR‐deficient cells isolated from the cortex neurogenic niche, the subventricular zone, show reduced sphere forming potential compared to wild‐type cells when cultured with bFGF or bFGF+EGF and show complete inability to form spheres when cultured with EGF alone (n = 4). (B) Neurosphere clonal expansion assay. A continuation from the SFUA, prolonged cultivation of WT or EGFR−/− stem‐like cells as neurospheres shows clonal expansion, and thus confirmation of symmetric stem cell division, in WT spheres (C) cultured with EGF alone (n = 6) or EGF+bFGF (n = 6) but not with bFGF alone (n = 5). In contrast, EGFR−/− spheres (D) are unable to clonally expand in the presence of EGF (n = 5) or bFGF (n = 5). (E–H) Differentiation assay of WT and EGFR−/− neurospheres. Under serum addition and growth factor removal conditions WT spheres could differentiate into neurons and astrocytes while EGFR−/− spheres would only differentiate into astrocytes and not neurons. Error bars indicate SEM; *** indicates P < 0.0005 (t‐test with welches correction).
Figure 3
Figure 3
EGFR mice are smaller than littermate controls. Gross size differences were visible between EGFRΔNes (A) and EGFRΔGfap (B) mice (arrow heads) and their respective control littermates. (C) Postnatal weight gain of wild‐type (n = 18) and EGFRΔNes (n = 5) and EGFRΔGfap (n = 5) mice. Results represent the mean weight ± SEM of females from at least 3 litters. Error bars indicate SEM; ***P ˂0.005, **P ˂0.05. (D, E) Southern blot analysis of genomic DNA isolated from different brain regions of an EGFRf/∆ Nestin‐Cre+ (D) and EGFRf/+ GFAP‐Cre+ (E) mouse. Because in EGFRf/∆ mice the ∆ allele (resulting from germline Cre deletion) was inherited from the parents, it is present in all tissues including the liver that is used as control tissue. Nes‐Cre and GFAP‐cre are not expressed in the liver and thus the floxed allele is also visible, while in the brain the floxed allele is recombined giving rise to the ∆ allele. EGFRf/+ mice, which have no germline deletion of EGFR, show only the floxed alleles where cre‐mediated deletion can occur.
Figure 4
Figure 4
Nestin‐Cre and GFAP‐Cre‐mediated deletion of EGFR results in a grossly normal neocortex with rare neurodegeneration. (A) Southern blot analysis of EGFR recombination in cortices of EGFRΔGfap and EGFR∆Nes mice at birth (P0). An EGFR‐ knock‐out allele and an EGFR flox allele can be observed as the EGFRΔGfap and EGFR∆Nes mice were breed with conventional EGFR knock‐out mice to ensure Cre‐mediated deletion of the floxed allele. Tail‐DNA from the respective mice (tl) were used as controls. (B) Western blot analysis showing expression of EGFR protein in the cortices of EGFR∆Nes mice at postnatal day 9 and 24. (C) No occular phenotypes were observed in adult EGFR∆Nes or EGFRΔGfap mice compared to control mice. (D, E) Brains from EGFR∆Nes or EGFRΔGfap are smaller than those from control littermates but show no obvious cortical degeneration. (F–K) Histological sections show normal cortical organization in EGFRΔGfap (G) and EGFR∆Nes (H) cortices compared to control cortices (F); to allow a better representation of cortical lamination a higher magnification of the cortices shown in (F), (G), (H) are shown in (I), (J), (K), respectively; cortical degeneration is visible in some EGFR∆Nes mice (N). (L, M) Immunofluorescent staining for NeuN in EGFRΔGfap and control cortices. Neurons (NeuN+) appear unaffected in EGFRΔGfap cortices compared with controls. NC, neocortex; CA1, hippocampal cornu ammonis area 1; I–VI, cortical layers I–VI. Abbreviations in (A) co, cortex; ce, cerebellum; hi, hindbrain; li, liver; mb, midbrain; ob, olfactory bulbs.
Figure 5
Figure 5
EGFR mice display no gross behavioral differences. (A–M) Behavioral studies on EGFRΔNes, EGFRΔGfap and littermate control mice. While some differences were observed between EGFRΔGfap (n = 13) and controls (n = 11) in the Elevated plus maze test (A–C), Rotarod test (D) and tail suspension test (M) the remaining studies showed no significant differences between genotypes. EGFRΔNes mice (n = 3) showed no statistical differences to controls (n = 3) in all tests save the Elevated plus maze test (A). All data are displayed as mean ± SEM; *= P < 0.05, **= P < 0.005; statistical significance calculated using one‐way ANOVA with post hoc analysis.
Figure 6
Figure 6
EGFR brains show ectopic neuron formation in the hippocampus. Nests of ectopic neurons are present in the white matter of the hippocampi in EGFRΔGfap and EGFR∆Nes mice. Histological sections of the hippocampi of either control (A), EGFRΔGfap (B) or EGFR∆Nes mice (C). (D–F) Bielschowsky stainings of the hippocampus from an EGFR∆Nes mouse. (D) and (E) represent images from different lateral positions of the same hippocampus. (F) shows a magnification of the boxed region in (E). Arrows in (B, C) indicate nests of ectopic neurons; (F) indicate neuronal plaques.
Figure 7
Figure 7
Absence of EGFR in brain cells does not impair astrogliosis or affect the response to pathogenic insults (A–D). HRP stab wound assay of EGFR mice. No HRP‐specific substrate staining was observed in (A) control brains, (C) EGFRΔGfap brains or (D) EGFR∆Nes brains but HRP‐specific substrate staining is clearly visible in (B) stab wound control brains (dotted circle). (E–P) Wound healing and astrogliosis are not impaired in EGFRΔGfap and EGFR∆Nes brains; Histological sections of adult brains 7 days and 35 days postwounding (dotted lines) stained for Hematoxylin & Eosin or GFAP. Images (E–H) show a control brain, while (I–L) and (M–P) show sections from an EGFRΔGfap and an EGFR∆Nes brain, respectively.
Figure 8
Figure 8
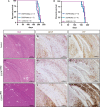
Prion infection assay. (A, B) The response to Prion‐induced insults is not impaired in EGFR∆Nes and EGFRΔGfap mice. Kaplan–Meier plots showing the survival of EGFR∆Nes and EGFRΔGfap mice compared to controls after intracerebral prion inoculation using either a low dose (A; n = 6–7) or a high dose (B; n = 4–6) of RML5. (C–K) Comparable neuropathological changes in the hippocampi of control (C–E), EGFRΔGfap (F–H) and EGFR∆Nes (I–K) mice following pathogenic insult from prion infection. Spongiform changes were visualized with Hematoxylin and Eosin staining (C, F, I) and astrocyte responses were analyzed with GFAP staining (D, G, J). Immunohistochemistry against PrP showed equivalent staining in all genotypes (E, H, K). Scale 100 μm.
Figure 9
Figure 9
The absence of EGFR in brain cells increases susceptibility to Kainic acid‐induced epilepsy. (A) Treatment of EGFR∆Nes mice with Kainic Acid (KA) resulted in significantly more severe epileptic seizures than controls, which were not ameliorated with the NMDAR antagonist MK801 or the AMPAR antagonist NBQX. (B) Treatment with KA resulted in fatalities that were not rescued with pretreatment of MK801 or NBQX. N‐values: WT + KA (12), WT + KA + MK801 (3), WT + KA + NBQX (4), EGFR∆Nes+KA (9), EGFR∆Nes+KA + MK801 (4), EGFR∆Nes+KA + NBQX (3). Error bars indicate SEM; * indicates P < 0.05, **P < 0.005, ***P < 0.0005. Statistical tests: A, t‐test; B, Log‐rank (Mantel–Cox) test.
Figure 10
Figure 10
EGFRΔGfap mice display increased susceptibility to Kainic acid‐induced epilepsy and not ameliorated by glutamate receptor antagonists. (A) Treatment of EGFRΔGfap mice and control littermates with Kainic Acid (KA) resulted in severe epileptic seizures, which were not ameliorated with the NMDAR antagonist MK801 or the AMPAR antagonist NBQX. (B) Treatment of EGFRΔGfap mice with KA resulted in fatalities that were not rescued with pretreatment of MK801 or NBQX. N‐values: WT + KA (5), WT + KA + MK801 (5), WT + KA + NBQX (6), EGFR∆Gfap+KA (5), EGFR∆NGfap+KA+MK801 (7), EGFR∆Gfap+KA + NBQX (6). Error bars indicate SEM; * indicates P < 0.05, **P < 0.005, ***P < 0.0005. Statistical tests: A, t‐test; B, Log‐rank (Mantel–Cox) test.
Figure 11
Figure 11
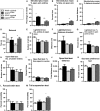
EGFR−/− cortical astrocytes have deficient glutamate uptake capacity. (A) Western blot analysis of EGFR levels in cultured cortical astrocytes; EGFR protein bottom band. (B, C) Quantitative PCR analyses of EGFR−/− and control astrocytes derived from the neocortex (B; n = 4) and midbrain (C; n = 4). Astrocytes were assayed for Glt1 (Slc1A2), Glast (Slc1A3), Sl1c1A4, and Slc1A5 and normalized to Gapdh. (D) Glutamate uptake assay of isolated astrocytes normalized to assayed protein levels identified a significant glutamate uptake potential in EGFR−/− cortical but not midbrain‐derived astrocytes. Significant values shown in order V max then K M. N‐values: WT Ctx (7), EGFR−/− Ctx (3), WT Mb (5), EGFR−/− Mb (4). Error bars indicate SEM; **P < 0.005; NS, not significant. Statistical tests: B/C, t‐test; D, unpaired t‐test with Welches correction.

References

    1. Sibilia M, Kroismayr R, Lichtenberger BM, Natarajan A, Hecking M & Holcmann M (2007) The epidermal growth factor receptor: from development to tumorigenesis. Differentiation 75, 770–787. - PubMed
    1. Yarden Y & Sliwkowski MX (2001) Untangling the ErbB signalling network. Nat Rev Mol Cell Biol 2, 127–137. - PubMed
    1. Caric D, Raphael H, Viti J, Feathers A, Wancio D & Lillien L (2001) EGFRs mediate chemotactic migration in the developing telencephalon. Development 128, 4203–4216. - PubMed
    1. Kornblum HI, Hussain RJ, Bronstein JM, Gall CM, Lee DC & Seroogy KB (1997) Prenatal ontogeny of the epidermal growth factor receptor and its ligand, transforming growth factor alpha, in the rat brain. J Comp Neurol 380, 243–261. - PubMed
    1. Lillien L & Raphael H (2000) BMP and FGF regulate the development of EGF‐responsive neural progenitor cells. Development 127, 4993–5005. - PubMed

Publication types