. 2019 Jan;33(1):652-667.
doi: 10.1096/fj.201800361R. Epub 2018 Jul 20.

Loss of lipin 1-mediated phosphatidic acid phosphohydrolase activity in muscle leads to skeletal myopathy in mice

Affiliations

Loss of lipin 1-mediated phosphatidic acid phosphohydrolase activity in muscle leads to skeletal myopathy in mice

George G Schweitzer et al. FASEB J. 2019 Jan.

Abstract

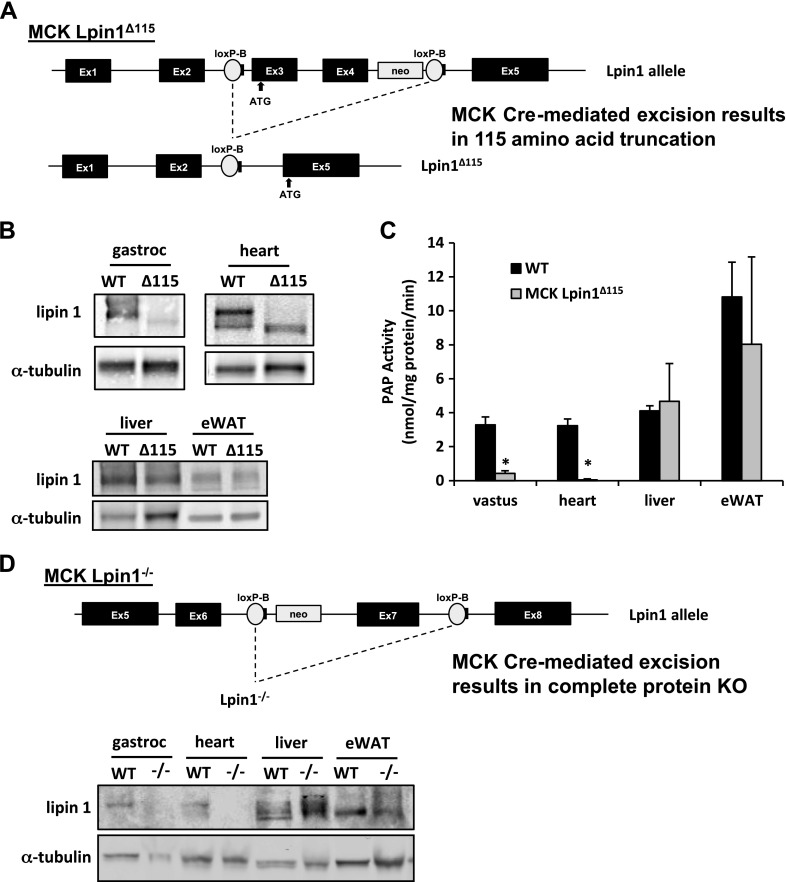
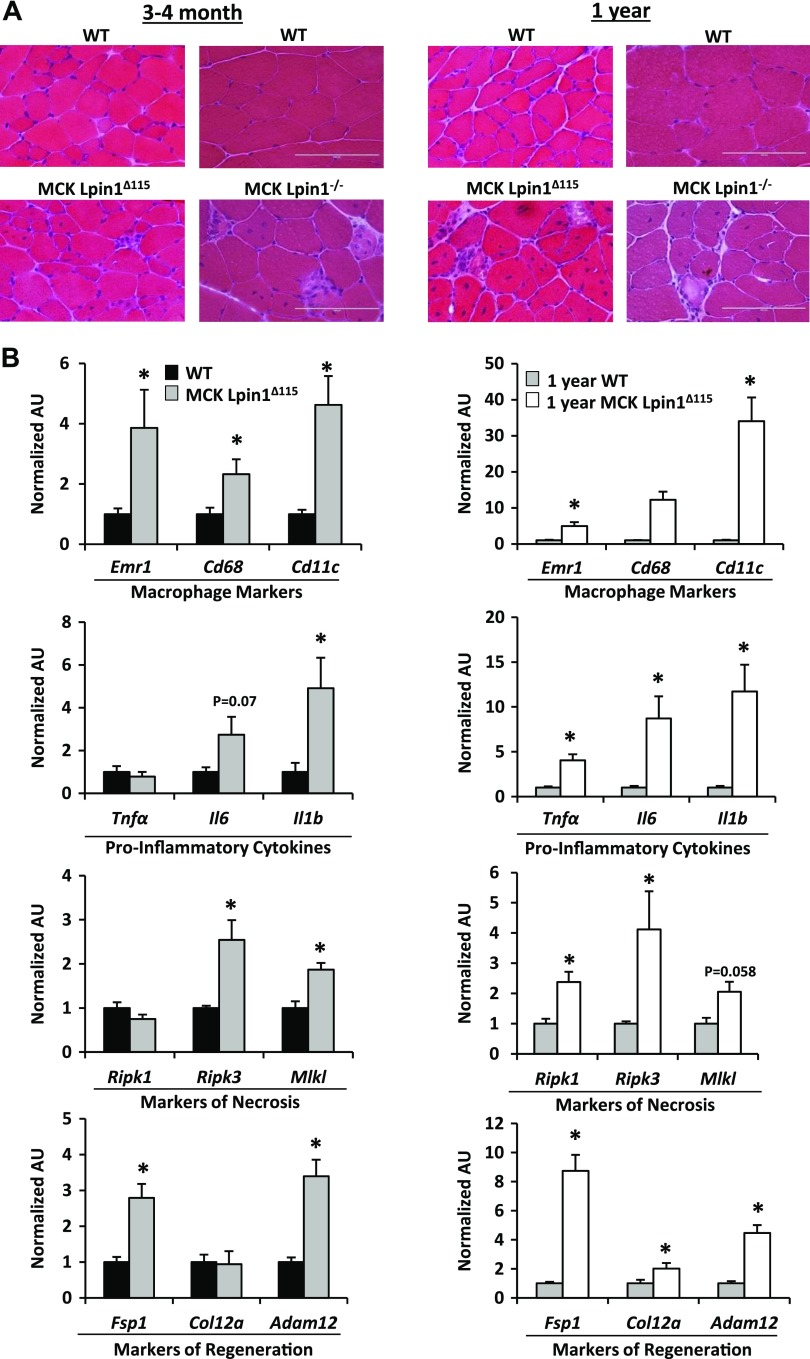
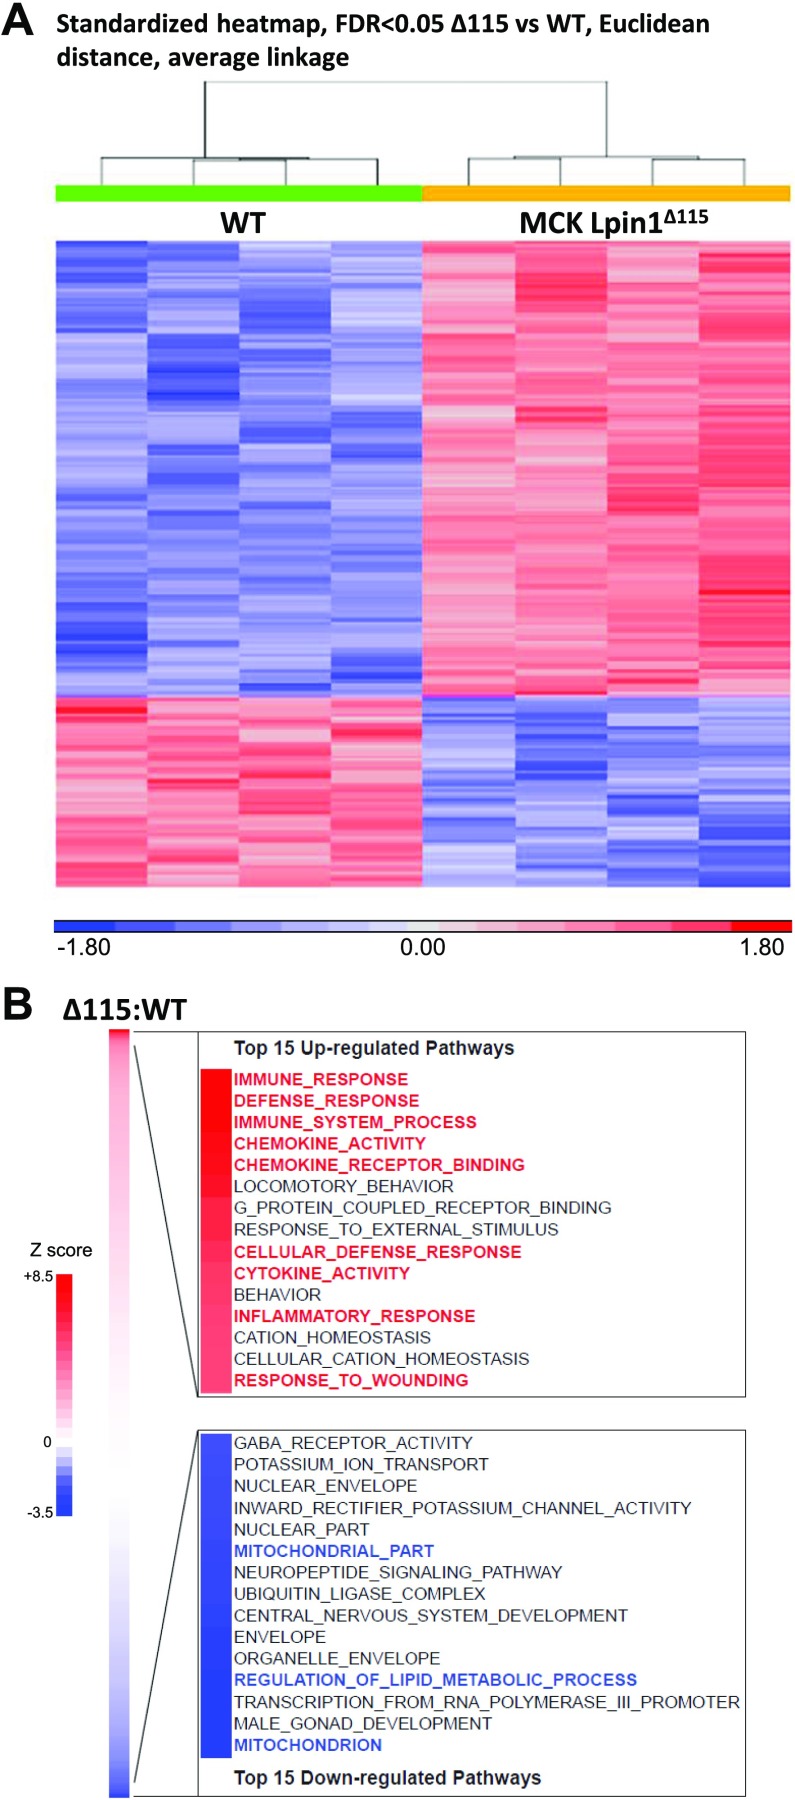
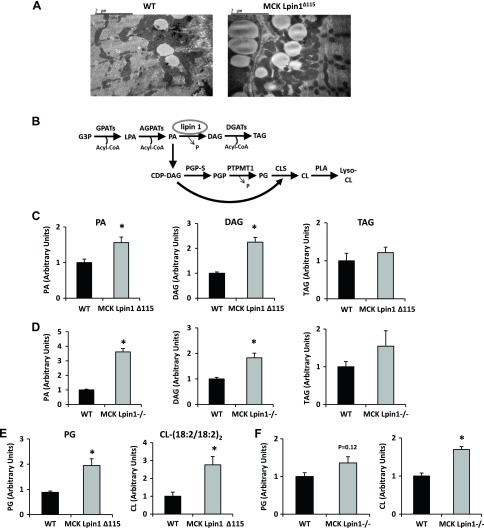
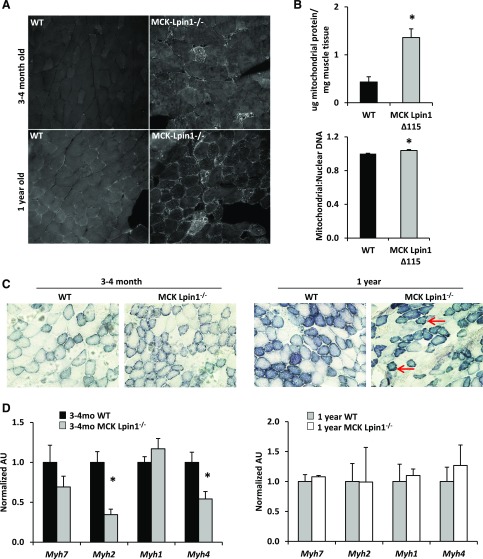
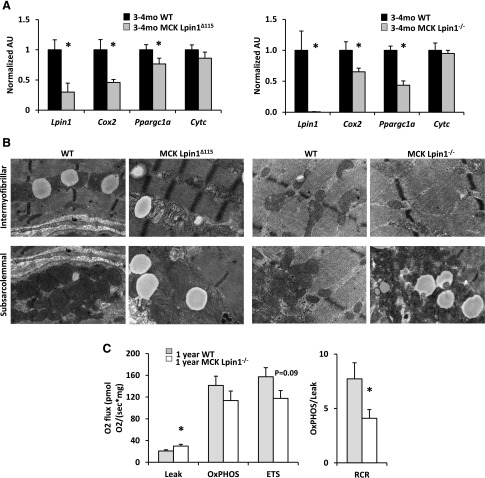
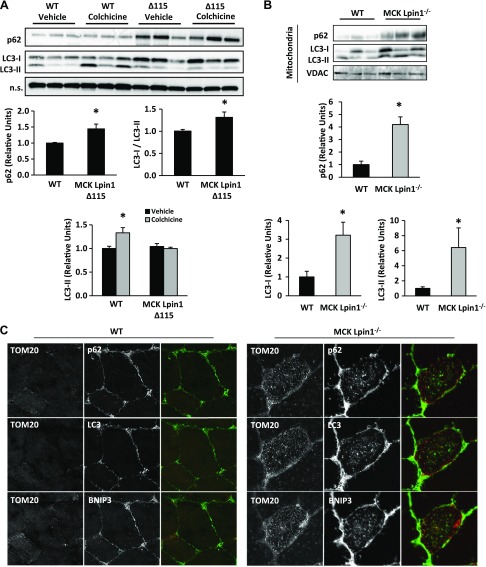
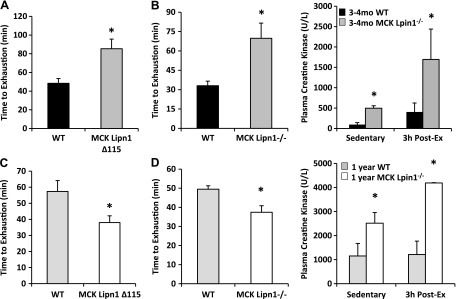
Lipin 1 regulates glycerolipid homeostasis by acting as a phosphatidic acid phosphohydrolase (PAP) enzyme in the triglyceride-synthesis pathway and by regulating transcription factor activity. Mutations in human lipin 1 are a common cause of recurrent rhabdomyolysis in children. Mice with constitutive whole-body lipin 1 deficiency have been used to examine mechanisms connecting lipin 1 deficiency to myocyte injury. However, that mouse model is confounded by lipodystrophy not phenocopied in people. Herein, 2 muscle-specific mouse models were studied: 1) Lpin1 exon 3 and 4 deletion, resulting in a hypomorphic protein without PAP activity, but which preserved transcriptional coregulatory function; and 2) Lpin1 exon 7 deletion, resulting in total protein loss. In both models, skeletal muscles exhibited a chronic myopathy with ongoing muscle fiber necrosis and regeneration and accumulation of phosphatidic acid and, paradoxically, diacylglycerol. Additionally, lipin 1-deficient mice had abundant, but abnormal, mitochondria likely because of impaired autophagy. Finally, these mice exhibited increased plasma creatine kinase following exhaustive exercise when unfed. These data suggest that mice lacking lipin 1-mediated PAP activity in skeletal muscle may serve as a model for determining the mechanisms by which lipin 1 deficiency leads to myocyte injury and for testing potential therapeutic approaches.-Schweitzer, G. G., Collier, S. L., Chen, Z., McCommis, K. S., Pittman, S. K., Yoshino, J., Matkovich, S. J., Hsu, F.-F., Chrast, R., Eaton, J. M., Harris, T. E., Weihl, C. C., Finck, B. N. Loss of lipin 1-mediated phosphatidic acid phosphohydrolase activity in muscle leads to skeletal myopathy in mice.

Keywords: LPIN1; autophagy; diacylglycerol; rhabdomyolysis; triacylglycerol.


Conflict of interest statement

The authors thank Dr. Alan Pestronk and Dr. Abhinav Diwan for technical assistance in interpreting histology, and Dennis J. Dietzen for determining plasma creatine kinase (all from Washington University). This work was supported by U.S. National Institutes of Health (NIH) National Institute of Diabetes and Digestive and Kidney Diseases Grant R01 DK078187 and NIH National Heart, Lung, and Blood Institute Grant R01 HL119225 (to B.N.F.). G.G.S. was supported by NIH National Heart, Lung, and Blood Institute Grants T32 HL007275, T32 HL007081, and the Washington University Institute of Clinical and Translational Sciences NIH Grant UL1 TR000448, Subaward KL2 TR000450, from the National Center for Advancing Translational Sciences (NCATS). K.S.M. was supported by NIH National Institute of Diabetes and Digestive and Kidney Diseases Grant T32-DK007120. J.Y. was supported by Washington University Institute of Clinical and Translational Sciences NIH Grant UL1 TR000448, Subaward KL2 TR000450. T.E.H. and J.M.E. were supported by NIH National Institute of Diabetes and Digestive and Kidney Diseases Grant R01 DK101946. C.C.W. and S.K.P were supported by NIH National Institute on Aging Grant R01 AG031867. This work was also supported by the cores of the Washington University Nutrition Obesity Research Center (Grant P30 DK56341), Diabetes Research Center (DRC) (Grant P30 DK020579), the Metabolomics Facility at Washington University (Grant P30 DK056341), and the Washington University NIH National Institute of General Medical Sciences Biomedical Mass Spectrometry Resource (Grant P41 GM103422) to F.-F.H.; the Washington University Genome Technology Access Center in the Department of Genetics (Grant P30 CA91842); and the Department of Pathology DRC Electron Microscopy Facility (Grant P60 DK020579). The authors declare no conflicts of interest.

Figures

Figure 1
Figure 1
Generation of mouse models with muscle-specific lipin 1 deficiency. A) Schematic showing Lpin1 gene-targeting strategy for generation of truncated lipin 1. MCK-Lpin1Δ115 animals were generated using LoxP sites flanking exons 3 and 4 of lipin 1, which encode the principal start codon. MCK-driven Cre recombination led to enforcement of an alternative start codon in exon 5. B) Western blot analysis of gastrocnemius, heart, liver, and eWAT from WT and MCK-Lpin1Δ115 mice. C) PAP activity in vastus, heart, liver, and eWAT of WT and MCK-Lpin1Δ115 mice. Data are shown as means ± sem. *P < 0.05 (Student’s t test) for differences in MCK-Lpin1Δ115 compared with WT mice. n = 5–6 and animals were 3–4 mo old. D) Schematic showing Lpin1 gene-targeting strategy for generation of full-protein knockout of lipin 1. MCK-Lpin1−/− animals were generated with LoxP sites flanking exon 7 of lipin 1, and MCK-driven Cre recombination led to complete ablation of the lipin 1 protein. Western blot analysis of gastrocnemius, heart, liver, and eWAT from WT and MCK-Lpin1−/− mice 3–4 mo old; n = 5.
Figure 2
Figure 2
Mice with muscle-specific Lpin1 deficiency exhibit active and progressive myopathy. A) H&E stains of skeletal muscle cross sections from MCK-Lpin1Δ115 and MCK-Lpin1−/− mice with respective age-matched WT controls at 3–4 mo and 1 yr old. Field width is ∼200 µm. B) Quantitative RT-PCR performed to quantify expression of the indicated genes from MCK-Lpin1Δ115 mice 3–4 mo and 1 yr old. Various markers of macrophage, proinflammatory cytokines, necrosis, and muscle regeneration were measured. Values were normalized (1.0) to age-matched WT mice, and data are shown as means ± sem. *P < 0.05 (Student’s t test) for differences in MCK-Lpin1Δ115 compared with age-matched WT mice; n = 7–9.
Figure 3
Figure 3
Microarray analysis of MCK-Lpin1Δ115. A) Standardized heat map of differentially expressed mRNAs from microarray of vastus from mice 3–4 mo old, using unsupervised hierarchical clustering selected at FDR <0.05. B) Pathway analyses of vastus muscle gene-expression microarray studies. The top 15 significantly changed cellular pathways up- and down-regulated are listed to highlight significant transcriptional alterations of MCK-Lpin1Δ115 (vs. WT) studied; n = 4.
Figure 4
Figure 4
Mice with muscle-specific Lpin1 deficiency exhibit muscle lipid accumulation of G3P lipid and exhibit muscle accumulation of cardiolipin. A) Electron micrographs of lipid droplets in soleus muscle. A greater area of lipid droplets is present in both the contractile and sarcolemmal regions of the muscle fiber in 3–4-mo-old MCK-Lpin1Δ115 mice. Field width is ∼6 µm. B) The pathway schematic depicts the synthesis of TAG from G3P. Circled is lipin 1, the primary skeletal muscle PAP enzyme, and DAG. Also depicted is the PA branch with downstream phospholipids, including PG and CL. C, D) PA, DAG, and TAG from vastus and gastrocnemius muscles of MCK-Lpin1Δ115 and MCK-Lpin1−/− mice, respectively, were assessed via LC-MS analysis. E, F) PG and tetra linoleoyl CL (18:2/18:2)2 from vastus and gastrocnemius muscles of MCK-Lpin1Δ115 and MCK-Lpin1−/− mice with respective WT littermate controls were assessed via LC-MS analysis. Values were normalized (1.0) to age-matched WT mice (3–4 mo), and data are shown as means ± sem. *P < 0.05 (Student’s t test) for differences in MCK-Lpin1Δ115 or MCK-Lpin1−/− compared with respective WT littermate mice; n = 5–7.
Figure 5
Figure 5
Mice with muscle-specific Lpin1 deficiency exhibit mitochondrial accumulation and abnormalities with noneffectual alterations in muscle fiber–type composition. A) Tom20 staining (bright punctate pattern) of vastus muscle in MCK-Lpin1−/− mice 3–4 mo and 1 yr old. B) Protein quantity per tissue weight of mitochondrial fraction and mtDNA content in MCK-Lpin1Δ115 mice and age-matched WT controls. C) Succinate dehydrogenase staining of skeletal muscle cross sections from MCK-Lpin1−/− mice with respective age-matched WT controls at 3–4 mo and 1 yr of age. Red arrows indicate examples of “ragged blue fibers,” which show intense, irregular staining of succinate dehydrogenase in the periphery of muscle fibers. Field width is ∼400 µm. D) Quantitative RT-PCR to quantify expression of muscle fiber types (type 1, 2A, 2X, and 2B) via assessing myosin heavy-chain genes in MCK-Lpin1−/− mice 3–4 mo and 1 yr old. Values were normalized (1.0) to age-matched WT mice (3–4 mo), and data are shown as means ± sem. *P < 0.05 (Student’s t test) for differences in MCK-Lpin1Δ115 or MCK-Lpin1−/− compared with respective WT littermate mice; n = 6–7 for MCK-Lpin1Δ115 and WT controls; n = 10–11 for MCK-Lpin1−/− and WT controls.
Figure 6
Figure 6
Mice with muscle-specific Lpin1 deficiency display mitochondrial abnormalities and noneffectual alterations in muscle fiber–type composition. A) Quantitative RT-PCR to quantify expression of muscle fiber types (type 1, type 2A, type 2X, and type 2B) via assessing myosin heavy-chain genes in MCK-Lpin1Δ115 and MCK-Lpin1−/− mice at 3–4 mo old. Values were normalized (1.0) to age-matched WT mice, and data are shown as means ± sem. *P < 0.05 (Student’s t test) for differences in MCK-Lpin1Δ115 or MCK-Lpin1−/− compared with respective WT littermate mice. n = 10–11. B) Electron micrographs of lipid droplets in soleus muscle showing swollen and rarefied mitochondria in MCK-Lpin1Δ115 and MCK-Lpin1−/− mice in the intermyofibrillar and subsarcolemmal space. Field width is ∼3 µm. C) Oxygen flux indicating mitochondrial respiration for Leak (state 2 respiration), oxphos (state 3 respiration), electron transport system (ETS; uncoupled respiration), and respiratory control ratio (RCR), the oxphos:Leak. Values are shown as means ± sem. *P < 0.05 (Student’s t test) for differences in MCK-Lpin1−/− compared with WT littermate mice; n = 8.
Figure 7
Figure 7
MCK-Lpin1Δ115 mice display autophagy in skeletal muscle. A) Increased p62 protein abundance in tibialis anterior muscles of vehicle-treated MCK-Lpin1Δ115 mice compared with WT. With 2 d of intraperitoneal injections of 0.4 mg/kg colchicine, although p62 abundance is increased, there was no increase in LC3-II protein abundance detected in MCK-Lpin1Δ115 despite increased LC3-II in WT. Values were normalized (1.0) to age-matched WT mice (3–4 mo) treated with vehicle, and data are shown as means ± sem. *P < 0.05 (ANOVA post hoc) for differences in MCK-Lpin1Δ115 compared with WT littermate mice. N.s., nonspecific band. n = 5/condition. B) Increased p62, LC3-I, and LC3-II protein abundance in mitochondrial fraction from vastus muscles of MCK-Lpin1−/− of 1-yr-old mice compared with WT controls. VDAC is a mitochondrial-specific loading control. Values were normalized (1.0) to age-matched WT mice (3–4 mo) treated with vehicle, and data are shown as means ± sem. *P < 0.05 (Student’s t test) for differences in MCK-Lpin1−/− compared with WT littermate mice; n = 5–6. C) Increased abundance of Tom20, p62, LC3, and BNIP3 in vastus muscle fiber from 1-yr-old WT or MCK-Lpin1−/− mice. The third column overlay is Tom20 (green), and p62, LC3, or BNIP3 (red).
Figure 8
Figure 8
MCK-Lpin1Δ115 and MCK-Lpin1−/− mice have altered exercise endurance and increased exercise plasma creatine kinase when unfed. A, C) Exercise endurance time to exhaustion in 3–4-mo-old and 1-yr-old MCK-Lpin1Δ115, respectively. B, D) Exercise endurance time to exhaustion in 3–4-mo-old and 1-yr-old MCK-Lpin1−/−, respectively. Additionally, plasma creatine kinase is elevated in MCK-Lpin1−/− mice compared with their WT controls. Sedentary indicates that plasma creatine kinase was measured under fed and rested conditions; 3-h post-ex indicates that plasma creatine kinase was measured after being unfed overnight, and 3 h after the time to exhaustion in an acute bout of treadmill exercise. Data are shown as means ± sem. *P < 0.05 (Student’s t test) for differences in MCK-Lpin1Δ115 or MCK-Lpin1−/− compared with respective WT littermate mice; n = 7–9.

References

    1. Harris T. E., Finck B. N. (2011) Dual function lipin proteins and glycerolipid metabolism. Trends Endocrinol. Metab. 22, 226–233 10.1016/j.tem.2011.02.006 - DOI - PMC - PubMed
    1. Han G. S., Wu W. I., Carman G. M. (2006) The Saccharomyces cerevisiae lipin homolog is a Mg2+-dependent phosphatidate phosphatase enzyme. J. Biol. Chem. 281, 9210–9218 10.1074/jbc.M600425200 - DOI - PMC - PubMed
    1. Finck B. N., Gropler M. C., Chen Z., Leone T. C., Croce M. A., Harris T. E., Lawrence J. C., Jr., Kelly D. P. (2006) Lipin 1 is an inducible amplifier of the hepatic PGC-1alpha/PPARα regulatory pathway. Cell Metab. 4, 199–210 10.1016/j.cmet.2006.08.005 - DOI - PubMed
    1. Peterson T. R., Sengupta S. S., Harris T. E., Carmack A. E., Kang S. A., Balderas E., Guertin D. A., Madden K. L., Carpenter A. E., Finck B. N., Sabatini D. M. (2011) mTOR complex 1 regulates lipin 1 localization to control the SREBP pathway. Cell 146, 408–420 10.1016/j.cell.2011.06.034 - DOI - PMC - PubMed
    1. Kim H. B., Kumar A., Wang L., Liu G. H., Keller S. R., Lawrence J. C., Jr., Finck B. N., Harris T. E. (2010) Lipin 1 represses NFATc4 transcriptional activity in adipocytes to inhibit secretion of inflammatory factors. Mol. Cell. Biol. 30, 3126–3139 10.1128/MCB.01671-09 - DOI - PMC - PubMed

Publication types