Review
. 2018 Sep;188(9):1936-1948.
doi: 10.1016/j.ajpath.2018.05.021. Epub 2018 Jul 18.

Mechanistic Insights into Colorectal Cancer Phenomics from Fundamental and Organotypic Model Studies

Affiliations
Review

Mechanistic Insights into Colorectal Cancer Phenomics from Fundamental and Organotypic Model Studies

Frederick C Campbell et al. Am J Pathol. 2018 Sep.

Abstract

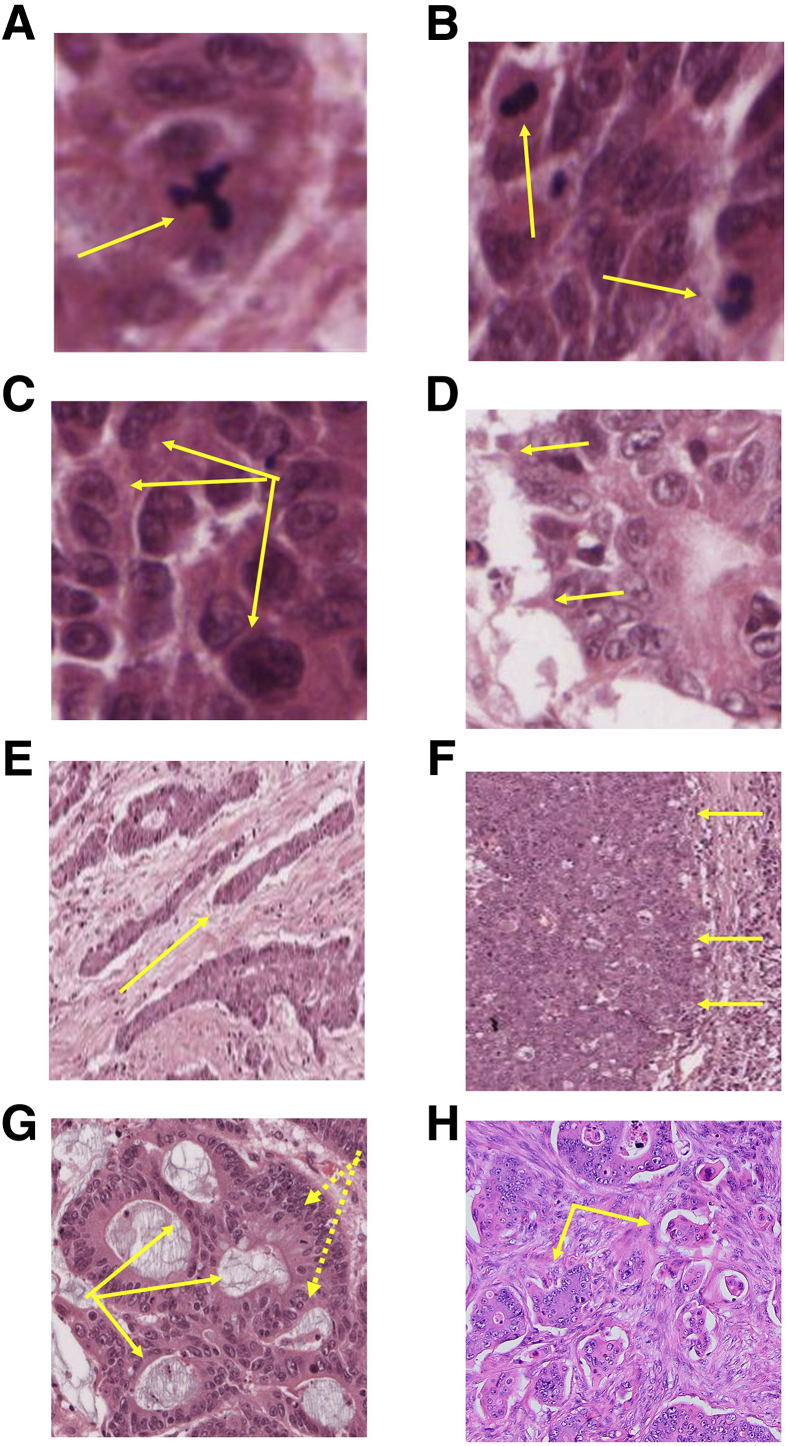
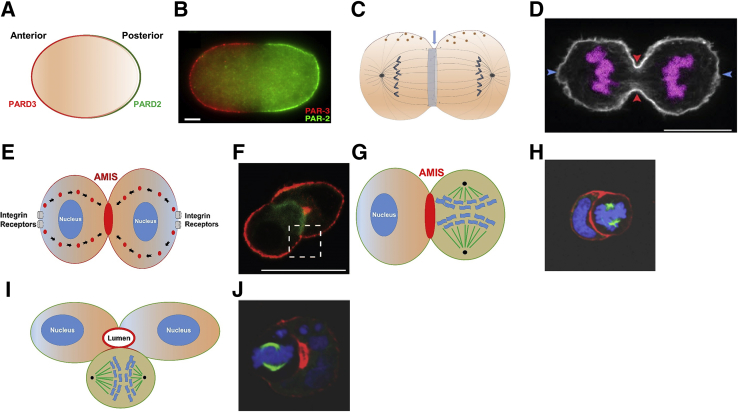
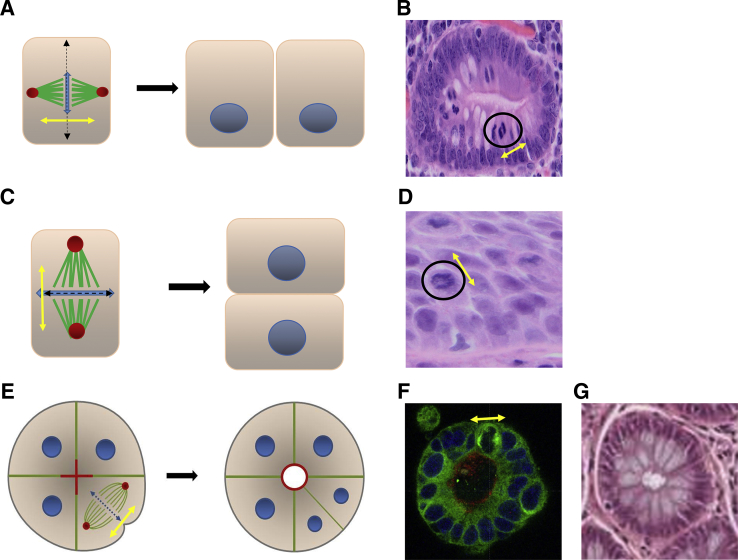
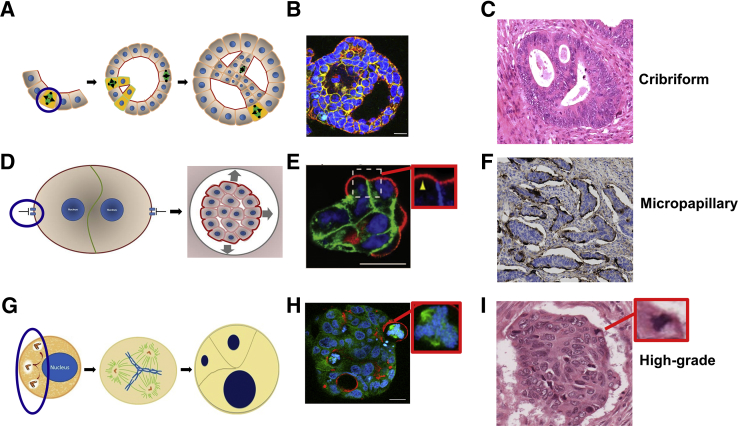
Colorectal cancer (CRC) diagnosis and prognostic stratification are based on histopathologic assessment of cell or nuclear pleomorphism, aberrant mitotic figures, altered glandular architecture, and other phenomic abnormalities. This complexity is driven by oncogenic perturbation of tightly coordinated spatiotemporal signaling to disrupt multiple scales of tissue organization. This review clarifies molecular and cellular mechanisms underlying common CRC histologic features and helps understand how the CRC genome controls core aspects of tumor aggressiveness. It further explores a spatiotemporal framework for CRC phenomics based on regulation of living cells in fundamental and organotypic model systems. The review also discusses tissue homeostasis, considers distinct classes of oncogenic perturbations, and evolution of cellular or multicellular cancer phenotypes. It further explores the molecular controls of cribriform, micropapillary, and high-grade CRC morphology in organotypic culture models and assesses relevant translational studies. In addition, the review delves into complexities of morphologic plasticity whereby a single molecular signature generates heterogeneous cancer phenotypes, and, conversely, morphologically homogeneous tumors show substantive molecular diversity. Principles outlined may aid mechanistic interpretation of omics data in a setting of cancer pathology, provide insight into CRC consensus molecular subtypes, and better define principles for CRC prognostic stratification.


Figures

Figure 1
Figure 1
Phenotypes within the colorectal cancer (CRC) phenome (arrows). A: A multipolar mitotic figure. B: Increased mitotic figure frequency. C: Nuclear pleomorphism. D: Invadopodia. E: Infiltrative invasion patterns showing cords of tumor cells. F: Expansive invasion along a broad front. G: Cribriform morphology comprising multiple back to back lumens (solid arrows) surrounded by stratified epithelium (dotted arrows). H: Micropapillary morphology showing cohesive groups of tumor cells surrounded by lacunar spaces. All stains by hematoxylin and eosin. Original magnification: ×40 (AD); ×5 (E and F), ×10 (G and H).
Figure 2
Figure 2
Transition to multicellularity. A and B: In the one-cell zygote, fertilization triggered asymmetric redistribution of anterior [partitioning defective (PARD3; alias PAR-3)] and posterior (PARD2; alias PAR-2) polarity determinants within the cortex.A: Schematic showing cortical localization of anterior (PARD3) and posterior (PARD2) polarity determinants. B:Caenorhabditis elegans zygote, stained for PAR-3 (PARD3; red) and PAR-2 (PARD2; green). Other polarity determinants are not shown. C and D: Conserved polarization processes enabled bipolar mitotic spindle assembly, positioning of the cleavage furrow, and cell membrane expansion in epithelial cells. C: Schematic shows that chromosomal DNA is linked by microtubules to spindle pole centrosomes that are anchored to the cell cortex by astral microtubules. Motor proteins drive equal genome segregation. Via microtubules, the spindle directed transport of lipid-containing vesicles (orange circles) to membrane growth regions. The actomyosin ring (light blue) provided the contractile force for cell cleavage (blue arrow), set perpendicular to the spindle plane.D: Advanced cytokinesis in an epithelial cell. Blue and red arrows indicate spindle poles and the cleavage furrows, respectively. Chromosomal DNA (purple). E and F: After completion of cytokinesis, the new cell doublet engaged extracellular matrix (ECM) via cell membrane integrin receptors. This process promoted transcytosis of membrane components from the basal domain to the cell–cell contact region that becomes the apical membrane initiation site (AMIS). E: Schematic shows integrin/ECM-mediated trancytosis of membrane components with apical characteristics (red circles) from basolateral domains to the AMIS (red oval). F: Early epithelial cell doublet stained for Podxl (apical marker) and β-integrin green fluorescent protein (GFP). Podxl was expressed at the ECM-facing basolateral membrane and underwent directed vesicular transport to the nascent AMIS. Boxed area was selected for high power (HP) magnification in original study (not shown).G and H: From the two-cell stage, the mitotic spindle controlled the alignment of apical membrane components. G: Schematic shows developing AMIS at contact site between resting and dividing cells of the doublet. H: Caco-2 doublet containing resting and dividing cells stained for DNA (blue), tubulin (green), and filamentous actin (red). I and J: In subsequent divisions, the spindle was oriented to maintain apical membrane position in the center of developing glands, surrounded by an epithelial monolayer. I: Schematic showing orientation of a cell monolayer around central lumen. J: Developing Caco-2 glandular structure (gland) containing resting cells and one dividing cell, stained for DNA (blue), tubulin (green), and filamentous actin (red). Scale bars: 5 μm (B); 10 μm (D); 20 μm (F).
Figure 3
Figure 3
Multicellular patterning. A: Schematic shows that mitotic spindle plane (double-headed yellow arrow in A, C, and E) determined the axis of cell division (dashed double-headed arrow in A, C, and E). Double-headed blue arrow indicates genomic DNA (A and C). Spindle alignment at 70- to 90-degree angles in relation to the cell long axis generated columnar daughter cells. B: Colonic crypt showing mitotic figure (black circle) aligned at approximately 70 degrees (double headed yellow arrow) toward cell long axis (hematoxylin and eosin staining). C: Schematic shows that spindle alignment parallel to cell long axis generated layered, stratified epithelium.D: Section of esophageal mucosa with mitotic figure (circle), spindle alignment parallel to cell long axis and stratified epithelium. (Hematoxylin and eosin staining). E: Schematic shows that appropriately oriented mitotic spindle promoted a rounded configuration of a columnar epithelial monolayer with a uniform apical membrane that encircled a single central lumen. Cleavage furrow ingression shown at spindle midpoint. Transapical secretion promoted lumen expansion.F: Organotypic Caco-2 culture stained for the apical membrane marker protein kinase C ζ (PKCζ; red), α-tubulin for spindle microtubules, and DAPI for DNA. Mitotic spindle plane indicated by double-headed yellow arrow. These features resembled normal colonic glandular architecture in cross section. G: Staining hematoxylin and eosin. Original magnification: ×20 (B and G); ×40 (D).
Figure 4
Figure 4
Oncogenic perturbations and evolution of cancer-evocative morphology. Evolution of multicellular architecture consistent with cribriform (AC), micropapillary (DF), and high-grade (GI) cancer morphology. The causal morphogenic defect is highlighted by a blue oval or circle in each cartoon. A: Misorientation of the mitotic spindle to lie parallel to the cell long axis (blue circle) induced inappropriate epithelial stratification (yellow cells) and generation of ectopic apical membrane foci (red) that become expanded by secretion to form multiple lumens. In combination, these phenomena promote development of back-to-back lumens bordered by atypical stratified epithelium. B: Cribriform morphology phenotype induced by mitotic spindle misorientation in three-dimensional Caco-2 organotypic. Staining DAPI for DNA, protein kinase C ζ (PKCζ) for apical membrane, and β-catenin for basolateral membranes. These features were evocative of cribriform colorectal cancer (CRC) morphology. C: Staining hematoxylin and eosin. D: Schematic shows that blockade of extracellular matrix (ECM):integrin receptor signaling (blue oval) impeded transcytosis, causing retention of apical membrane (AM) functional components at the ECM-facing basolateral membrane. Inverted multicellular polarity enabled outward secretion. E: Inverted polarity and expression of the AM marker podocalyxin (red), at the ECM-facing basolateral membrane in organotypic culture. The boxed area inset shows a high power view of podocalyxin accumulation at the basolateral membrane (yellow arrowhead). F: These features were evocative of micropapillary CRC morphology, stained by MUC1 immunohistochemistry. The Muc1 AM marker is localized on the ECM-facing exterior of cohesive cell nests, surrounded by clear lacunar spaces. In cancer cells, supernumerary centrosomes were common. G: Impaired clustering of extra centrosomes (blue oval) drove multipolar mitotic spindle formation. In a proportion of cells, these changes promoted multipolar division and pleomorphic progeny.H: Representative changes in three-dimensional organotypic culture of Caco-2 clones. Forced multipolar spindle formation (inset, shown at higher magnification) was accompanied by gross cellular and nuclear pleomorphism, dispersed apical membrane foci (red), and loss of glandular architecture. Genomically unstable cells with multipolar spindles frequently extend across the basement membrane:ECM interface. Staining DAPI for DNA; PKCζ for apical membrane, and α-tubulin for microtubules. These changes were evocative of high-grade CRC morphology. I: Loss of glandular architecture, cellular and nuclear pleomorphism, and atypical mitotic figure (inset, shown at higher magnification) at basement membrane:ECM interface in a high-grade CRC histological section. Staining hematoxylin and eosin. Scale bars: 20 μm (B, E and H). Original magnification: ×10 (C and F); ×20 (I).

References

    1. Heng Y.J., Lester S.C., Tse G.M., Factor R.E., Allison K.H., Collins L.C., Chen Y.Y., Jensen K.C., Johnson N.B., Jeong J.C., Punjabi R., Shin S.J., Singh K., Krings G., Eberhard D.A., Tan P.H., Korski K., Waldman F.M., Gutman D.A., Sanders M., Reis-Filho J.S., Flanagan S.R., Gendoo D.M., Chen G.M., Haibe-Kains B., Ciriello G., Hoadley K.A., Perou C.M., Beck A.H. The molecular basis of breast cancer pathological phenotypes. J Pathol. 2017;241:375–391. - PMC - PubMed
    1. Ciriello G., Miller M.L., Aksoy B.A., Senbabaoglu Y., Schultz N., Sander C. Emerging landscape of oncogenic signatures across human cancers. Nat Genet. 2013;45:1127–1133. - PMC - PubMed
    1. Kholodenko B.N., Hancock J.F., Kolch W. Signalling ballet in space and time. Nat Rev Mol Cell Biol. 2010;11:414–426. - PMC - PubMed
    1. Hoadley K.A., Yau C., Hinoue T., Wolf D.M., Lazar A.J., Drill E., Shen R., Taylor A.M., Cherniack A.D., Thorsson V., Akbani R., Bowlby R., Wong C.K., Wiznerowicz M., Sanchez-Vega F., Robertson A.G., Schneider B.G., Lawrence M.S., Noushmehr H., Malta T.M., Cancer Genome Atlas Network. Stuart J.M., Benz C.C., Laird P.W. Cell-of-origin patterns dominate the molecular classification of 10,000 tumors from 33 types of cancer. Cell. 2018;173:291–304.e6. - PMC - PubMed
    1. Lechler T., Fuchs E. Asymmetric cell divisions promote stratification and differentiation of mammalian skin. Nature. 2005;437:275–280. - PMC - PubMed

Publication types