. 2018 Jul 19;71(2):229-243.e11.
doi: 10.1016/j.molcel.2018.06.041.

Translational Control through Differential Ribosome Pausing during Amino Acid Limitation in Mammalian Cells

Affiliations

Translational Control through Differential Ribosome Pausing during Amino Acid Limitation in Mammalian Cells

Alicia M Darnell et al. Mol Cell. .

Abstract

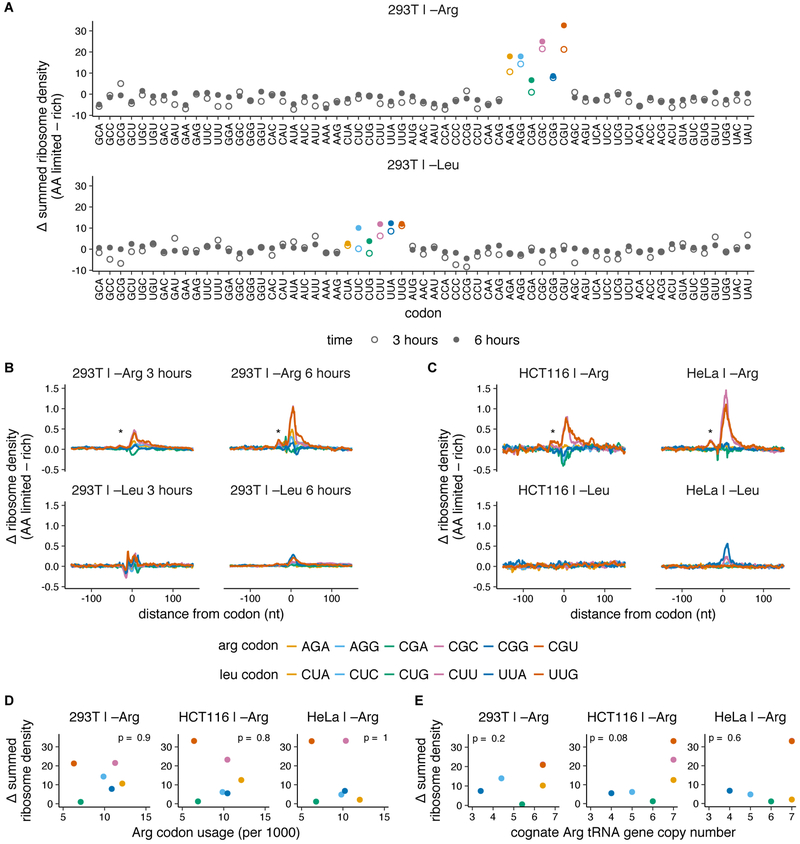
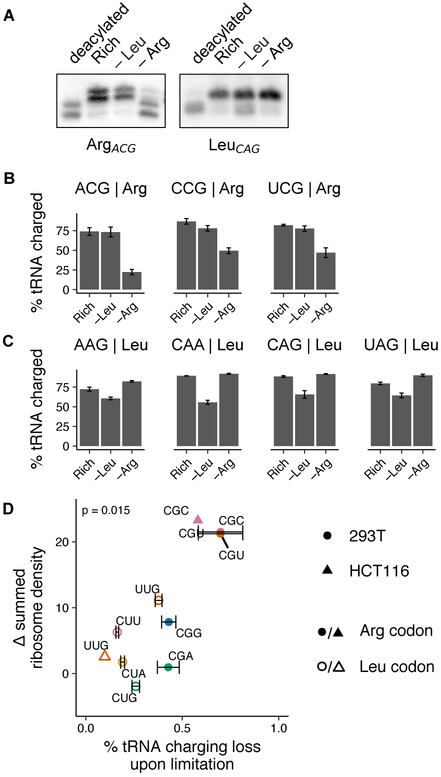
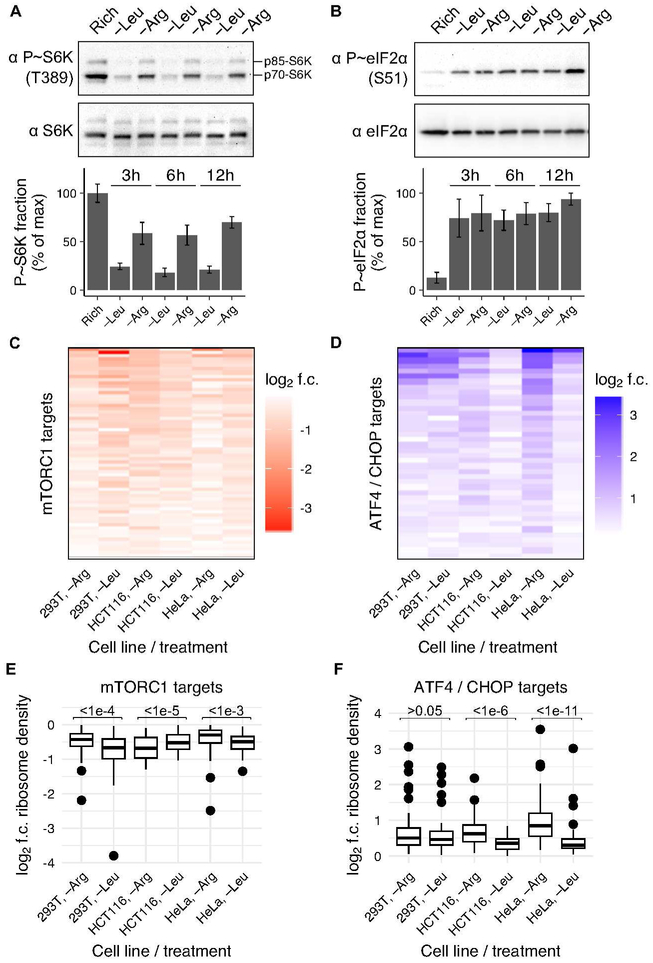
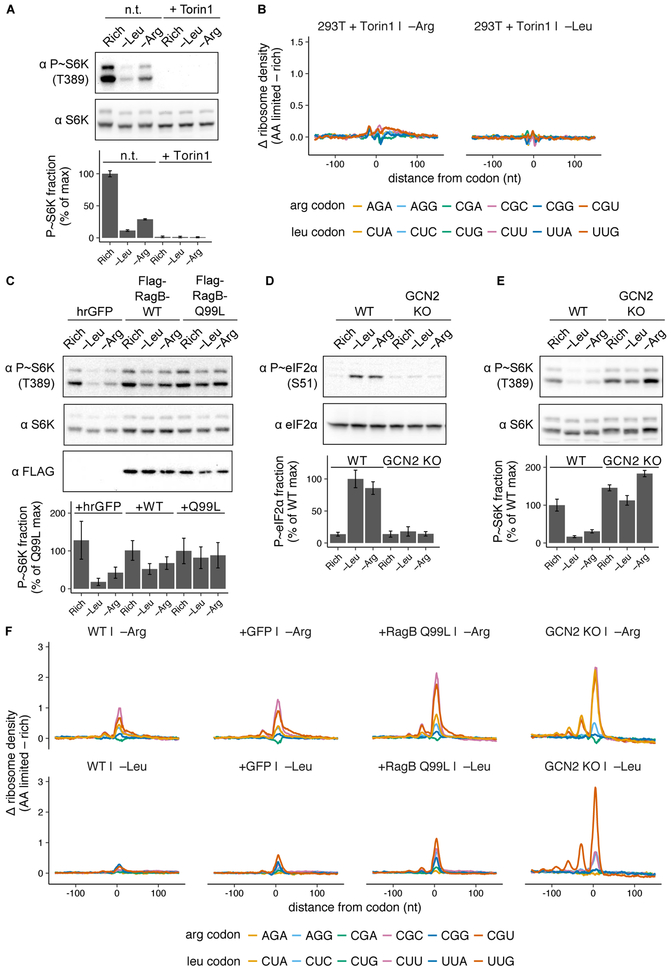
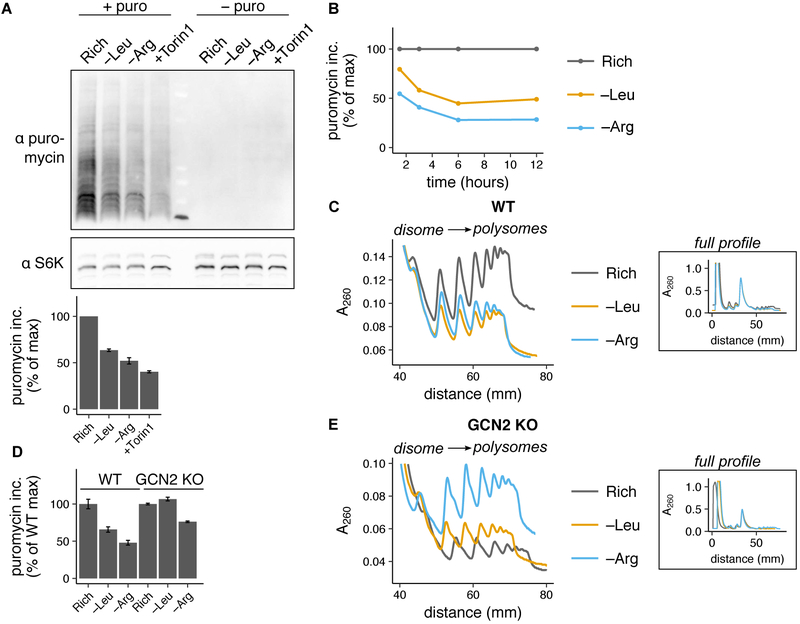
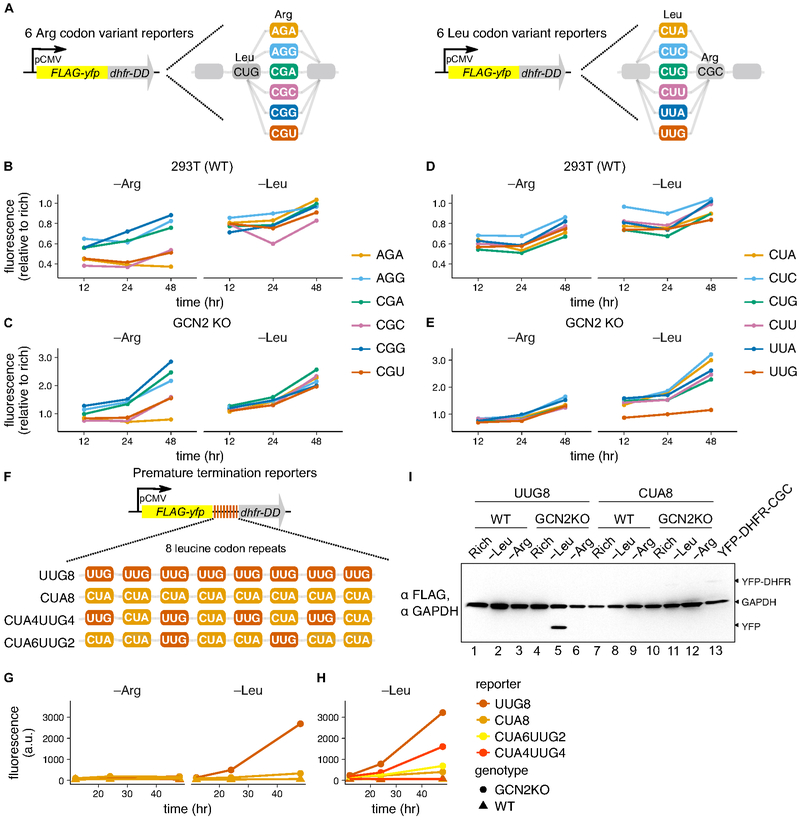
Limitation for amino acids is thought to regulate translation in mammalian cells primarily by signaling through the kinases mTORC1 and GCN2. We find that a selective loss of arginine tRNA charging during limitation for arginine regulates translation through ribosome pausing at two of six arginine codons. Surprisingly, limitation for leucine, an essential and abundant amino acid in protein, results in little or no ribosome pausing. Chemical and genetic perturbation of mTORC1 and GCN2 signaling revealed that their robust response to leucine limitation prevents ribosome pausing, while an insufficient response to arginine limitation leads to loss of tRNA charging and ribosome pausing. Ribosome pausing decreases protein production and triggers premature ribosome termination without reducing mRNA levels. Together, our results suggest that amino acids that are not optimally sensed by the mTORC1 and GCN2 pathways still regulate translation through an evolutionarily conserved mechanism based on codon-specific ribosome pausing.

Keywords: GCN2; amino acid starvation; arginine; codon usage; leucine; mTOR; premature termination; ribosome pausing; ribosome profiling; translational control.


Conflict of interest statement

Declaration of Interests

The authors declare no competing interests.

Figures

Fig. 1
Fig. 1. Codon-specific ribosome pausing emerges during limitation for arginine, but not leucine.
(A-C) Changes in codon-specific ribosome density in HEK293T cells, HCT116, and HeLa cells upon 3 or 6 hours of leucine or arginine limitation. Ribosome density for each codon is calculated relative to the mean footprint density for each coding sequence, and is averaged over all occurrences of the codon across detectably expressed transcripts (see Methods for details). The difference in ribosome density between amino acid limited and rich conditions across a 150 nt window around each codon is summed (A) or shown as such (B,C) (* = trailing ribosome stalled behind the paused ribosome). Arg and Leu codons are colored according to legend in B,C (D-E) The summed change in ribosome density at arginine codons following 3 hours of arginine limitation in each cell line (see A, S1H) is compared to the transcriptome usage frequency of Arg codons (see Fig. S1J) (D) or genomic copy number of the cognate tRNA for each Arg codon (see Fig. S1K) (E). Arg and Leu codons are colored according to legend in B,C. p indicates p-value of Spearman’s rank coefficient, ρ and is shown at the top of each plot (in D: HEK293T, ρ = −0.1; HCT116, ρ = −0.14; HeLa, ρ = 0.03. In E: HEK293T, ρ = 0.58; HCT116, ρ = 0.76; HeLa, ρ = 0.27).
Fig. 2
Fig. 2. Selective loss of cognate tRNA charging during arginine limitation.
(A) Representative northern blots for determination of Arg and Leu tRNA charging levels (as shown in B) in HEK293T cells following 3 hours of limitation for leucine or arginine or growth in rich medium. A control deacylated total RNA sample is used to identify uncharged tRNA species. tRNA probe is indicated below each blot (see Methods for details on interpretation, quantification, and probe design; see Fig. S2 for additional blots). (B-C) tRNA charging levels for 3 Arg (B) and 4 Leu tRNAs (C) in HEK293T cells following 3 hours of leucine or arginine limitation or growth in rich medium (calculated as described in Methods). tRNA anticodon and isotype are indicated above plots; error bars represent the standard error of the mean from three technical replicates (see A and Fig. S2 for additional representative blots and Fig. S1L for codon-tRNA pairs). (D) The summed change in ribosome density at arginine and leucine codons following 3 hours of leucine or arginine limitation in HEK293T and HCT116 cells (see Fig. 1A) is plotted against the loss in charging for the cognate tRNA (for those measured) in the same condition. p indicates p-value of Spearman’s rank coefficient, ρ and is shown at the top of the plot (ρ = 0.7).
Fig. 3
Fig. 3. Differential mTORC1 and GCN2 responses to arginine and leucine limitation.
(A,B) Representative western blots for phosphorylated and total levels of ribosomal protein S6 kinase 1 (S6K) (A) or eIF2α (B) in HEK293T cells after growth in rich medium or after 3, 6, or 12 hours of leucine or arginine limitation. Bar graph shows percent of protein that is phosphorylated in each condition, relative to the maximum. Error bars represent the standard error of the mean from three technical replicates. (C,D) Heatmap of log2 fold-change (f.c.) in ribosome density for mRNA targets of mTORC1 inhibition (Hsieh et al., 2012) (C) or GCN2 activation via ATF4/CHOP (Han et al., 2013) (D), following 3 hours of leucine or arginine limitation relative to growth in rich medium for HEK293T, HCT116, and HeLa cells. Only targets with a log2 fold change of < 0, for mTORC1 targets, or > 0, for ATF4/CHOP targets, were considered. In HEK293T, HCT116, and HeLa cells, 46/63 (73%), 14/63 (22%), and 45/63 (71%) of mTORC1 targets had higher ribosome density upon arginine than leucine limitation, respectively (C) and 26/40 (65%), 35/40 (88%), and 40/40 (100%) of GCN2 targets had higher ribosome density upon arginine than leucine limitation, respectively (D). (E,F) Box plot of the log2 fold change for each mTORC1 (E) or ATF4/CHOP (F) target upon amino acid limitation (as shown in C,D). A two-sided Wilcoxon signed rank test with continuity correction was performed with μ = 0; the resulting p-value is shown above each comparison (see Methods for details). In HEK293T, HCT116, and HeLa cells, the mTORC1 signaling response was 1.2-, 0.9-, and 1.1-fold higher during limitation for arginine, respectively (E) and the GCN2 signaling response was 1-, 1,2, and 1.5-fold higher during limitation for arginine, respectively (F).
Fig. 4
Fig. 4. Signaling through the mTORC1 and GCN2 pathways regulates the magnitude of ribosome pausing during amino acid limitation.
(A) Representative western blots for phosphorylated and total S6K in HEK293T cells after growth in rich medium or limitation for leucine or arginine for 3 hours, with or without (n.t.) 250 nM Torin1. Bar graph shows percent of protein that is phosphorylated, relative to the maximum; error bars represent the standard error of the mean from three technical replicates. (B) Changes in codon-specific ribosome density in the hrGFP cell line (as shown in C) after 3 hours of leucine or arginine limitation with 250 nM Torin1, relative to rich medium. (C) Representative western blots for phosphorylated S6K, total S6K, and FLAG after growth in rich medium, or 3 hours of leucine or arginine limitation in HEK293T cells stably expressing either hrGFP, FLAG-RagB-WT (RagB-WT), or FLAG-RagB-Q99L (RagB-Q99L). Bar graph shows percent of protein that is phosphorylated, relative to the maximum in the RagB-Q99L cell line; error bars represent the standard error of the mean from three technical replicates. (D,E) Representative western blots for phosphorylated and total eIF2α (D) or S6K (E) after growth in rich medium, or 3 hours of leucine or arginine limitation in the HEK293T (WT) or GCN2 KO cell lines. Bar graphs show percent of protein that is phosphorylated, relative to the maximum in WT cells; error bars represent the standard error of the mean from three technical replicates. (F) Changes in codon-specific ribosome density for WT, hrGFP, FLAG-RagB-Q99L, and GCN2 KO cell lines following 6 hours of limitation for leucine or arginine, relative to rich medium.
Fig. 5
Fig. 5. Ribosome pausing reduces global protein synthesis rate during amino acid limitation.
(A) Representative western blots for puromycin and S6K in HEK293T cells after (+ puro) or without (− puro) a pulse of 10 μg/mL puromycin following 3 hours of leucine or arginine limitation, treatment with 250 nM Torin1, or growth in rich medium. Bar graph shows puromycin incorporation relative to rich medium (calculated as described in Methods); error bars represent the standard error of the mean from three technical replicate experiments. (B) Puromycin incorporation in HEK293T cells following 1.5, 3, 6, or 12 hours of leucine or arginine limitation, relative to rich medium. (C) Polysome profiles from HEK293T (WT) cells following 6 hours of leucine or arginine limitation or growth in rich medium. The main plot shows overlaid polysome profiles starting at the disome (2 ribosome) peak and the inset plots show the entire profile, aligned with respect to the monosome peak height along the y-axis and position along the x-axis. (D) Puromycin incorporation in WT or GCN2 KO cell lines following 3 hours of leucine or arginine limitation, relative to rich medium (calculated as in described in Methods, see S5G for representative blots). Error bars represent the standard error of the mean for three technical replicates. (E) Polysome profiles (as described in C) from the GCN2 KO cell line following 6 hours of limitation for leucine or arginine or growth in rich medium.
Fig. 6
Fig. 6. Ribosome pausing reduces protein expression from reporter mRNAs and induces premature termination of translation.
(A) Arginine and leucine YFP codon variant reporter design (see Methods for details). (B-E) Mean YFP fluorescence in the HEK293T (WT) (B,D) or GCN2 KO cell lines (C,E) stably expressing the arginine (B,C) or leucine (D,E) YFP codon variant reporters, following limitation for leucine or arginine with 10 μM trimethoprim (+TMP) for 12, 24, or 48 hours, relative to rich medium +TMP. (F) Premature termination reporter design. A short linker of 8 tandem CUA or UUG leucine codons was added to the YFP-CUA reporter (as shown in A). (G,H) Mean YFP fluorescence in the WT or GCN2 KO cell lines stably expressing the UUG8, CUA8 (G,H) CUA6UUG2, or CUA4UUG4 (H) reporters following limitation for leucine or arginine for 12, 24, or 48 hours without TMP. (I) Western blot for FLAG epitope and GAPDH in the WT or GCN2 KO cell lines stably expressing the UUG8 or CUA8 reporters after growth in rich medium or 48 hours of leucine or arginine limitation. Lane 13 contains lysate from the YFP-WT reporter cell line for a full-length reporter size reference; GAPDH provides an intermediate size reference (see Fig. S6F for overexpressed image).

References

    1. Alexa A, and Rahnenfuhrer J (2016). topGO: Enrichment Analysis for Gene Ontology.
    1. Andreev DE, O’Connor PB, Fahey C, Kenny EM, Terenin IM, Dmitriev SE, Cormican P, Morris DW, Shatsky IN, and Baranov PV (2015). Translation of 5’ leaders is pervasive in genes resistant to eIF2 repression. ELife e03971. - PMC - PubMed
    1. Averous J, Lambert-Langlais S, Mesclon F, Carraro V, Parry L, Jousse C, Bruhat A, Maurin A-C, Pierre P, Proud CG, et al. (2016). GCN2 contributes to mTORC1 inhibition by leucine deprivation through an ATF4 independent mechanism. Sci. Rep 6, 27698. - PMC - PubMed
    1. Brandman O, and Hegde RS (2016). Ribosome-associated protein quality control. Nat. Struct. Mol. Biol 23, 7–15. - PMC - PubMed
    1. Buskirk AR, and Green R (2017). Ribosome pausing, arrest and rescue in bacteria and eukaryotes. Philos. Trans. R. Soc. Lond. B. Biol. Sci 372. - PMC - PubMed

Publication types

MeSH terms