. 2018 Sep 1;201(5):1468-1477.
doi: 10.4049/jimmunol.1701233. Epub 2018 Jul 20.

Myeloid Dendritic Cells Induce HIV Latency in Proliferating CD4+ T Cells

Affiliations

Myeloid Dendritic Cells Induce HIV Latency in Proliferating CD4+ T Cells

Nitasha A Kumar et al. J Immunol. .

Abstract

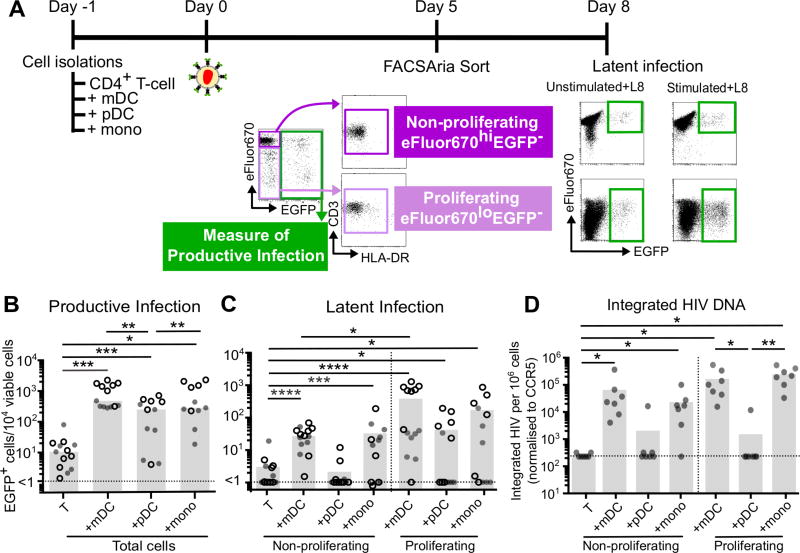
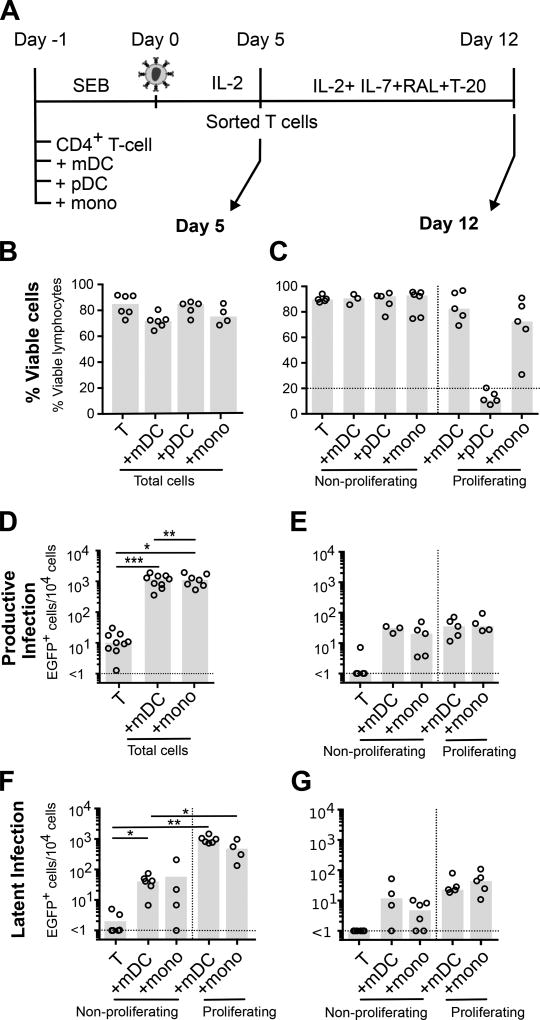
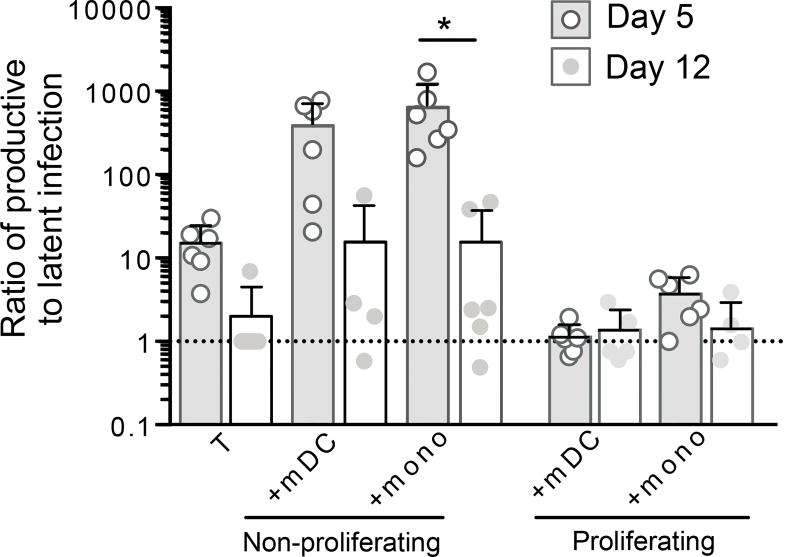
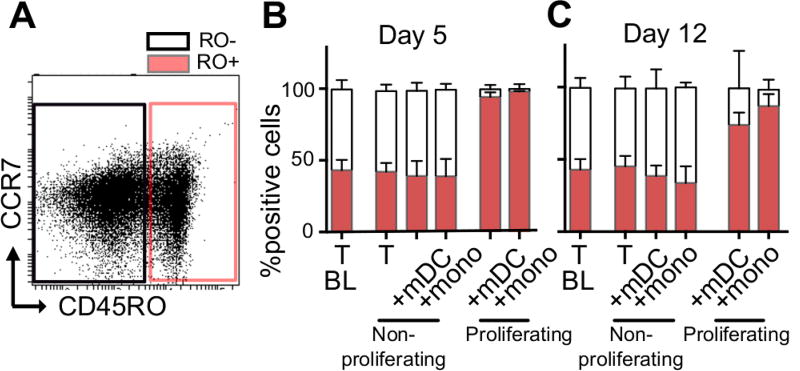
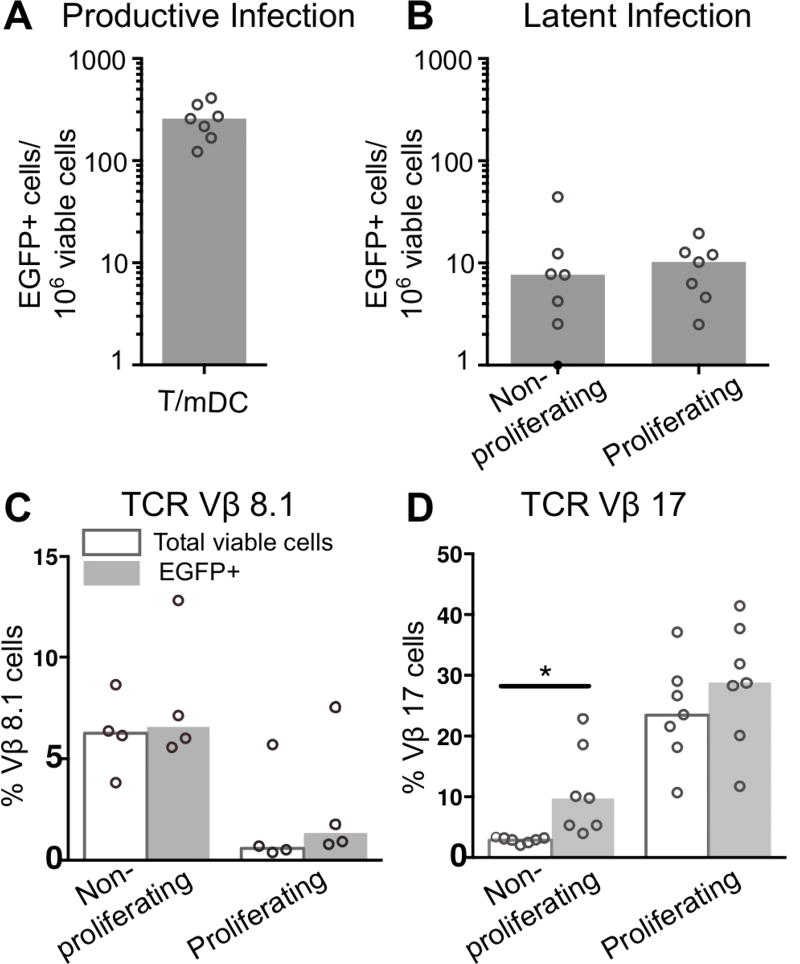
HIV latency occurs predominantly in long-lived resting CD4+ T cells; however, latent infection also occurs in T cell subsets, including proliferating CD4+ T cells. We compared the establishment and maintenance of latent infection in nonproliferating and proliferating human CD4+ T cells cocultured with syngeneic myeloid dendritic cells (mDC). Resting CD4+ T cells were labeled with the proliferation dye eFluor 670 and cultured alone or with mDC, plasmacytoid dendritic cells, or monocytes in the presence of staphylococcal enterotoxin B (SEB). Cells were cultured for 24 h and infected with CCR5-tropic enhanced GFP (EGFP) reporter HIV. Five days postinfection, nonproductively infected EGFP- CD4+ T cells that were either nonproliferating (eFluor 670hi) or proliferating (eFluor 670lo) were sorted and cultured for an additional 7 d (day 12) with IL-7 and antiretrovirals. At day 5 postinfection, sorted, nonproductively infected T cells were stimulated with anti-CD3/CD28, and induced expression of EGFP was measured to determine the frequency of latent infection. Integrated HIV in these cells was confirmed using quantitative PCR. By these criteria, latent infection was detected at day 5 and 12 in proliferating T cells cocultured with mDC and monocytes but not plasmacytoid dendritic cells, where CD4+ T cells at day 12 were poor. At day 5 postinfection, nonproliferating T cells expressing SEB-specific TCR Vβ-17 were enriched in latent infection compared with non-SEB-specific TCR Vβ-8.1. Together, these data show that both nonproliferating and proliferating CD4+ T cells can harbor latent infection during SEB-stimulated T cell proliferation and that the establishment of HIV latency in nonproliferating T cells is linked to expression of specific TCR that respond to SEB.


Conflict of interest statement

Conflict of interest

Authors have no conflict of interest to declare.

Figures

Figure 1
Figure 1. Productive and latent infection in non-proliferating and proliferating CD4+ T-cells
A. eFluor670 labelled resting CD4+ T-cells were cultured alone, with mDC, pDC or monocytes at a ratio of 10:1 (T-cell:DC), in the presence of staphylococcal enterotoxin B (SEB). After 24 hours, cultures were infected for 2 hours with a CCR5-tropic EGFP reporter virus, and at day 5 post infection, productive and latent infection was quantified. B. At day 5 post-infection, productive infection was measured by EGFP expression in total cells (n=13). C. Uninfected, non-proliferating (eFluor670hiEGFP−) and proliferating T-cells (eFluor670loEGFP−) were sorted by flow cytometry and latent infection was measured by stimulation with and without anti-CD3/CD28 in the presence of the integrase inhibitor L8. Latency was determined as the difference in EGFP expression between stimulated (stimulated+L8) and unstimulated cultures (unstimulated + L8; n=14). D. Latent infection was confirmed using qPCR to measure integrated HIV DNA (n=7). Open symbols represent experiments performed at the Burnet Institute (ARIA II, BD); shaded symbols represent experiments performed at The Peter Doherty Institute (Astrios, Beckman Coulter). Columns represent median, symbols represent results from individual donors. Significance was measured by Wilcoxon signed-rank test where n≥5, *p≤0.05, **p≤0.005, ***p≤0.0005, ****p≤0.0001.
Figure 2
Figure 2. Latency in non-proliferating and proliferating CD4+ T-cells is maintained in a subset of cells in vitro
Experimental conditions were as in Figure 1. A. A subset of sorted uninfected, non-proliferating and proliferating T-cells were cultured without stimulus for a further 7 days in the presence of IL-2, IL-7, HIV-1 fusion (T-20) and integrase inhibitors (L8 or Raltegravir; RAL) to measure stability of latent infection. Total cell culture viability was quantified by flow cytometry at B. day 5 (n=4–6); and C. day 12 (n=3–5). EGFP was quantified at D. day 5 (n=7–9); and E. day 12 (n=3–5) post-infection as a measure of productive infection. Latent infection was measured by quantification of EGFP expression following stimulation with anti-CD3/CD28 and IL-7 and in the presence of an integrase inhibitor at both F. day 5 (n=4–5); and G. day 12 (n=4–5). Columns represent the median; symbols represent results from individual donors. Significance was measured by a paired students T-test where n<5, and Wilcoxon signed-rank test where n≥5, *p≤0.05, **p≤0.005, ***p≤0.0005.
Figure 3
Figure 3. Proportion of productive and latent infection in non-proliferating and proliferating T cells
The frequency of EGFP expressing T-cells before (productive) and after (latent) anti-CD3/28 stimulation was used to determine the ratio of productive to latent infection at day 5 and 12 post-infection in non-proliferating and proliferating cells post coculture with mDC or monocytes (n=4–6). Columns represent median, symbols represent results from individual donors. Significance was measured by paired students T-test where n<5 and Wilcoxon signed-rank test where n≥5, *p≤0.05, **p≤0.005, ***p≤0.0005.
Figure 4
Figure 4. Expression of activation markers on non-proliferating and proliferating CD4+ T-cells
A. Experimental conditions were as in Figure 1. Proliferation in CD4+ T-cells cultured alone, with mDC or monocytes was measured by quantification of eFluor670lo/− cells (n=6). B. Ki67 was measured to confirm entry into cell cycle (n=7). Expression of early activation markers: C. CD25 (n=6); D. CD69 (n=6), and immune checkpoints (IC): E. Tim-3 (n=4); and F. PD-1 (n=4) were measured on sorted non-proliferating (eFlour670hiEGFP−) and proliferating (eFluor670loEGFP−) CD4+ T-cells. Columns represent the median and symbols represent results from individual donors. Significance was measured by paired students T-test where n<5 or Wilcoxon signed-rank test where n≥5, *p≤0.05, **p≤0.005, ***p≤0.0005.
Figure 5
Figure 5. CD4+ T-cell subsets in non-proliferating and proliferating cells
The phenotype of proliferating and non-proliferating T-cells following culture of T-cells alone, coculture with mDC or monocytes was determined at day 5 and 12 post-infection using antibodies binding to CD45RO. A. Representative dot plot of total viable T-cells showing CD45RO+ and CD45RO− gating strategy Proportion of CD45RO+ and CD45RO− T-cells at B. 5 days; and C. 12 days post infection (n=6). Columns represent the median with inter-quartile-range (IQR).
Figure 6
Figure 6. Vβ expression in non-proliferating and proliferating latently infected CD4+ T-cells
Resting CD4+ T-cells labelled with eFlour670 were cultured for 24 hours with mDC and infected with an EGFP reporter virus. A. Productive infection was measured at day 5 (n=7). At day 5 post-infection, cultures were sorted into non-productively infected, non-proliferating and proliferating CD4+ T-cells. B. Sorted non-proliferating and proliferating T-cells were stimulated using anti-CD3/CD28+integrase inhibitor for 72 hours, to measure latent infection (n=7), and stained with antibodies for C. weak SEB TCR Vβ-8.1 interactions (n=4) and D. strong SEB TCR Vβ-17 interaction (n=7). Columns represent the median in total (clear) or EGFP expressing T-cells (grey) and symbols represent results for individual donors. Significance was measured by paired students T-test where n<5 or Wilcoxon signed-rank test where n≥5, *p≤0.05, **p≤0.005, ***p≤0.0005.

References

    1. Chun TW, Finzi D, Margolick J, Chadwick K, Schwartz D, Siliciano RF. In vivo fate of HIV-1-infected T cells: quantitative analysis of the transition to stable latency. Nat Med. 1995;1:1284–90. - PubMed
    1. Finzi D, Hermankova M, Pierson T, Carruth LM, Buck C, Chaisson RE, Quinn TC, Chadwick K, Margolick J, Brookmeyer R, Gallant J, Markowitz M, Ho DD, Richman DD, Siliciano RF. Identification of a reservoir for HIV-1 in patients on highly active antiretroviral therapy. Science. 1997;278:1295–300. - PubMed
    1. Siliciano JD, Kajdas J, Finzi D, Quinn TC, Chadwick K, Margolick JB, Kovacs C, Gange SJ, Siliciano RF. Long-term follow-up studies confirm the stability of the latent reservoir for HIV-1 in resting CD4+ T cells. Nat Med. 2003;9:727–8. - PubMed
    1. Brenchley JM, Douek DC. HIV infection and the gastrointestinal immune system. Mucosal Immunol. 2008;1:23–30. - PMC - PubMed
    1. Chomont N, El-Far M, Ancuta P, Trautmann L, Procopio FA, Yassine-Diab B, Boucher G, Boulassel MR, Ghattas G, Brenchley JM, Schacker TW, Hill BJ, Douek DC, Routy JP, Haddad EK, Sekaly RP. HIV reservoir size and persistence are driven by T cell survival and homeostatic proliferation. Nat Med. 2009;15:893–900. - PMC - PubMed

Publication types

MeSH terms