. 2018 Jul 20;8(1):11013.
doi: 10.1038/s41598-018-29044-y.

Uncaria tomentosa improves insulin sensitivity and inflammation in experimental NAFLD

Affiliations

Uncaria tomentosa improves insulin sensitivity and inflammation in experimental NAFLD

Layanne C C Araujo et al. Sci Rep. .

Abstract

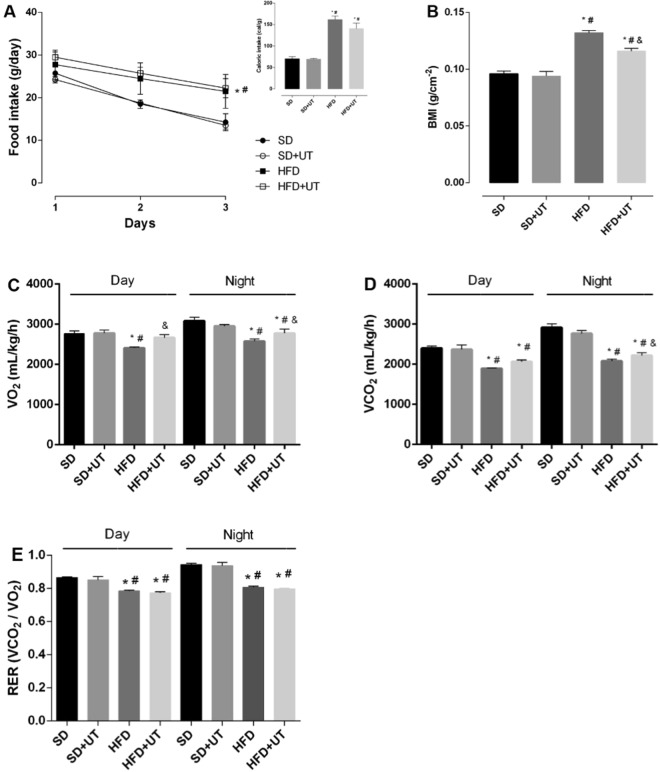
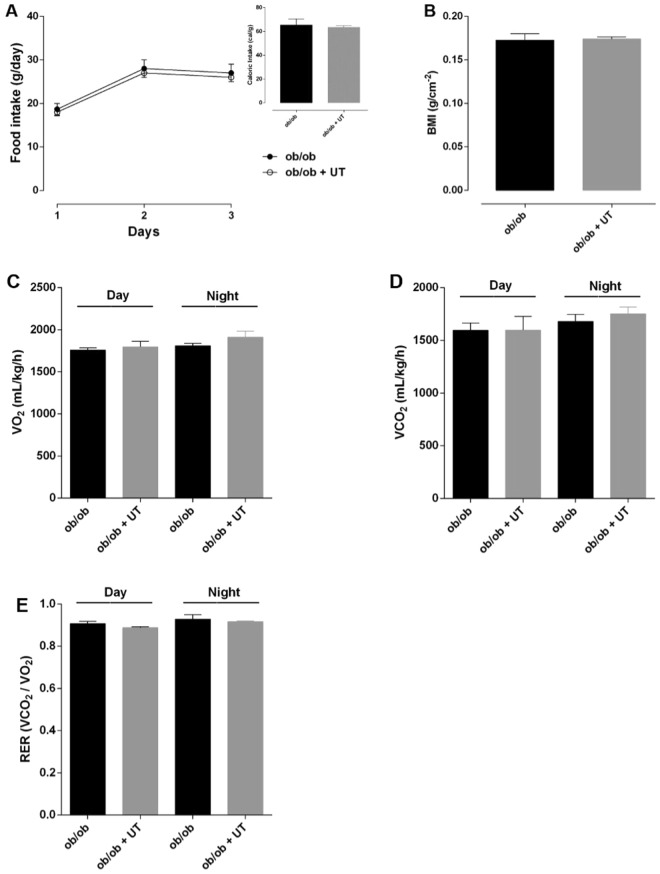
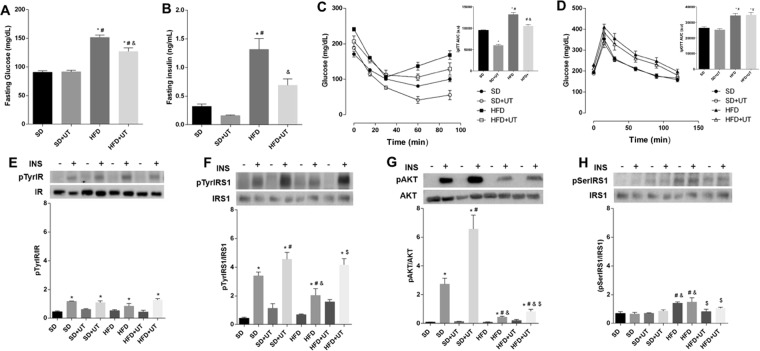
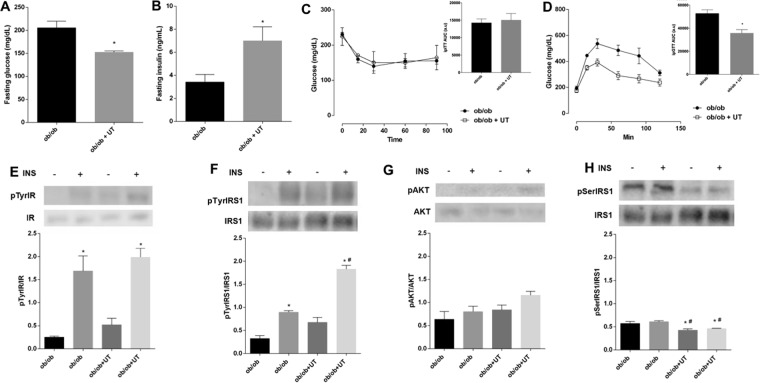
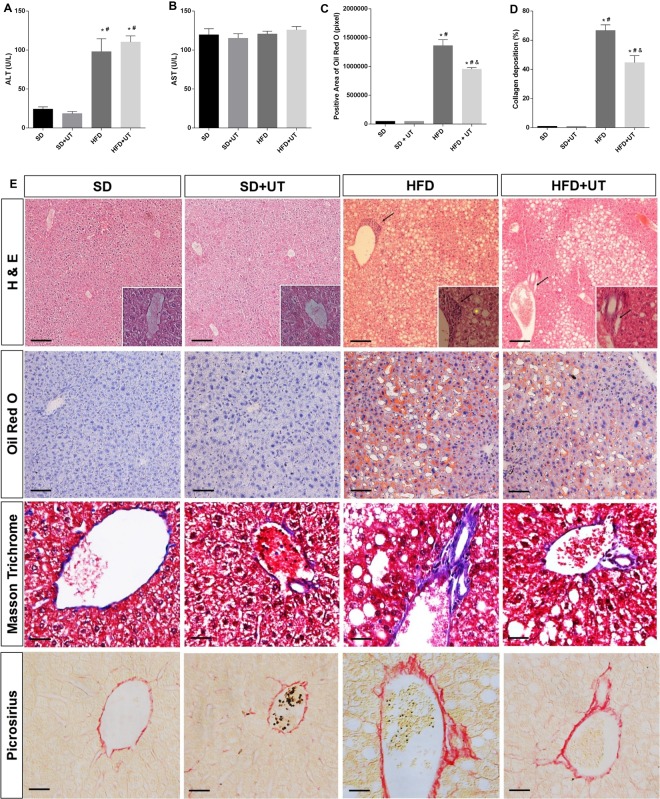
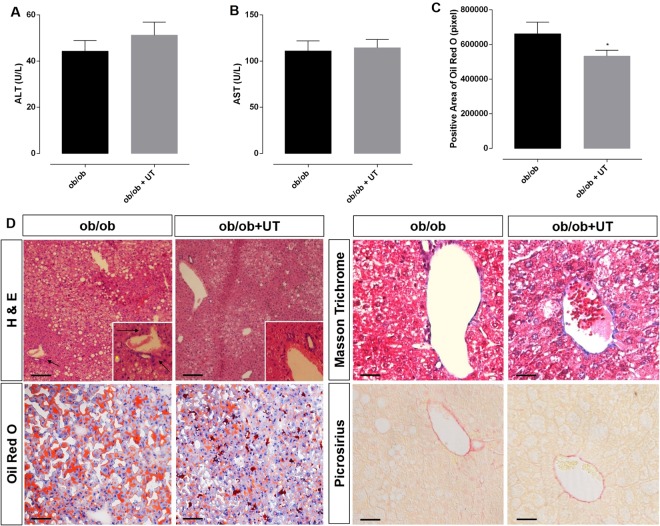
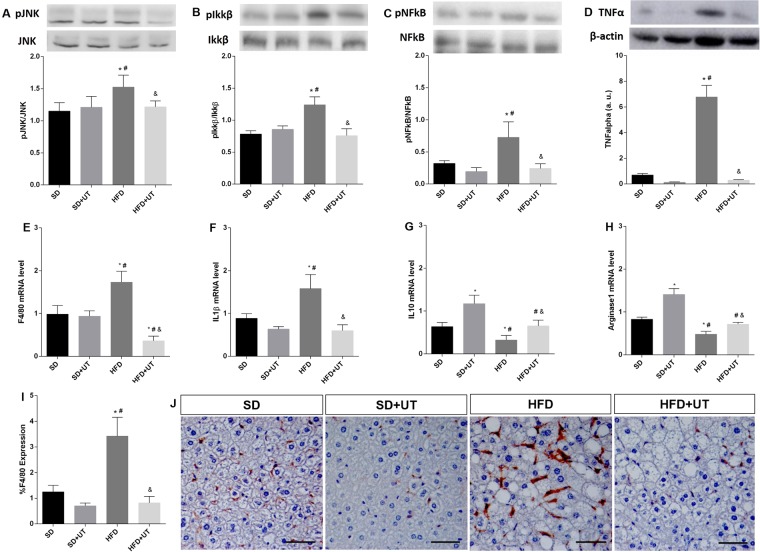
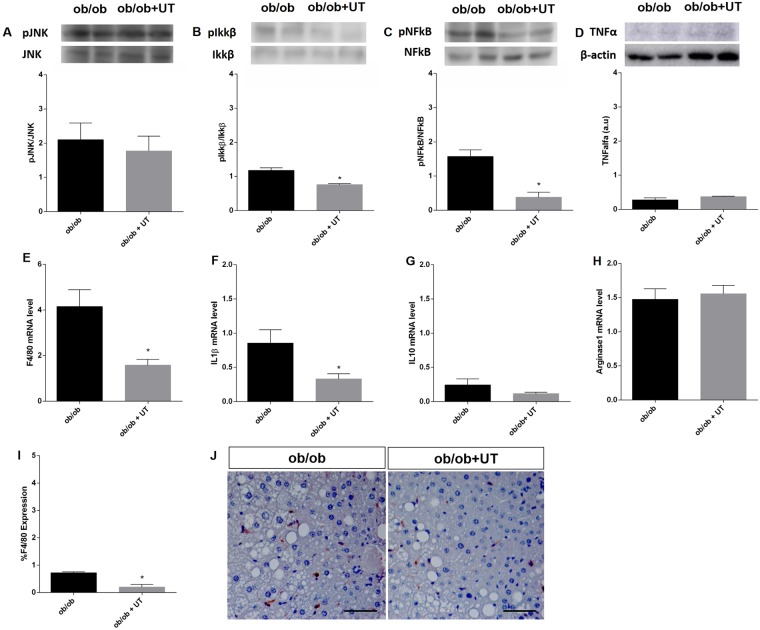
We investigated the effect of the crude herbal extract from Uncaria tomentosa (UT) on non-alcoholic fatty liver disease (NAFLD) in two models of obesity: high fat diet (HFD) and genetically obese (ob/ob) mice. Both obese mouse models were insulin resistant and exhibited an abundance of lipid droplets in the hepatocytes and inflammatory cell infiltration in the liver, while only the HFD group had collagen deposition in the perivascular space of the liver. UT treatment significantly reduced liver steatosis and inflammation in both obese mouse models. Furthermore, serine phosphorylation of IRS-1 was reduced by 25% in the HFD mice treated with UT. Overall, UT treated animals exhibited higher insulin sensitivity as compared to vehicle administration. In conclusion, Uncaria tomentosa extract improved glucose homeostasis and reverted NAFLD to a benign hepatic steatosis condition and these effects were associated with the attenuation of liver inflammation in obese mice.


Conflict of interest statement

The authors declare no competing interests.

Figures

Figure 1
Figure 1
Effect of Uncaria tomentosa (UT) on the metabolic parameters of HFD animals. Adult male C57BL/6 mice received either standard chow, representing the control group (SD), or high-fat diet (HFD) for a 12-week period. Seven days before the end of the feeding regimen period, the animals were isolated in the CLAMS chambers. After two days of adaptation, the mice received either vehicle (saline) or UT, 50 mg.kg−1 b.w., once a day for 5 days (SD+UT and HFD+UT), via gavage. During the last 3 days, food intake to calculate the caloric intake (A), O2 consumption (VO2) (C), CO2 production (VCO2) (D), and the respiratory coefficient (RER) (E) were measured. Body mass index was calculated at the end of the period (B). The results are represented as mean ± SEM, n = 4 to 5. The statistical differences as indicated by two-way ANOVA were as follows: *p < 0.05 (vs. SD); #p < 0.05 (vs. SD+UT); &p < 0.05 (vs. HFD).
Figure 2
Figure 2
Effect of Uncaria tomentosa (UT) on metabolic parameters of ob/ob animals. Adult ob/ob mice fed with standard chow were divided into two groups: control (ob/ob) and UT (ob/ob+UT), which received 50 mg.kg−1 b.w. of crude plant extract (UT) diluted with saline, for 5 consecutive days, once a day, via gavage. The animals were isolated in CLAMS chambers. After two days of adaptation, the mice received either vehicle (saline) or UT, 50 mg.kg−1 b.w., once a day for 5 days (ob/ob+UT), via gavage. During the last 3 days, food intake to calculate the caloric intake (A), O2 consumption (VO2) (C), CO2 production (VCO2) (D), and the respiratory coefficient (RER) (E) were measured. Body mass index was calculated at the end of the period (B). The results are represented as mean ± SEM, n = 4 to 5. The statistical difference was analyzed by Student’s t-test or two-way ANOVA.
Figure 3
Figure 3
Effect of Uncaria tomentosa (UT) on glucose metabolism of HFD mice. The animals were fed a HFD for 12-week period and then administered 50 mg.kg-1 b.w. of crude plant extract (UT), once a day, for 5 consecutive days or saline under the same regimen. The groups were: standard diet (SD), standard diet+UT (SD+UT), high fat diet (HFD) and high fat diet+UT (HFD+UT). The results are presented as mean ± SEM. The statistical differences as indicated by two-way ANOVA. Fasting blood glucose is represented in (A); *p < 0.0001 (SD vs. HFD, SD vs. HFD+UT), #p < 0.0001 (SD+UT vs. HFD, SD+UT vs. HFD+UT), &p < 0.0001 (HFD vs. HFD+UT); n = 5. Fasting blood insulin concentration (B); *p < 0.01 (SD vs. HFD), #p < 0.01 (SD+UT vs. HFD), &p < 0.05 (HFD vs. HFD+UT), n = 4. GTT is represented in (C); *p < 0.05 (SD vs. HFD; SD vs. HFD+UT), #p < 0.05 (SD+UT vs. HFD; SD+UT vs. HFD+UT; n = 10. Insulin tolerance test (ITT) is represented in (D); *p < 0.05 (compared to SD), #p < 0.05 (compared to SD+UT), &p < 0.05 (compared to HFD), n = 5. Phosphorylated proteins (EH) were represented by the ratio of the optical densitometry of phosphorylated protein and total protein expression. The statistical differences as indicated by two-way ANOVA were as follows: *p < 0.05 (stimulated groups (+) vs. not stimulated groups (−) with insulin), #p < 0.05 (compared to SD+), &p < 0.05 (compared to SD+UT), $p < 0.05 (compared to HFD+); n = 6.
Figure 4
Figure 4
Effect of Uncaria tomentosa (UT) on glucose metabolism of ob/ob mice. The adult male mice were fed with standard chow and then administered 50 mg.kg−1 b.w. of crude UT extract, once a day, for 5 consecutive days or saline under the same regimen. The results are presented as mean ± SEM. The statistical differences as indicated by Student’s t-test. Fasting blood glucose is represented in (A) n = 6, p < 0.0001. Fasting blood insulin concentration (B); p < 0.05, n = 4–7. GTT is represented in (C) n = 6, p < 0.01. ITT is represented in (D), n = 5. Phosphorylated proteins (EH) were represented by the ratio of the optical densitometry of phosphorylated protein and total protein expression, the statistical differences as indicated by two-way ANOVA were as follows: *p < 0.05 (4E and 4F: stimulated groups (+) vs. not stimulated groups (−) with insulin), *p < 0.05 (4 H: ob/ob- vs. ob/ob+UT−; ob/ob- vs. ob/ob+UT+), #p < 0.05 (ob/ob+ vs. ob/ob+UT−, obo/b+ vs. ob/ob+UT+), n = 5.
Figure 5
Figure 5
Hepatic enzyme activities are represented in (A,B), lipid droplets in (C), and collagen fibril deposition in (D). Morphology of liver (E) in Hematoxylin/Eosin staining the lipid droplets with ballooning hepatocytes (yellow *) and inflammatory cellular infiltrate (black arrow) in the perivenular areas of the liver, and in Oil Red O staining the fat accumulation is shown in red. Black bar represents a scale of 50 µm, objective 20×. In Masson trichrome and Picrosirius staining the collagen fibrils, in the perivenular area, are in blue and red, respectively, the black bar represents a scale of 100 µm objective 40×. The results are represented as mean ± SEM. The statistical differences as indicated by two-way ANOVA were as follows: *p < 0.0001 (SD vs. HFD, SD vs. HFD+UT), #p < 0.0001 (SD+UT vs. HFD; SD+UT vs. HFD+UT), &p < 0.001 (HFD vs. HFD+UT); n = 4.
Figure 6
Figure 6
Hepatic enzyme activities are represented in (A,B), lipid droplets in (C). Morphology of liver (D) in Hematoxylin/Eosin staining the lipid droplets with ballooning hepatocytes (yellow*) and inflammatory cellular infiltrate (black arrow) in the liver perivenular areas, and in Oil Red O staining the fat accumulation is shown in red. Black bar represents a scale of 50 µm, objective 20×. In Masson trichrome and Picrosirius staining the collagen fibrils, in the perivenular area, are in blue and in red, respectively, the black bar represents a scale of 100 µm objective 40×. The ob/ob animals showed no collagen deposition. The results are presented as mean ± SEM. The statistical difference as indicated by Student’s t-test was: *p < 0.05, n = 4.
Figure 7
Figure 7
Effect of Uncaria tomentosa (UT) on the inflammatory signaling pathway in the liver of HFD mice. Liver samples of standard diet (SD) or high-fat diet (HFD) mice, treated with vehicle or the herbal extract (UT) were used for Western blot analysis (AD) or for mRNA expression (EH). Phosphorylated proteins were calculated by the ratio of the optical densitometry of phosphorylated and total protein expression. Protein expression data for other proteins was normalized to β-actin, n = 5. Photomicrographs of monocyte/macrophage marker F4/80 immunohistochemistry (brown color) in the liver of HFD mice model under treatment with UT, n = 4 (20× all photomicrographs, Scale bar = 50 μm) (I,J). The results are represented as mean ± SEM. The statistical differences as indicated by two-way ANOVA were as follows: *p < 0.05 (compared to SD), #p < 0.05 (compared to SD+UT), &p < 0.05 (compared to HFD), n = 5.
Figure 8
Figure 8
Effect of Uncaria tomentosa (UT) on the inflammatory signaling pathway in the liver of ob/ob mice. Samples of livers from ob/ob mice that received either vehicle (ob/ob) or UT extract (ob/ob+UT) were used for Western blot analysis (AD) or for mRNA expression (EH). Phosphorylated proteins were calculated by the ratio of the optical densitometry of phosphorylated and total protein expression. Protein expression data for other proteins was normalized to β-actin, n = 5. Photomicrographs of monocyte/macrophage marker F4/80 immunohistochemistry (brown color) in the liver of ob/ob mice under treatment with UT, n = 4 (20× all photomicrographs, Scale bar = 50 μm) (I,J). Data are presented as mean ± SEM, respectively. The statistical difference as indicated by Student’s t-test was, *p < 0.05.

References

    1. Jin R, Vos MB. Fructose and liver function – is this behind nonalcoholic liver disease? Curr Opin Clin Nutr Metab Care. 2015;18:490–495. doi: 10.1097/MCO.0000000000000203. - DOI - PubMed
    1. Takahashi Y, Fukusato T. Pediatric nonalcoholic fatty liver disease: Overview with emphasis on histology. World J Gastroenterol. 2010;16:5280–5285. doi: 10.3748/wjg.v16.i42.5280. - DOI - PMC - PubMed
    1. Burt AD, Mutton A, Day CP. Diagnosis and interpretation of steatosis and steatohepatitis. SeminDiagnPathol. 1998;15:246–258. - PubMed
    1. Catta-Preta M, Mendonca LS, Fraulob-Aquino J, Aguila MB, Mandarim-de-Lacerda CA. A critical analysis of three quantitative methods of assessment of hepatic steatosis in liver biopsies. Virchows Arch. 2011;459:477–485. doi: 10.1007/s00428-011-1147-1. - DOI - PubMed
    1. Brown GT, Kleiner DE. Histopathology of nonalcoholic fatty liver disease and nonalcoholic steatohepatitis. Metabolism. 2016;65:1080–1086. doi: 10.1016/j.metabol.2015.11.008. - DOI - PMC - PubMed

Publication types