. 2018 Jul 20;8(1):10995.
doi: 10.1038/s41598-018-29304-x.

3D Printed Microfluidic Probes

Affiliations

3D Printed Microfluidic Probes

Ayoola Brimmo et al. Sci Rep. .

Abstract

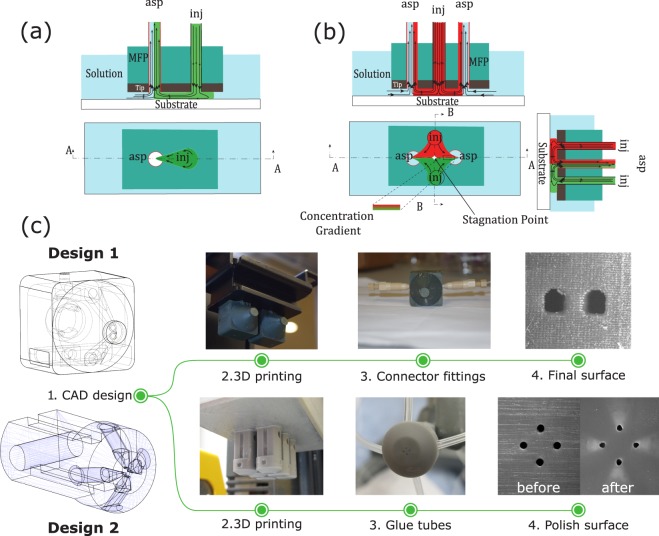
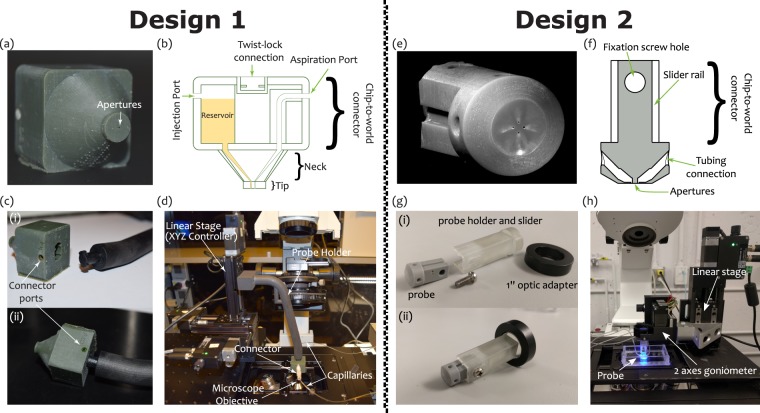
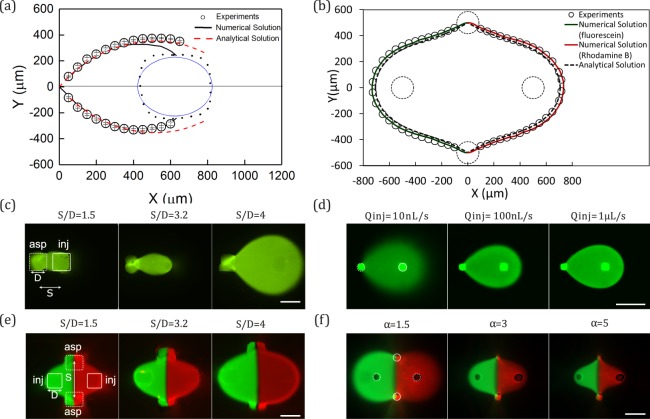
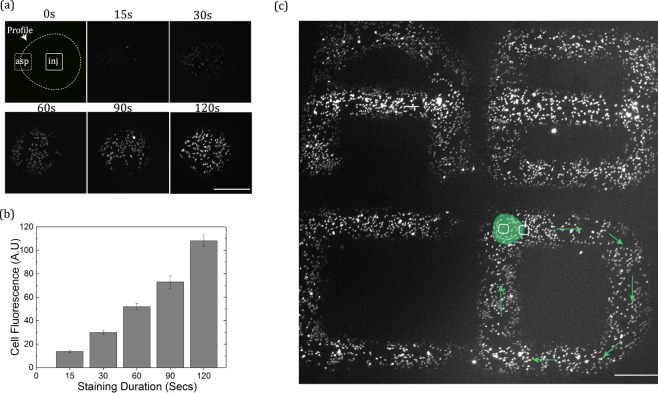
In this work, we fabricate microfluidic probes (MFPs) in a single step by stereolithographic 3D printing and benchmark their performance with standard MFPs fabricated via glass or silicon micromachining. Two research teams join forces to introduce two independent designs and fabrication protocols, using different equipment. Both strategies adopted are inexpensive and simple (they only require a stereolithography printer) and are highly customizable. Flow characterization is performed by reproducing previously published microfluidic dipolar and microfluidic quadrupolar reagent delivery profiles which are compared to the expected results from numerical simulations and scaling laws. Results show that, for most MFP applications, printer resolution artifacts have negligible impact on probe operation, reagent pattern formation, and cell staining results. Thus, any research group with a moderate resolution (≤100 µm) stereolithography printer will be able to fabricate the MFPs and use them for processing cells, or generating microfluidic concentration gradients. MFP fabrication involved glass and/or silicon micromachining, or polymer micromolding, in every previously published article on the topic. We therefore believe that 3D printed MFPs is poised to democratize this technology. We contribute to initiate this trend by making our CAD files available for the readers to test our "print & probe" approach using their own stereolithographic 3D printers.


Conflict of interest statement

The authors declare no competing interests.

Figures

Figure 1
Figure 1
3D Printed MFPs. (a) MD configuration of the MFP and its operating principles. (b) MQ configuration of the MFP and its operating principles. (c) 3D printing fabrication steps for both designs of the MFP.
Figure 2
Figure 2
MFP Design 1 (ad) and Design 2 (eh) setups. Design 1: (a) MD MFP (b) Cross section schematic of the MFP. (c) Twist lock fastening mechanism for connecting the MFP to the probe holder: (i) before and (ii) after fastening. (d) Experimental setup mounted on an inverted microscope. Design 2: (e) MQ MFP. (f) Cross section schematic of the MFP (g) MFP holder showing the probe holder slider and the 1″ optic adapter: (i) before and (ii) after assembly. (h) Experimental setup mounted on an inverted microscope.
Figure 3
Figure 3
Characterization of MD and MQ produced by the 3D printed MFPs. (a) Comparison between the experimentally measured, numerical simulation, and analytically calculated flow profiles of the MD using Design 1 MFP. D = 400 µm, α = 3. (b) Comparison between the experimentally measured, the numerical simulation, and analytical flow profiles of the MQ using the Design 2 MFP with fluorescein (left) and rhodamine B (right). D = 180 µm, α = 3. (c) MD profiles produced using the Design 1 MFP as a function of aperture spacing to diameter ratio (S/D). Qinj = 100 nL/s, α = 5. (d) MD profiles of the Design 2 MFP (clear resin MFP coated with black ink) as a function Qinj. S/D = 4.8, α = 3. (e) MQ profiles produced using Design 1 MFP as a function of S/D. Qinj = 100 nL/s, α = 3. (f) MQ profiles produced using Design 2 MFP (gray resin)as a function of α. Qinj = 100 nL/s, S/D = 5.5. All scale bars are 500 µm.
Figure 4
Figure 4
Selective staining of live adherent HeLa cells cultured in Petri dish. (a) Cell fluorescence as a function of staining duration. The value of α for all patterns are 2. (b) Quantification of the cell fluorescence intensity as a function of staining duration. Error bars indicate standard error of intensity measurements from 5 random cells. (c) Calligraphic patterns drawn at average scanning speed of 30 µm/s. Illustrations on letter “D” shows the programed path of the probe during the scanning movement. In letters A and B, the MFP made two scans over the horizontal lines (see Fig. S5), hence, their relatively higher staining intensity. All scale bars are 500 µm. Injection flow rates in (a) and (c) is 60 nL/s and MFP-substrate gap is 60 µm.

References

    1. Ainla A, Jeffries G, Jesorka A. Hydrodynamic flow confinement technology in microfluidic perfusion devices. Micromachines. 2012;3(2):442–461. doi: 10.3390/mi3020442. - DOI
    1. Quate C. Scanning probes as a lithography tool for nanostructures. Surface Science. 1997;386(1–3):259–264. doi: 10.1016/S0039-6028(97)00305-1. - DOI
    1. Juncker D, Schmid H, Delamarche E. Multipurpose microfluidic probe. Nature Materials. 2005;4(8):622–628. doi: 10.1038/nmat1435. - DOI - PubMed
    1. Kaigala G, Lovchik R, Drechsler U, Delamarche E. A vertical microfluidic probe. Langmuir. 2011;27(9):5686–5693. doi: 10.1021/la2003639. - DOI - PubMed
    1. Sarkar A, Kolitz S, Lauffenburger D, Han J. Microfluidic probe for single-cell analysis in adherent tissue culture. Nature communications. 2014;5:3421. doi: 10.1038/ncomms4421. - DOI - PMC - PubMed

Publication types

LinkOut - more resources