. 2018 Oct:180:117-129.
doi: 10.1016/j.biomaterials.2018.07.014. Epub 2018 Jul 12.

3D self-organized microvascular model of the human blood-brain barrier with endothelial cells, pericytes and astrocytes

Affiliations

3D self-organized microvascular model of the human blood-brain barrier with endothelial cells, pericytes and astrocytes

Marco Campisi et al. Biomaterials. 2018 Oct.

Abstract

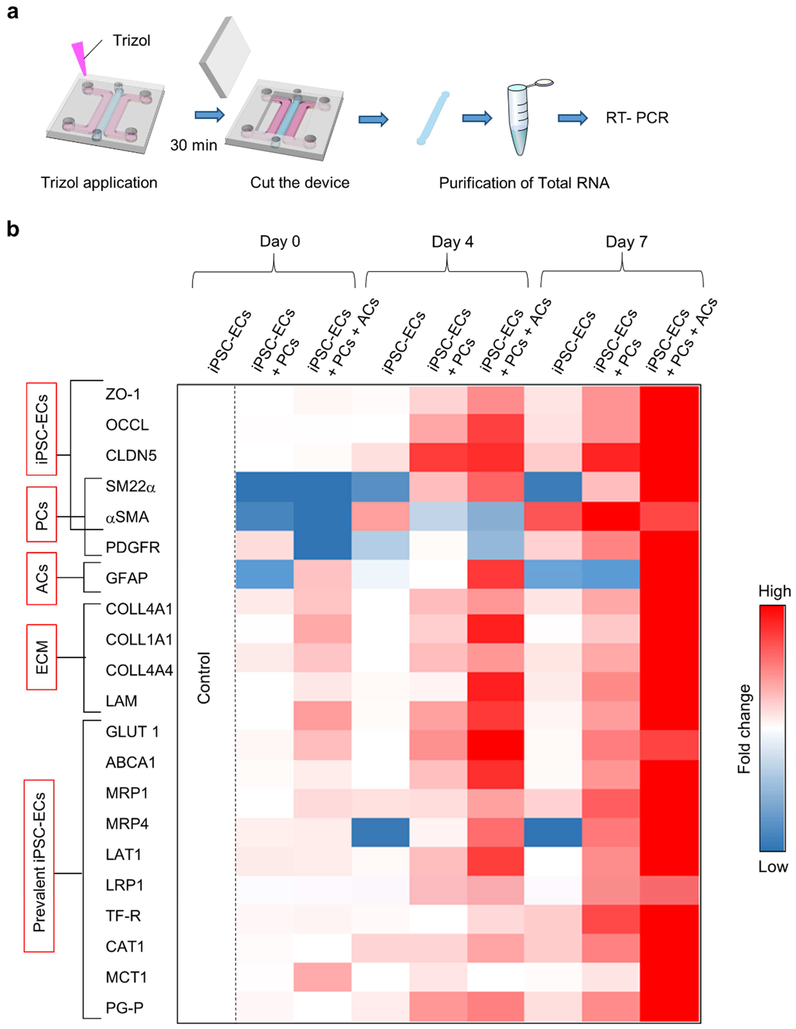
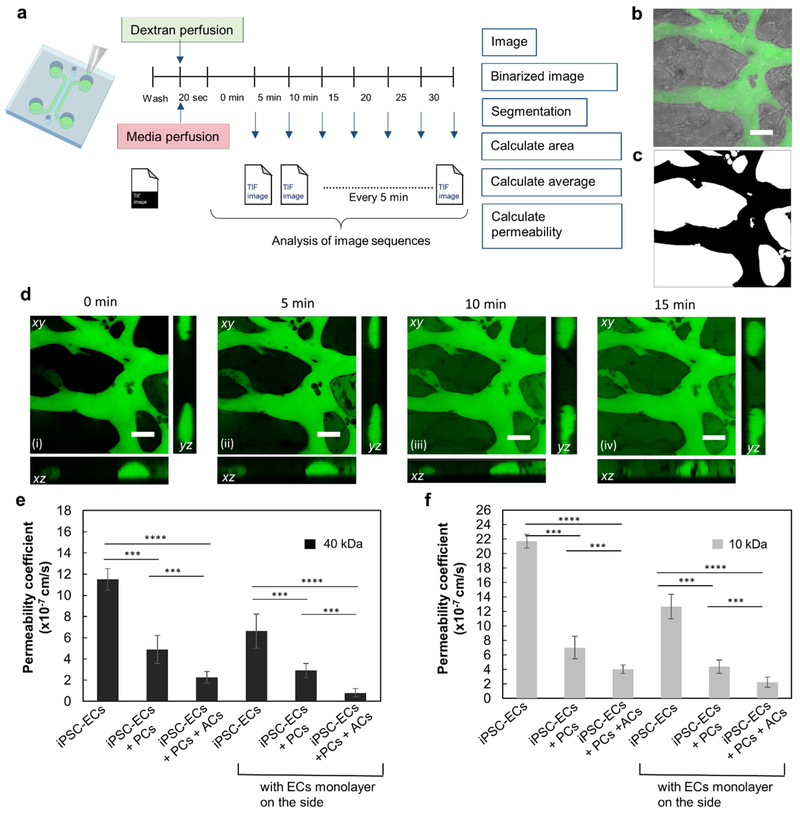
The blood-brain barrier (BBB) regulates molecular trafficking, protects against pathogens, and prevents efficient drug delivery to the brain. Models to date failed to reproduce the human anatomical complexity of brain barriers, contributing to misleading results in clinical trials. To overcome these limitations, a novel 3-dimensional BBB microvascular network model was developed via vasculogenesis to accurately replicate the in vivo neurovascular organization. This microfluidic system includes human induced pluripotent stem cell-derived endothelial cells, brain pericytes, and astrocytes as self-assembled vascular networks in fibrin gel. Gene expression of membrane transporters, tight junction and extracellular matrix proteins, was consistent with computational analysis of geometrical structures and quantitative immunocytochemistry, indicating BBB maturation and microenvironment remodelling. Confocal microscopy validated microvessel-pericyte/astrocyte dynamic contact-interactions. The BBB model exhibited perfusable and selective microvasculature, with permeability lower than conventional in vitro models, and similar to in vivo measurements in rat brain. This robust and physiologically relevant BBB microvascular model offers an innovative and valuable platform for drug discovery to predict neuro-therapeutic transport efficacy in pre-clinical applications as well as recapitulate patient-specific and pathological neurovascular functions in neurodegenerative disease.

Keywords: Drug delivery test platform; Human blood-brain barrier; Induced pluripotent stem cell-derived endothelial cells; In vitro modeling; Microfluidic device; Self-assembled microvascular network.


Figures

Figure 1:
Figure 1:. Blood-brain barrier and in vitro microvascular network model.
(a) Schematic representation of the blood-brain barrier (BBB), composed of brain Endothelial cells (ECs) vessels overlapped by pericytes (PCs) and astrocytes (ACs) endfeet. (b, (i)) Schematic representation of proposed 3D BBB microvascular network (μVN) model that mimics the microvascular structure present in the brain environment. (b, (ii)) Confocal image of self-assembled BBB μVN model including iPSC-ECs (CD31, green), PCs (F-actin, red) and ACs (GFAP, magenta), and nuclei (DAPI, blue). (c) Microfluidic device fabrication: (c, (i)) PDMS mold with patterned channels were produced by soft lithography and bonded to a glass coverslip. The central gel region contained cells and hydrogels, side channels and reservoirs were filled with cell culture medium. (c, (ii)) A photo of the microfluidic device. (d) Timeline of the experiments. (e) Cell seeding configuration and experimental steps of vasculogenesis process of BBB μVN model including iPSC-ECs+PCs+ACs as self-assembled microvascular network and 3-dimensional ECs layer covering top, bottom and side surfaces of the fluidic channel. Scale bar (b, (ii)) indicates 100 μm.
Figure 2:
Figure 2:. Microvascular network conditions iPSC-ECs - PCs/ACs contact interactions.
(a) Schematic representation and (b) confocal images of (a, b, (i)) iPSC-ECs mono-culture (CD31, green), (a, b, (ii)) co-culture with PCs (F-actin, red), and (a, b, (iii)) tri-culture with PCs and ACs (GFAP, magenta), after 7 days of culture in the microfluidic device. (c) Cross-sectional images of blood microvessels showing hollow lumens. (c, (i)) PCs adhered to and partially enveloped brain microvessel. (c, (ii)) Cross-sectional images of blood microvessels showing a lumen enclosed by iPSC-ECs and PCs. PCs surround the blood vessel. Image shows how section was sampled using a line scan measurement (yellow line) and generation of intensity profile histogram. (d) Intensity profile analysis of CD31/F-actin in iPSC-ECs -PCs interaction corresponding to the yellow line scan. Intensity profile shows distinct peaks (yellow arrow) at the position of contact interaction/overlapping between ECs and PCs. CD31 expression (green) was low when F-actin expression (red) was high, further indicating that F-actin expression belonged only to brain PCs outside the vessels. Region of low green intensity corresponds to the vascular bed of the vessel. (e) Contact interactions of PCs enveloping blood microvessel. PCs adhered to and partially enveloped brain microvessel. (f) Confocal image of iPSC-ECs, PCs and ACs in the tri-culture condition. Images were analyzed using Imaris 8.3. Scale bars indicate 100 μm (b) and 20 μm (c, e, f).
Figure 3:
Figure 3:. 3D BBB microvascular network parameter quantification.
Confocal images of laminin expression (red) and nuclei (DAPI, blue) of 3D BBB μVN maturation from (a) mono-culture of iPSC-ECs, (b) co-culture of iPSC-ECs+PCs and (c) tri-culture of iPSC-ECs+PCs+ACs (scale bar: 100 μm). Distribution of lateral and transverse vessel diameter measurements of 3D BBB μVNs formed by vasculogenesis, for (d) mono-culture of iPSC-ECs, (e) co-culture with brain PCs, (f) tri-culture with brain PCs and ACs. Additional image in supplementary Fig. 4. (g, h, i) Quantification of microvascular network parameters: (g) average lateral and transverse vessel diameters in each condition, (h) microvascular branches average length and (i) percentage ratio of microvascular network area coverage to the total area. * p<0.05, ** p<0.01, *** p<0.001, **** p<0.0001. Error bars ± SD, n=30.
Figure 4:
Figure 4:. Immunocytochemistry analysis of tight junctions and ECM deposition.
Self-assembled microvascular networks formed after 7 days in microfluidic device culture for: (i) mono-culture of iPSC-ECs, (ii) co-culture with PCs and (iii) tri-culture with PCs and ACs (BBB microvascular network model). (a-e) Microvascular networks were immunostained for tight junctions (ZO-1, occludin (OCCL) and claudin-5 (CLDN 5)), and ECM production (laminin (LAM) and collagen IV (COLL IV)), and nuclei (DAPI) inside microfluidic devices and imaged by confocal microscopy. (a) Immunofluorescent (IF) intensities of ZO-1 were well-defined in co-culture and tri-culture conditions. ZO-1 expression was clearly localized at the intersection between cells forming a rhomboidal grid, characteristic of mature and well-organized microvasculature. Instead, monoculture exhibited low expression of TJ proteins with no visible and defined accumulation at cell boundaries. Similar behavior was exhibited by (b) occludin and (c) claudin-5. (d) Confocal images of deposition of laminin and (e) collagen IV showed production and remodelling of a distinct ECM by the different microvascular networks. BBB microvascular model with PCs and ACs expressed higher intensities of laminin and collagen IV compared to monoculture and co-culture, providing evidence that PCs and ACs improved vascular function. Qualitative image tests were realized by ROI intensity analysis. (f) Fold change average IF intensity (relative to iPSC-ECs) quantify the protein expression according to the IF images. Computed image intensities were normalized by the selected area. * p<0.05, ** p<0.01, *** p<0.001, **** p<0.0001. Error bars ± SD, n=8. Confocal image scale bar: 50 μm.
Figure 5:
Figure 5:. Quantitative relative RT-PCR of 3D BBB μVNs in microfluidic device.
(a) Schematic representation of vascular network and gel extraction from a microfluidic device, purification of total RNA and conduct of RT-PCR experiments. (b) Heatmap of RT-PCR results of mono-culture of iPSC-ECs, co-culture with PCs, and tri-culture with PCs and ACs at 0, 4 and 7 days. Relative comparison of mRNA expression of factors relating to microvascular maturation and other typical BBB features. Gene analysis considered markers 1) expressed in ECs, 2) expressed in PCs, 3) expressed in ACs, 4) ECM protein RNA, and 5) genes expressed predominantly by ECs, but also in smaller amounts by the other two cell types. Fold change was relative to control (mono-culture of iPSC-ECs, day 0). The internal standard housekeeping gene was CD31. 0.01p <0.05, n = 3.
Figure 6:
Figure 6:. Permeability assay in BBB model.
(a) Timeline of permeability experiments and computational analysis. After cell culture medium was removed, dextran solution was injected and image stacks were captured every 3-5 mins for 30 mins. Workflow of image analysis by ImageJ and permeability coefficient calculation. (b) Confocal and bright field images at time 0. (c) Image binarization after thresholding to identify vessel borders. (d, (i-iv)) Maximum image projections and cross-sections including xy, xz and yz planes at 4 time-points. The graphs show permeability coefficients for 3 different conditions (with and without ECs seeding in side channels) using (e) 40 kDa and (f) 10 kDa FTIC-dextrans in mono-culture of iPSC-ECs, co-culture of iPSC-ECs+PCs, and tri-culture of iPSC-ECs+PCs+ACs. The data show mean value, error bars ± SD, n=10, * p<0.05, ** p<0.01, *** p<0.001, **** p<0.0001, scale bars 50 μm.
Figure 7:
Figure 7:. BBB microvascular network model.
(a) Confocal images of xy and xz (cross-section) planes of the 3D BBB microvascular in vitro model with iPSC-ECs+PCs+ACs, including EC layers in the side channel. Scale bars 200 μm.

References

    1. Abbott NJ, “Dynamics of CNS barriers: Evolution, differentiation, and modulation,” Cell. Mol. Neurobiol, vol. 25, no. 1, pp. 5–23, 2005. - PMC - PubMed
    1. Abbott NJ, Patabendige AAK, Dolman DEM, Yusof SR, and Begley DJ, “Structure and function of the blood-brain barrier,” Neurobiol. Dis, vol. 37, no. 1, pp. 13–25, 2010. - PubMed
    1. Serlin Y, Shelef I, Knyazer B, and Friedman A, “Anatomy and physiology of the blood-brain barrier,” Semin. Cell Dev. Biol, vol. 38, pp. 2–6, 2015. - PMC - PubMed
    1. Bell RD. Zlokovic BV, “Neurovascular mechanisms and blood–brain barrier disorder in Alzheimer’s disease,” Acta Neuropathol, vol. 36, no. 3, pp. 490–499, 2010. - PMC - PubMed
    1. Zlokovic BV, “Neurovascular mechanisms of Alzheimer’s neurodegeneration,” Trends Neurosci, vol. 28, no. 4, pp. 202–208, 2005. - PubMed

Publication types