. 2018 Oct;410(25):6477-6487.
doi: 10.1007/s00216-018-1245-x. Epub 2018 Jul 21.

Subcellular mapping of living cells via synchrotron microFTIR and ZnS hemispheres

Affiliations

Subcellular mapping of living cells via synchrotron microFTIR and ZnS hemispheres

K L Andrew Chan et al. Anal Bioanal Chem. 2018 Oct.

Abstract

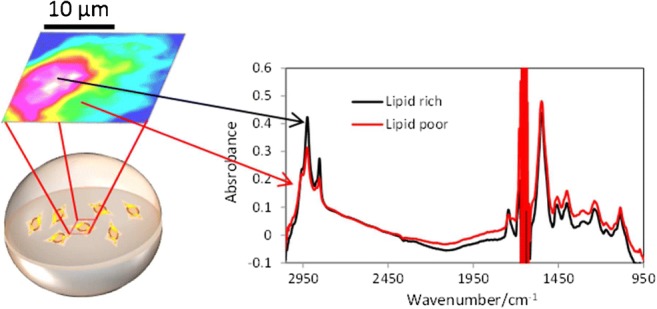
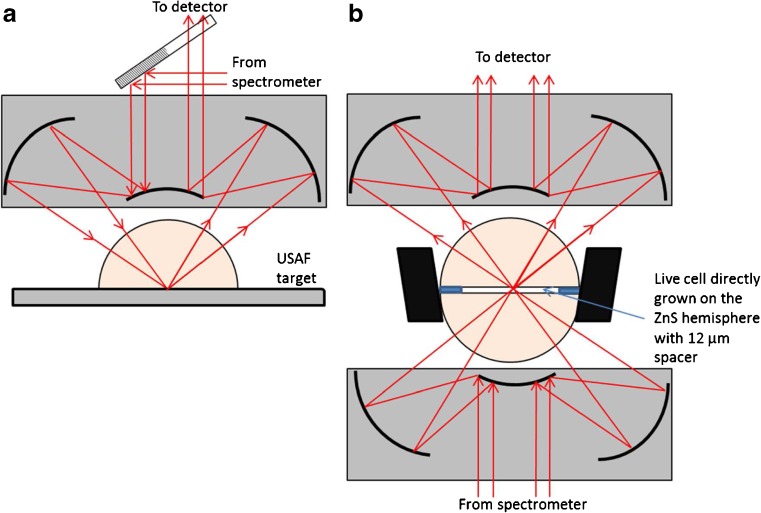
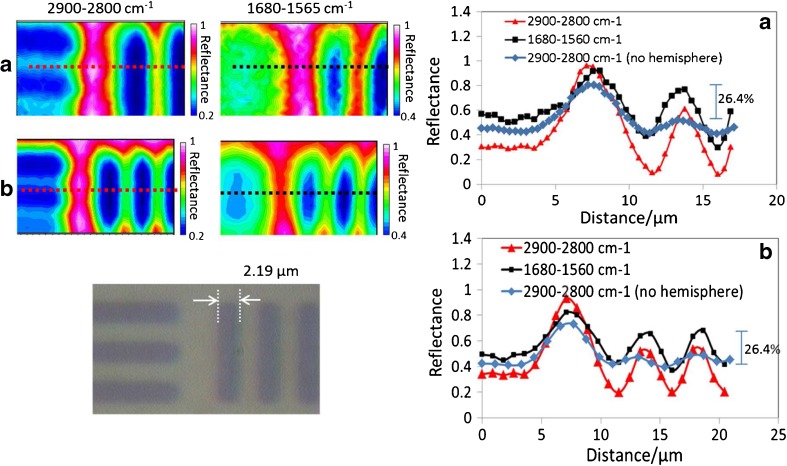
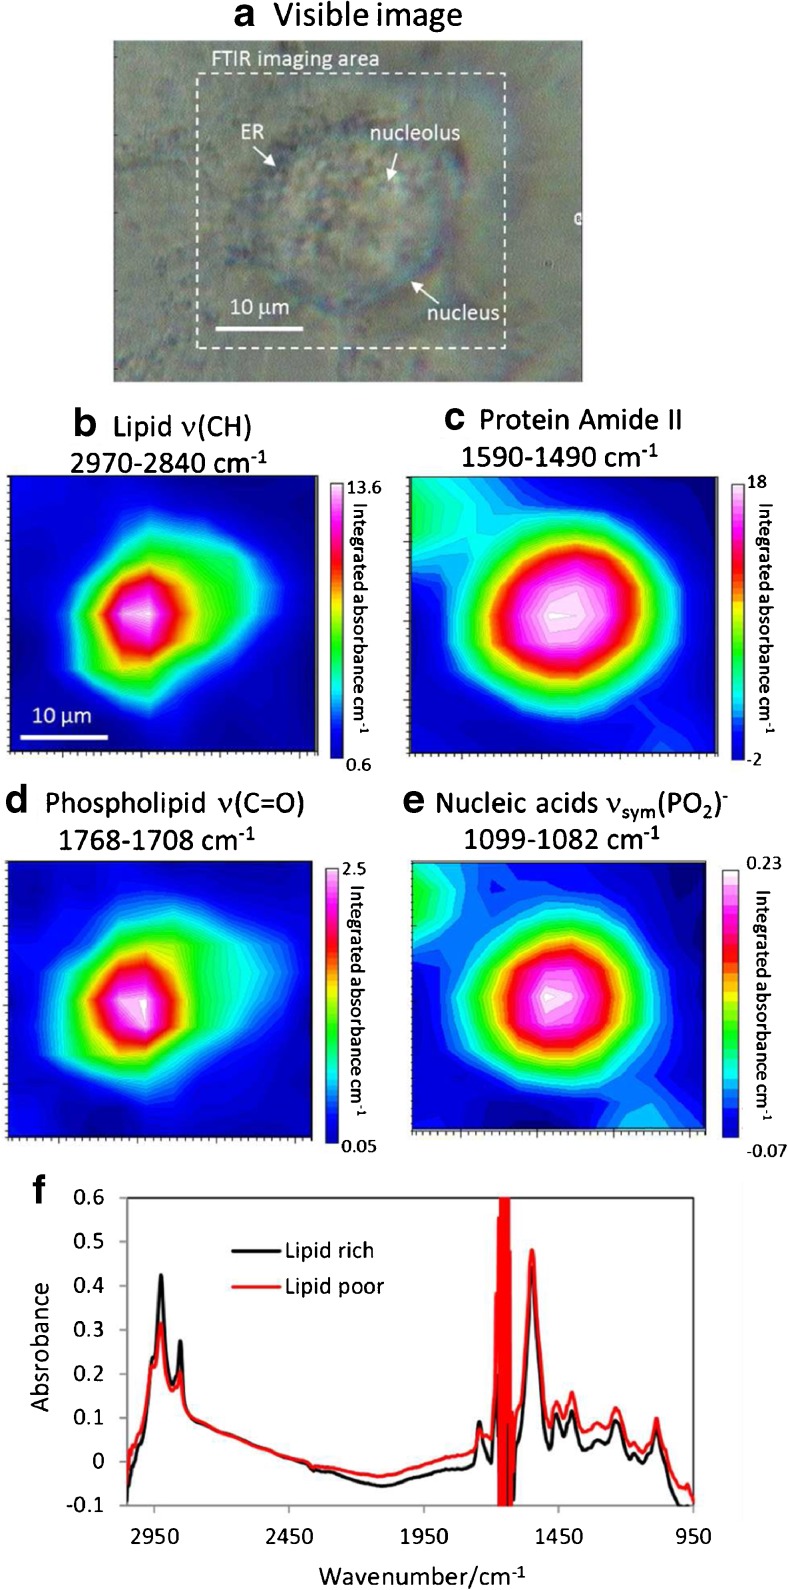
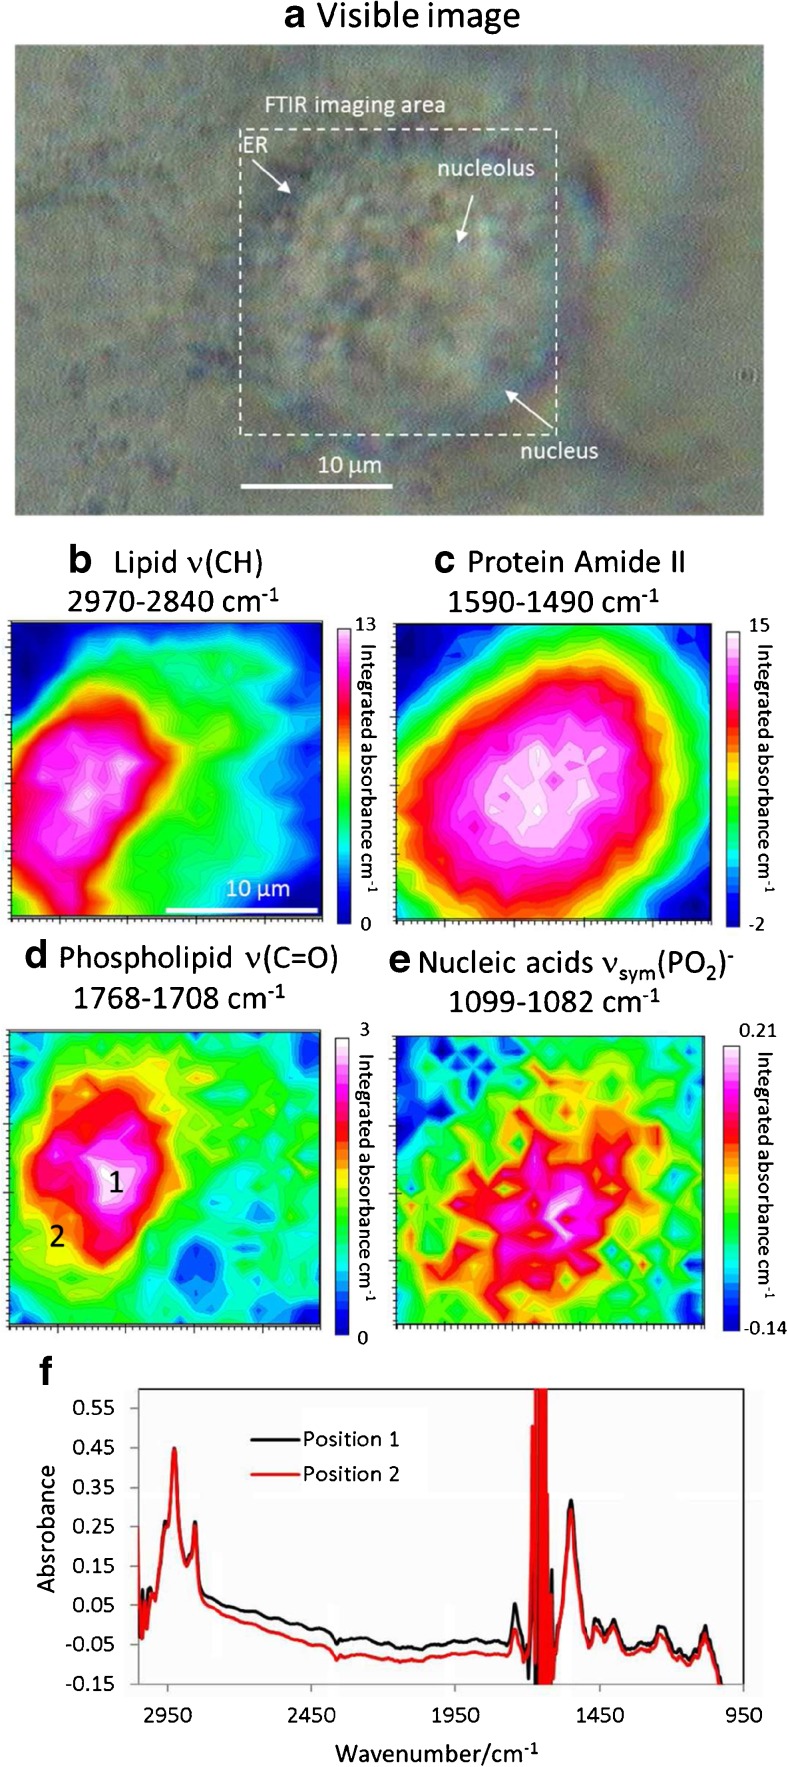
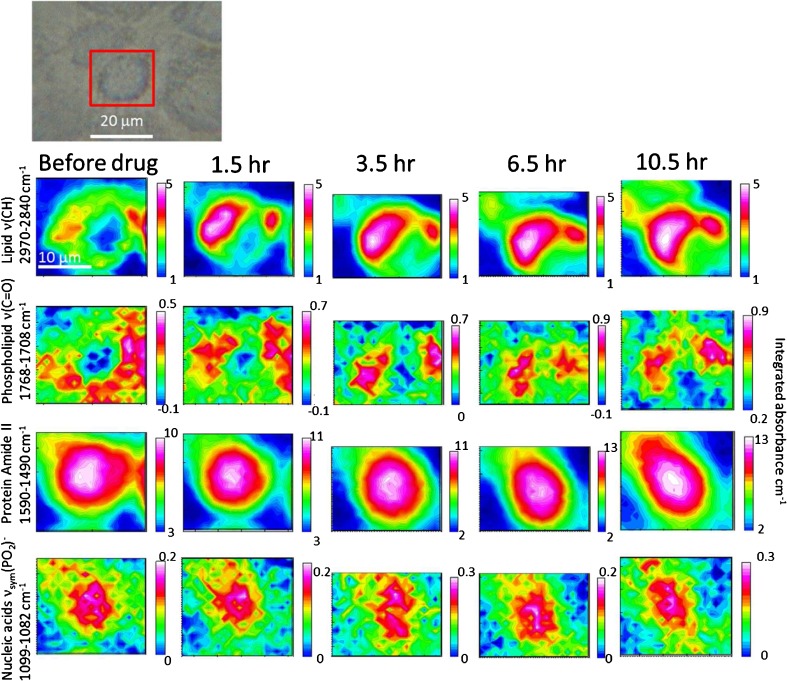
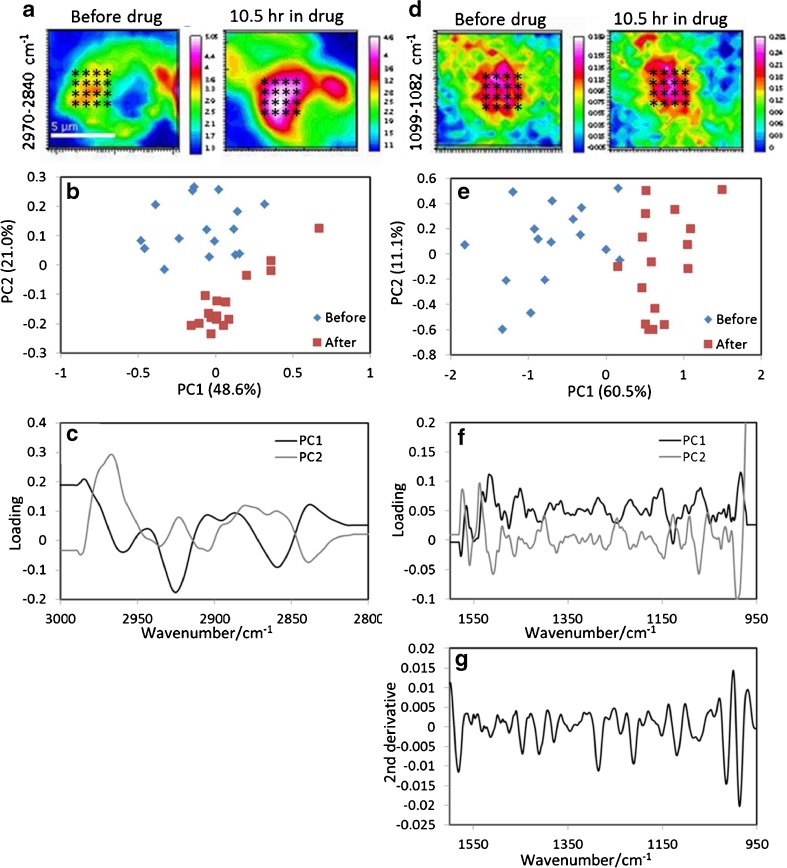
FTIR imaging is a label-free, non-destructive method valuably exploited in the study of the biological process in living cells. However, the long wavelength/low spatial resolution and the strong absorbance of water are still key constrains in the application of IR microscopy ex vivo. In this work, a new retrofit approach based on the use of ZnS hemispheres is introduced to significantly improve the spatial resolution on live cell FTIR imaging. By means of two high refractive index domes sandwiching the sample, a lateral resolution close to 2.2 μm at 6 μm wavelength has been achieved, i.e. below the theoretical diffraction limit in air and more than twice the improvement (to ~λ/2.7) from our previous attempt using CaF2 lenses. The ZnS domes also allowed an extended spectral range to 950 cm-1, in contrast to the cut-off at 1050 cm-1 using CaF2. In combination with synchrotron radiation source, microFTIR provides an improved signal-to-noise ratio through the circa 12 μm thin layer of medium, thus allowing detailed distribution of lipids, protein and nucleic acid in the surround of the nucleus of single living cells. Endoplasmic reticula were clearly shown based on the lipid ν(CH) and ν(C=O) bands, while the DNA was imaged based on the ν(PO2-) band highlighting the nucleus region. This work has also included a demonstration of drug (doxorubicin) in cell measurement to highlight the potential of this approach. Graphical abstract.

Keywords: Anti-cancer drugs; Cell systems/single cell analysis; FT-IR imaging; Fourier transform infrared; High definition; Immersion objective.


Conflict of interest statement

There is no potential conflict of interest from this work.

Figures

None
Graphical abstract
Fig. 1
Fig. 1
Schematics showing (a) the ZnS hemisphere on the USAF target where measurements were made in transflection mode and (b) the prototype transmission cell where live cells were sandwiched between two ZnS hemisphere with a 12-μm thick spacer and the measurements were made in transmission mode
Fig. 2
Fig. 2
FTIR, visible images and extracted transmittance profiles of the 1951 USAF resolution target measured through the ZnS hemisphere with (a) effective aperture size of 1.3 μm × 1.3 μm with an effective step size of 0.44 μm and (b) effective aperture size of 2.7 μm × 2.7 μm with a set step size of 0.89 μm for the black and red profiles. A blue profile is also added to the plots, which represents the measurement made without the hemisphere with (a) 1 μm × 1 μm with an effective step size of 0.4 μm and (b) 3 μm × 3 μm with an effective step size of 1 μm
Fig. 3
Fig. 3
Visible imaging (a) and FTIR images (be) of the living A549 cell in the region surrounding the nucleus in the ZnS hemispheres transmission device using an effective aperture size of 10 μm. Integration range 2970–2840 cm−1, 1768–1708 cm−1, 1590–1490 cm−1 and 1099–1082 cm−1 respectively represent the distribution of overall lipid (b), fat/phospholipids (d), the overall protein (amide II) (c) and nucleic acids (e). (f) shows the extracted spectra from the lipid rich (black line) and lipid poor (red line) areas spectra from positions 1 and 2 shown in b
Fig. 4
Fig. 4
Visible imaging (a) and FTIR images (be) of the living A549 cell in the region surrounding the nucleus in the ZnS hemispheres transmission device using an effective aperture size of 2.7 μm. Integration range 2970–2840 cm−1, 1768–1708 cm−1, 1590–1490 cm−1 and 1099–1082 cm−1 respectively represent the distribution of overall lipid (b), fat/phospholipids (d), the overall protein (amide II) (c) and nucleic acids (e). (f) shows the extracted spectra from positions 1 and 2 shown in d
Fig. 5
Fig. 5
FTIR images of an A549 cell in the region surrounding the nucleus before and after exposure to 0.5 μM doxorubicin. The visible image of the measured A549 cell is shown at the top with the red square showing the approximate location where the FTIR images were measured. The colour scales used are shown on the right of each individual image
Fig. 6
Fig. 6
PCA analysis of the cell before and after exposing in drug for 10.5 h. The “*” marks on images in (a) and (d) show the locations of the extracted spectra. Normalised (max-min) second derivative spectra were used to calculate the PCs. (b) Score plots of PC1 against PC2 in the 3000–2800 cm−1 region from the spectra extracted from locations indicated in (a). Plot (c) is the loadings for PC1 and PC2 correspond to (b). (e) Score plots of PC1 against PC2 in the 1600–950 cm−1 region from the spectra extracted from locations indicated in (d). Plot (f) is the loadings for PC1 and PC2 correspond to (d). (g) A second derivative spectrum (1600–950 cm−1) of doxorubicin in solution form

References

    1. Vaccari L, Birarda G, Businaro L, Pacor S, Grenci G. Infrared microspectroscopy of live cells in microfluidic devices (MD-IRMS): toward a powerful label-free cell-based assay. Anal Chem. 2012;84(11):4768–4775. doi: 10.1021/ac300313x. - DOI - PubMed
    1. Schmidt M, Wolfram T, Rumpler M, Tripp CP, Grunze M. Live cell adhesion assay with attenuated total reflection infrared spectroscopy. Biointerphases. 2007;2(1):1–5. doi: 10.1116/1.2710336. - DOI - PubMed
    1. Kuimova MK, Chan KLA, Kazarian SG. Chemical imaging of live cancer cells in the natural aqueous environment. Appl Spectrosc. 2009;63(2):164–171. doi: 10.1366/000370209787391969. - DOI - PubMed
    1. Alam MK, Timlin JA, Martin LE, Williams D, Lyons CR, Garrison K, et al. Spectroscopic evaluation of living murine macrophage cells before and after activation using attenuated total reflectance infrared spectroscopy. Vib Spectrosc. 2004;34(1):3–11. doi: 10.1016/j.vibspec.2003.07.002. - DOI
    1. Marcsisin EJ, Uttero CM, Miljkovic M, Diem M. Infrared microspectroscopy of live cells in aqueous media. Analyst. 2010;135(12):3227–3232. doi: 10.1039/c0an00548g. - DOI - PubMed