

Review
doi: 10.1016/S0140-6736(18)31070-5.
Epub 2018 Jul 20.
Advancing global health and strengthening the HIV response in the era of the Sustainable Development Goals: the International AIDS Society-Lancet Commission
Affiliations
- PMID: 30032975
- PMCID: PMC6323648
- DOI: 10.1016/S0140-6736(18)31070-5
Item in Clipboard
Review
Advancing global health and strengthening the HIV response in the era of the Sustainable Development Goals: the International AIDS Society-Lancet Commission
Lancet.
.
No abstract available
Figures
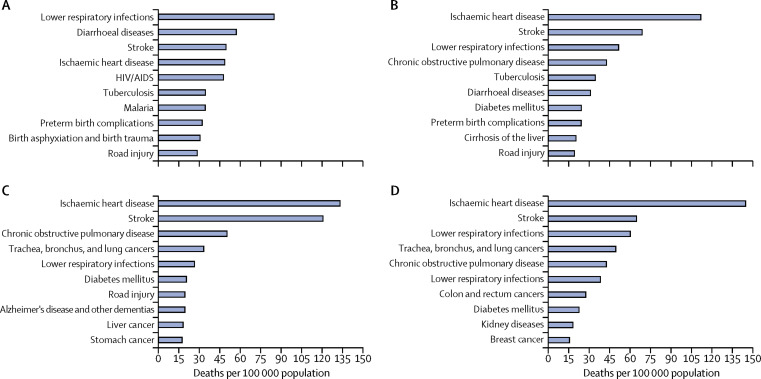
Ten leading causes of death in 2015 (A) Low-income economies. (B) Low-middle-income economies. (C) Upper-middle-income economies. (D) High-income economies. Source: WHO.
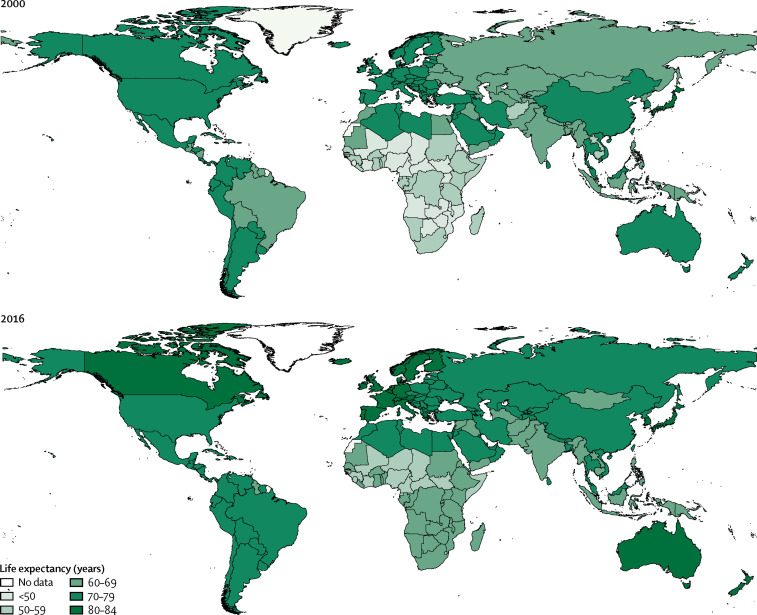
Life expectancy in 2000 and 2016 Source: WHO.
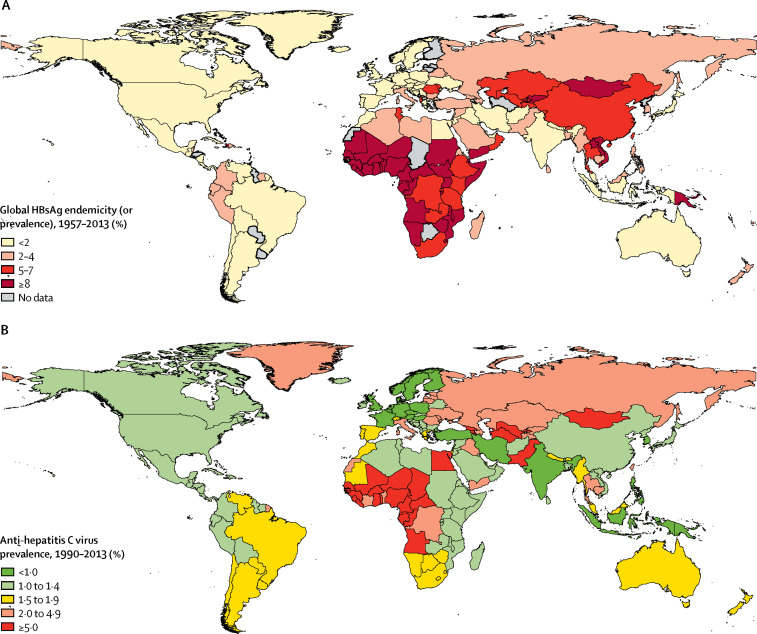
Global burden of hepatitis B virus and hepatitis C virus (A) Prevalence of hepatitis B virus infection between 1957 and 2013. (B) Prevalence of anti-hepatitis C virus between 1990 and 2013. Adapted from Schweitzer et al (2015) and from Gower et al (2014), by permission of Elsevier.
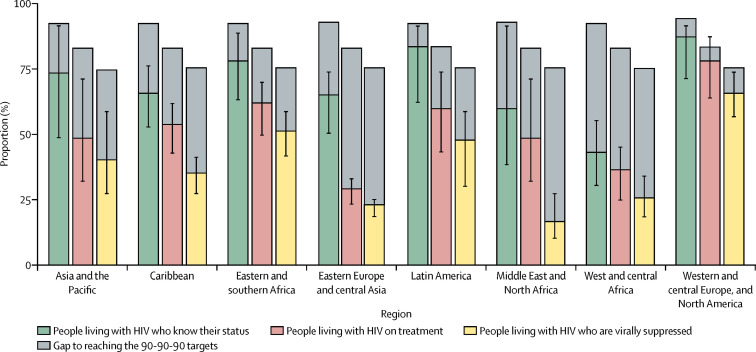
Knowledge of HIV status, treatment coverage, and viral load suppression by region in 2016 Comparison of HIV testing and treatment cascades by region reveals different patterns of progress. Western and central Europe and North America are approaching global targets. Latin America and eastern and southern Africa show high levels of achievement across the cascade. Eastern Europe and central Asia, the Middle East and North Africa, and western and central Africa are clearly off track. Source: UNAIDS special analysis, 2017.

African American men who have sex with men have an increased lifetime acquisition probability of HIV infection in 2018 Credit: © NASTAD.
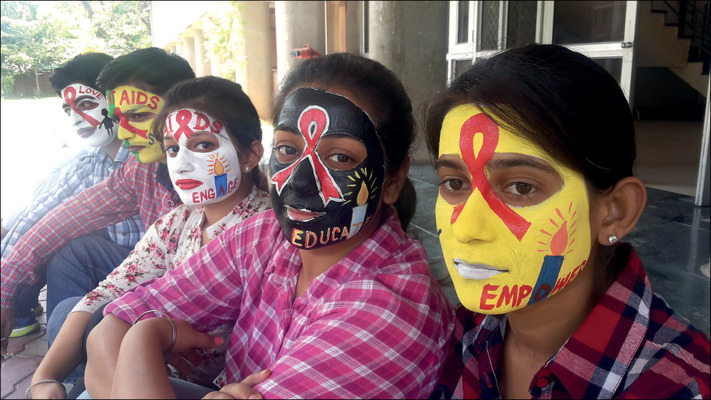
Activism on HIV in India Students recognise International AIDS Candlelight Memorial Day with painted faces at the Centre for Social Work, Panjab University, Chandigarh, India. Credit: © 2016 Gaurav Gaur, Photoshare.
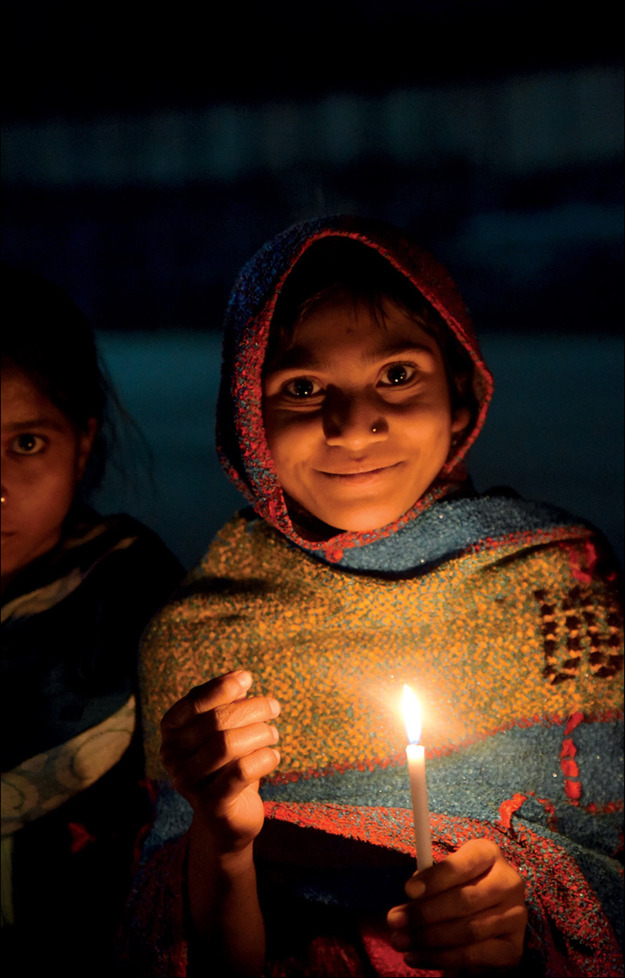
Sexual and emotional health in adolescents in India A young girl attends a candlelit march for sexual and emotional health for young teens in Udaipur, India. Credit: © 2016 Arvind Jodha/UNFPA, Photoshare.
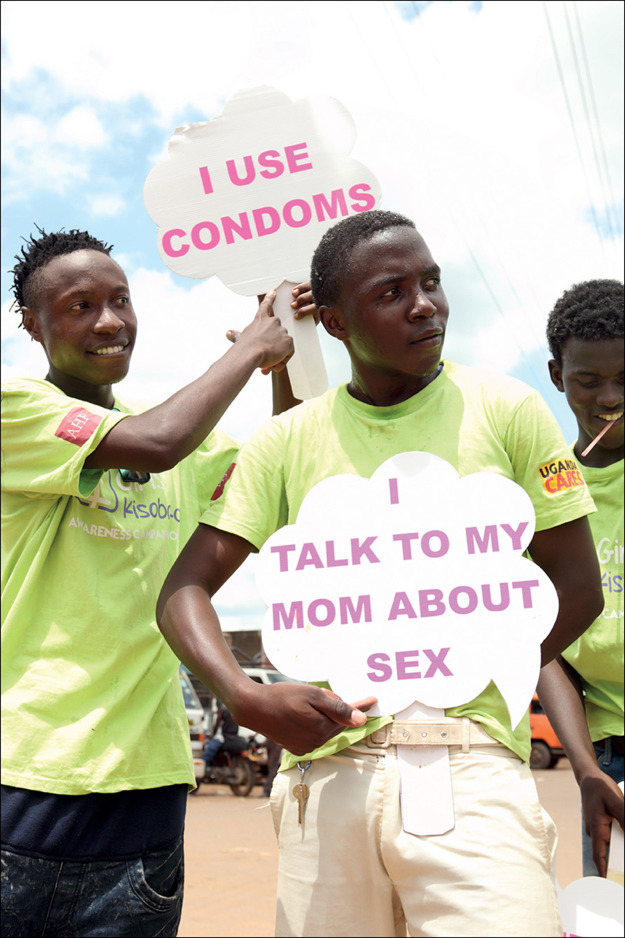
HIV testing, family planning education and referrals, and deworming kits in Uganda A dance troupe with Public Health Ambassadors Uganda perform in the Kasana Market in Luwero to call attention to a pop-up health clinic providing HIV testing, family planning education and referrals, and deworming kits. Credit: © 2016 David Alexander, Photoshare.
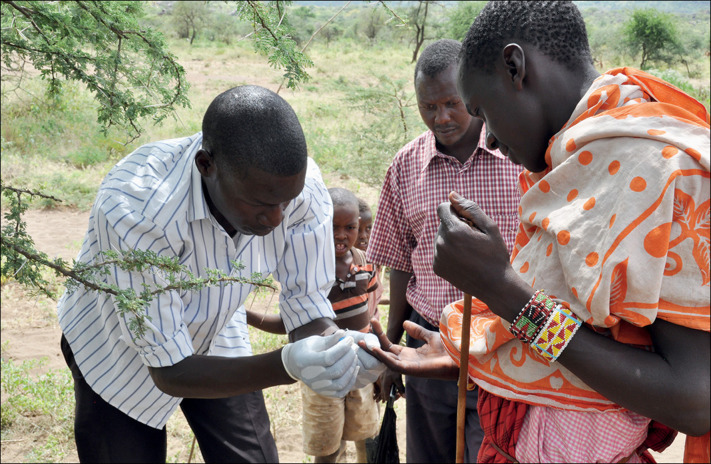
HIV testing services in Kenya A counsellor provides HIV testing services to livestock herders during community outreach services in the Eremit area of Kajiado County, Kenya. Credit: © 2012 George N Obanyi/FHI 360, Photoshare.
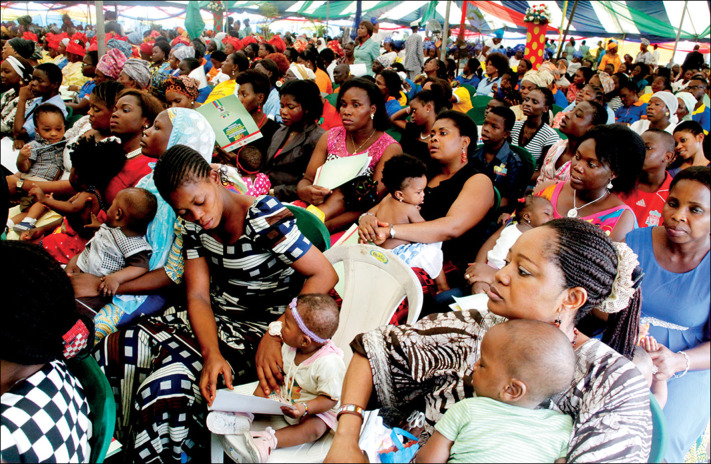
Prevention of mother-to-child transmission of HIV in Nigeria Mothers and children in Alausa Area of Lagos, Nigeria, during a state-sponsored educational programme on prevention of mother-to-child transmission of HIV. Credit: © 2014 Kunle Ajayi, Photoshare.
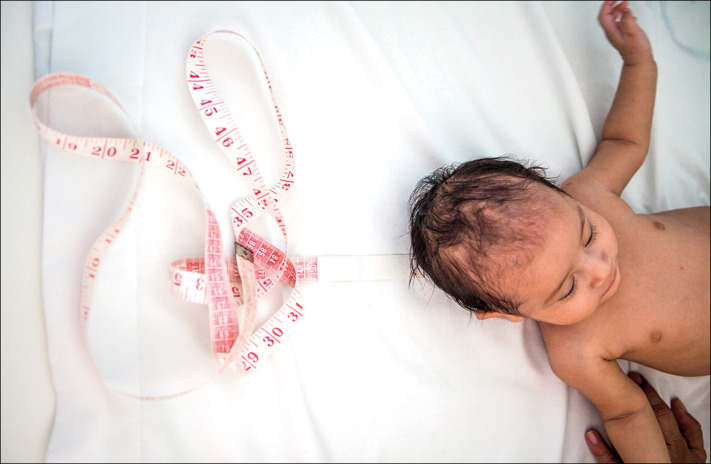
Monitoring babies for signs of congenital Zika syndrome in Honduras At Tela Hospital in El Progreso City, Honduras, Ileana Mayes Flores, the only geneticist in the public sector of Honduras, examines Aylin Meja, a baby aged 3 months whose mother, Sandra Meja aged 19 years, was infected with the Zika virus during pregnancy. The medical staff is closely monitoring her baby for signs of congenital Zika syndrome. Credit: © 2017 Brendan Bannon/USAID, Photoshare.
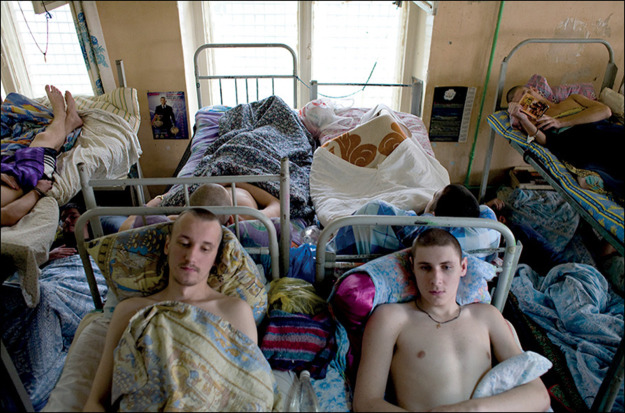
Patients undergo drug detoxification while handcuffed to their beds at a programme for heroin addiction in Ekaterinburg, Russia Credit: Brendan Hoffman.
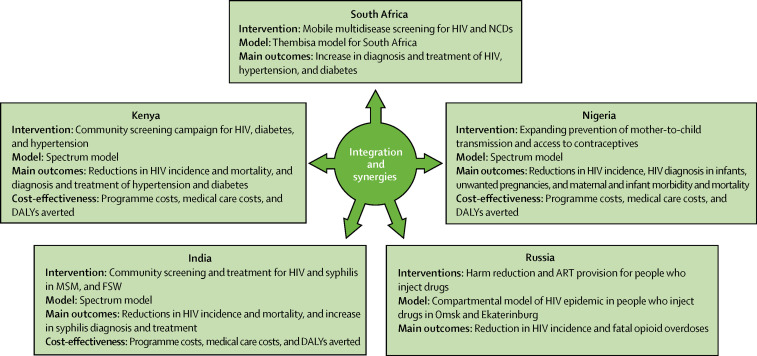
A multicountry modelling exercise to study the effect of HIV integration in various settings NCDs=non-communicable diseases. MSM=men who have sex with men. FSW=female sex workers. ART=antiretroviral therapy.
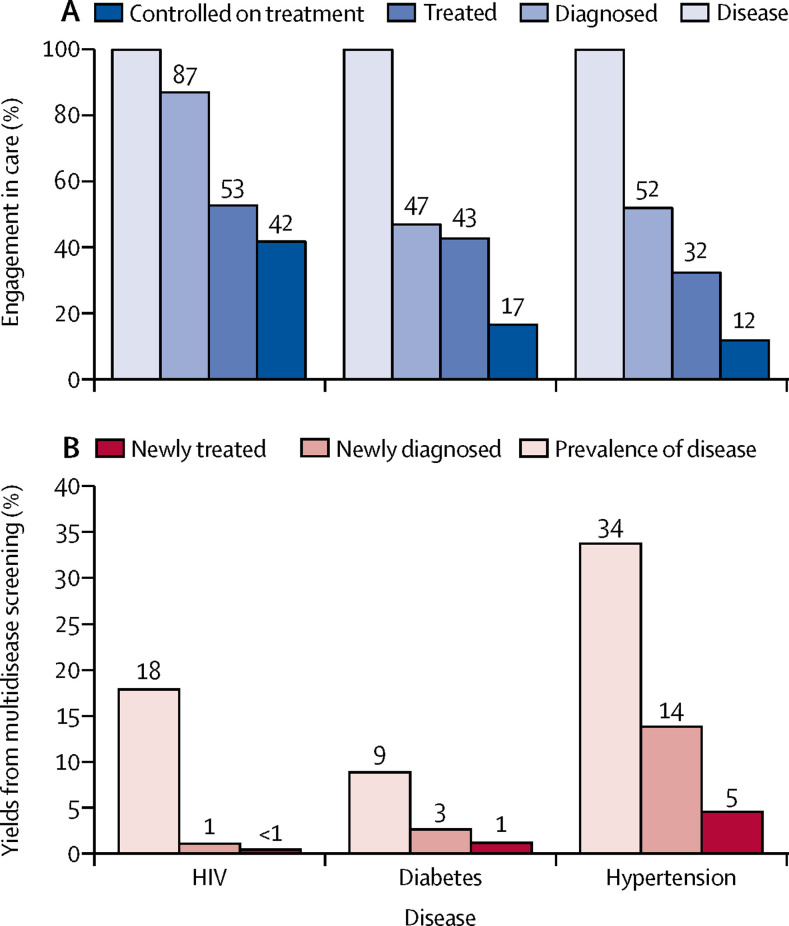
South African health statistics and the potential effects of multidisease screening (A) HIV estimates are obtained from the Thembisa model estimates for 2016, whereas diabetes and hypertension estimates are from the 2012 South African National Health and Nutrition Examination Survey. Controlled on treatment is defined in the case of HIV as having a viral load less than 400 copies per mL, and in the case of diabetes as a HbA1c concentration less than 7%. Estimates of treatment coverage and control rates among hypertension cases are obtained from a national survey in 2010. (B) The expected fraction of screened individuals testing positive, the expected fraction of newly diagnosed individuals, and the expected fraction of individuals linking to treatment services in the context of a multidisease screening programme implemented between 2018 and 2028.
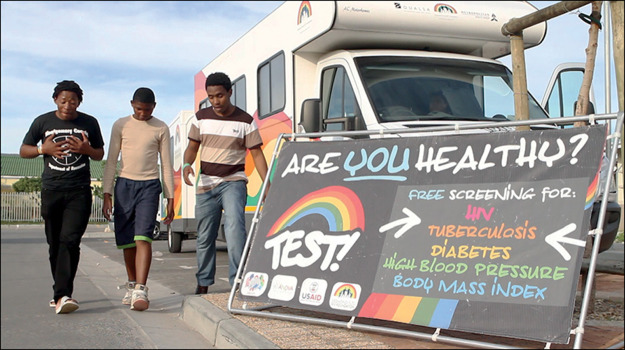
Differented care in South Africa—The Tutu Tester mobile screening programme for HIV, tuberculosis, diabetes, hyptertension, and body-mass index Credit: Desmond Tutu HIV Research Foundation/Alexis Dominguez.
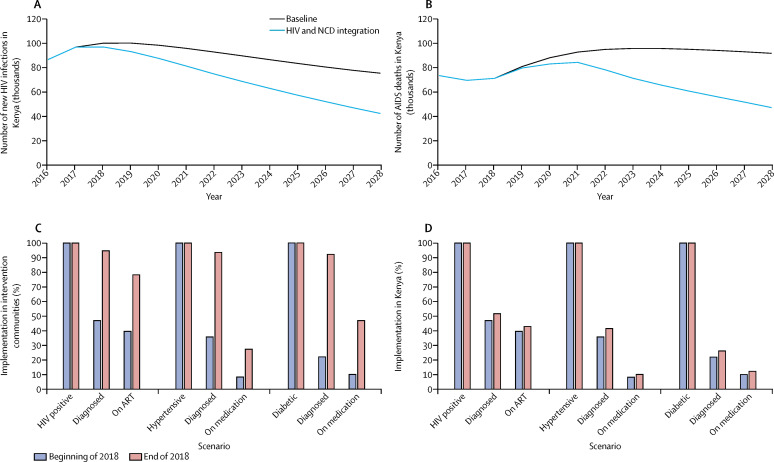
Projected effects of HIV and NCD integration scenarios in Kenya (A–B) The projected effect of the intervention on the number of new HIV infections and AIDS deaths in Kenya in the next decade (2018–28). (A) Effects of the care cascade in intervention communities in 2018, and similar patterns of improvement in cascades are expected for each new set of intervention communities. (B) Improvements in care cascades in 2018 averaged for the whole country. National care cascades are expected to continue to improve through the end of programme in 2028. (C–D) The care cascades for HIV, hypertension, and diabetes in adults before and after first year (2018) of implementation in intervention communities and in Kenya, respectively. Intervention communities constitute representative 10% of the adult population (aged ≥15 years), with assumption of 90% screening uptake and treatment uptake after diagnosis of 81% for HIV, 23% for hypertension, and 45% for diabetes. NCD=non-communicable disease. ART=antiretroviral therapy.
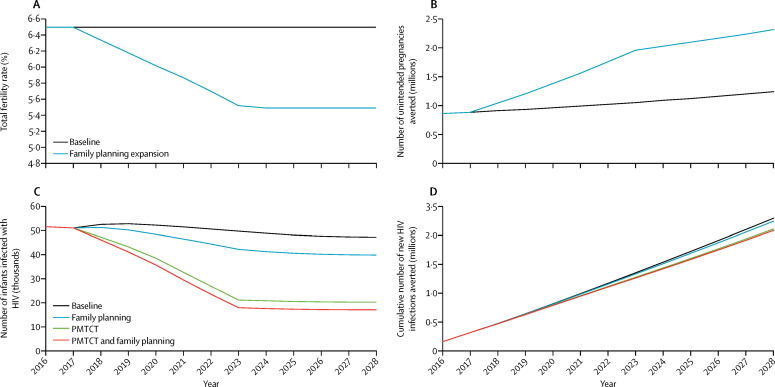
Projected effects of HIV and reproductive health services integration scenarios in Nigeria (A) Total fertility rate. (B) Number of unintended pregnancies averted. (C) Number of infants infected with HIV. (D) Cumulative number of new HIV infections in Nigeria. Scenarios include expansion of family planning services by increasing the prevalence of contraceptive use from 16% at baseline to 31% in 2023, and expansion of PMTCT by increasing the coverage to reach 90% of HIV-positive pregnant women in Nigeria by year 2023, compared against baseline levels in Nigeria. PMTCT=prevention of mother-to-child transmission.
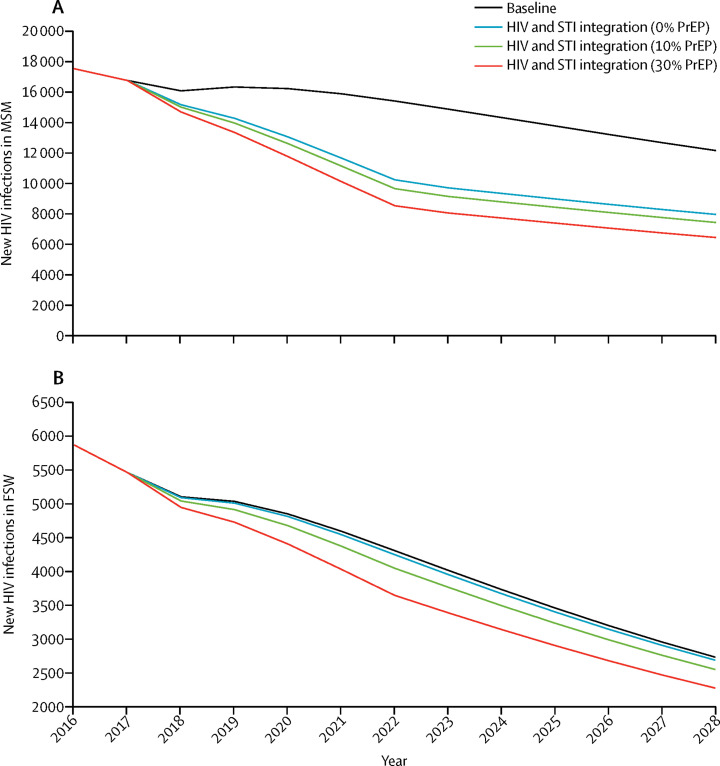
Projected effects of HIV and sexually transmitted infection services integration scenarios for MSM and FSW in India The number of new HIV infections in (A) MSM and (B) FSW. Intervention scenarios include expansion of ART coverage in MSM (from 43% to 73%) and FSW (from 29% to 81%) with no PrEP, at a low PrEP coverage of 10%, and at a high PrEP coverage of 30%. Each scenario is modelled as a gradual increase in coverage of ART and PrEP in MSM and FSW from 2018 to 2023, continued at a fixed coverage afterward (2024 to 2028). MSM=men who have sex with men. FSW=female sex workers. PrEP=pre-exposure prophylaxis. STI=sexually transmitted infections.
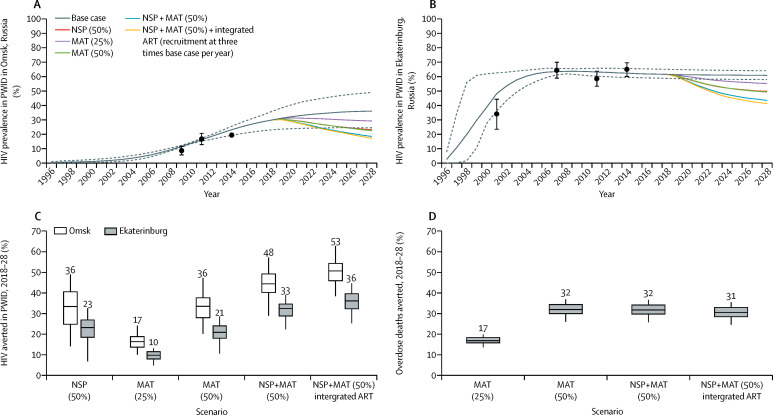
Model projections of the effect of integrated harm reduction and HIV services in two Russian cities Model projections of (A) median HIV prevalence in PWID in Omsk, Russia, (B) median HIV prevalence in PWID in Ekaterinburg, Russia, (C) proportion HIV infections averted in PWID in 2018–28, and (D) proportion of fatal overdoses averted in PWID in 2018–28 with various levels of intervention scale-up. Scenarios include no harm reduction or ART (base case), expansion of NSPs to 50% coverage in PWID (NSP 50%), expansion of MAT to 25% or 50% of PWID (MAT 25%; MAT 50%), combination MAT and NSP to 50% of PWID (MAT+NSP 50%), or combination MAT and NSP to 50% of PWID integrated with ART recruited at three times the base-case recruitment rate of HIV-infected PWID on harm reduction per year from 2018. Observed HIV prevalence data in PWID shown as black circles and 95% CI; dashed lines are 2·5–97% uncertainty bounds. Box plots indicate the median (middle line) projections, 25–75% percentile range (boxes), and 2·5–97·5% percentile range (whiskers), and median estimates reported above box plots. PWID=people who inject drugs. ART=antiretroviral therapy. MAT=medication-assisted therapy. NSP=needle and syringe programme.
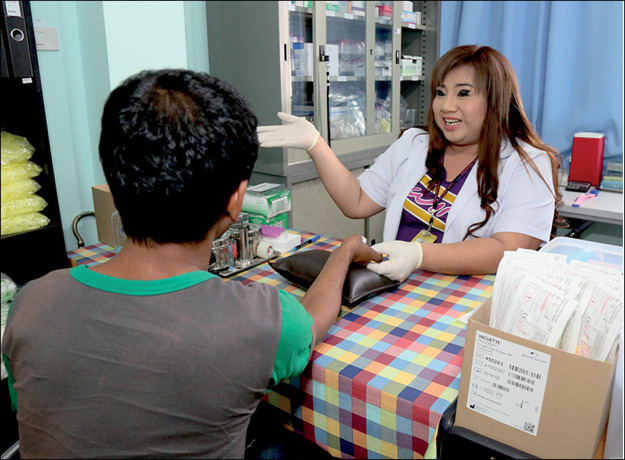
Community-led prevention providing combination prevention including pre-exposure prophylaxis to their peers in Thailand Credit: © Richard Nyberg, USAID.
Comment in
-
The HIV response and global health.Lancet. 2019 Apr 27;393(10182):1695-1696. doi: 10.1016/S0140-6736(19)30355-1. Lancet. 2019. PMID: 31034373 No abstract available.
-
The HIV response and global health.Lancet. 2019 Apr 27;393(10182):1696. doi: 10.1016/S0140-6736(19)30353-8. Lancet. 2019. PMID: 31034374 No abstract available.
-
A COVID-19 conference at AIDS 2020: Virtual.Lancet. 2020 May 23;395(10237):1598-1599. doi: 10.1016/S0140-6736(20)31026-6. Epub 2020 Apr 30. Lancet. 2020. PMID: 32359401 Free PMC article. No abstract available.
References
-
- AIDSInfo Joint United Nations Programme on HIV/AIDS. http://aidsinfo.unaids.org - PubMed
-
- UN . Joint United Nations Programme on HIV/AIDS; Geneva: 2017. Ending AIDS. Progress towards the 90–90–90 targets.
Publication types
MeSH terms
Substances
Grants and funding
LinkOut - more resources
Full Text Sources
Other Literature Sources
Medical
