. 2018 Aug 2;103(2):171-187.
doi: 10.1016/j.ajhg.2018.06.009. Epub 2018 Jul 19.

Identifying Genes Whose Mutant Transcripts Cause Dominant Disease Traits by Potential Gain-of-Function Alleles

Affiliations

Identifying Genes Whose Mutant Transcripts Cause Dominant Disease Traits by Potential Gain-of-Function Alleles

Zeynep Coban-Akdemir et al. Am J Hum Genet. .

Abstract

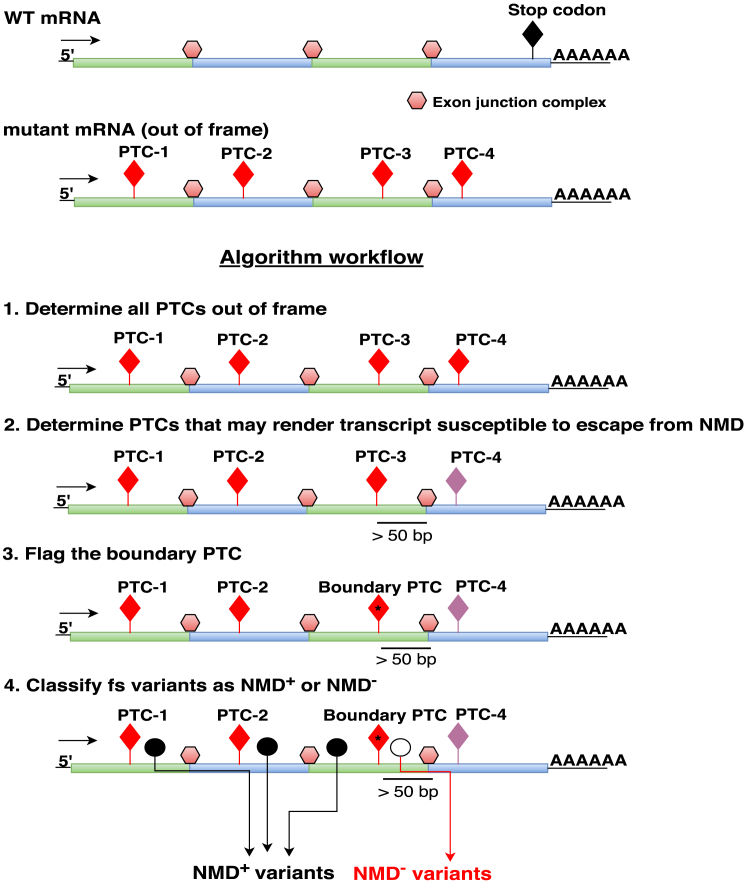
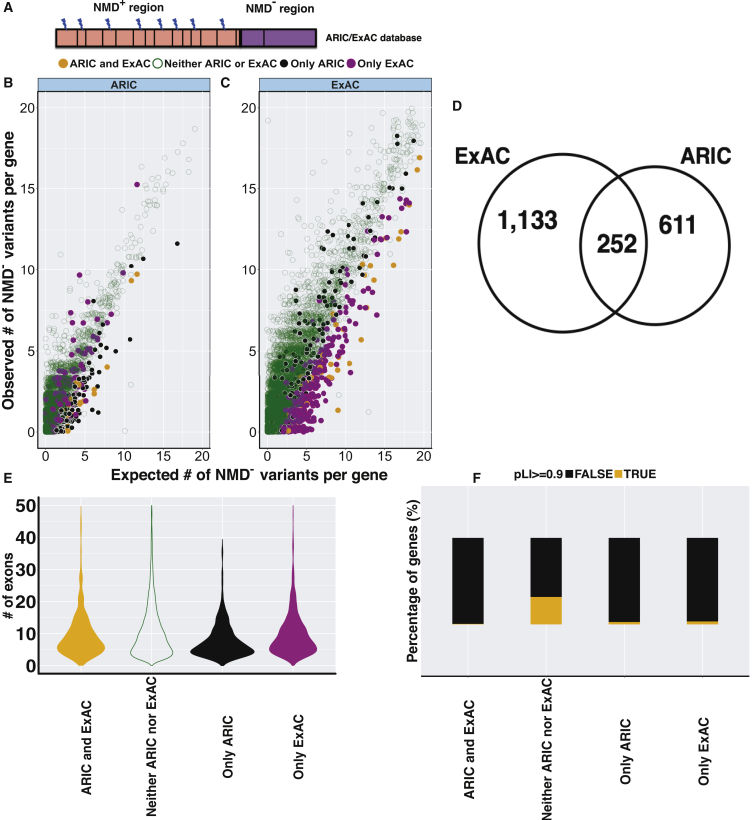
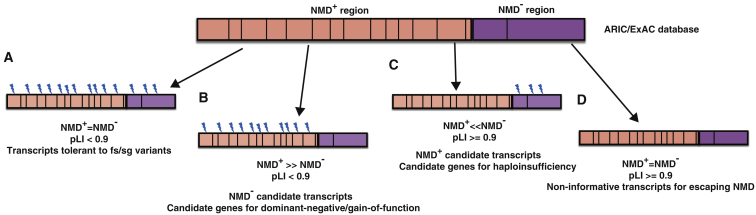
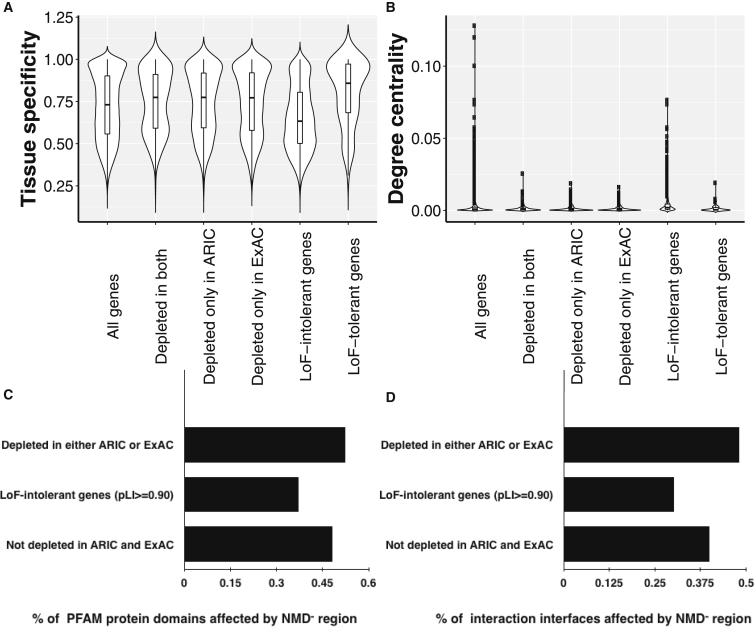
Premature termination codon (PTC)-bearing transcripts are often degraded by nonsense-mediated decay (NMD) resulting in loss-of-function (LoF) alleles. However, not all PTCs result in LoF mutations, i.e., some such transcripts escape NMD and are translated to truncated peptide products that result in disease due to gain-of-function (GoF) effects. Since the location of the PTC is a major factor determining transcript fate, we hypothesized that depletion of protein-truncating variants (PTVs) within the gene region predicted to escape NMD in control databases could provide a rank for genic susceptibility for disease through GoF versus LoF. We developed an NMD escape intolerance score to rank genes based on the depletion of PTVs that would render them able to escape NMD using the Atherosclerosis Risk in Communities Study (ARIC) and the Exome Aggregation Consortium (ExAC) control databases, which was further used to screen the Baylor-Center for Mendelian Genomics disease database. This analysis revealed 1,996 genes significantly depleted for PTVs that are predicted to escape from NMD, i.e., PTVesc; further studies provided evidence that revealed a subset as candidate genes underlying Mendelian phenotypes. Importantly, these genes have characteristically low pLI scores, which can cause them to be overlooked as candidates for dominant diseases. Collectively, we demonstrate that this NMD escape intolerance score is an effective and efficient tool for gene discovery in Mendelian diseases due to production of truncated or altered proteins. More importantly, we provide a complementary analytical tool to aid identification of genes associated with dominant traits through a mechanism distinct from LoF.

Keywords: NMD escape intolerance scores; NMDEscPredictor; WES analysis; antimorphic; bioinformatic tool; dominant negative; frameshift alleles; genotype-phenotype correlations; nonsense-mediated decay; stopgain variants.


Figures

Figure 1
Figure 1
NMDEscPredictor Algorithm Workflow Horizontal lines denote transcripts with alternating different exons shaded green or blue. The exon junction complex is demarcated by a light red hexagon and the position of stop codon is shown (lollipop structure with filled black diamond on top). For each multi-exon transcript in the Ensembl reference set (version 19), we first determined all potential PTCs (shown as lollipop structures with filled red diamonds marking the map position in transcript) in the −1 and +1 frames. Second, we identified PTCs that may result in the transcript escaping from NMD based on the 50-bp rule (lollipop structures with filled purple diamond)., , At the third step of the algorithm, we flagged the PTC upstream of the first PTC that can escape from NMD and labeled it as the boundary PTC (lollipop structure with filled starred red diamond). Transcripts with frameshift (fs) variants located upstream of the boundary PTC are predicted to undergo degradation by NMD (NMD+ transcripts and NMD+ variants) (filled black circle), whereas variants located downstream of the boundary PTC are predicted to escape NMD (NMD transcripts and NMD variants) (open white circle).
Figure 2
Figure 2
Evaluation of the NMDEscPredictor Algorithm Performance using GTEx Data To test the algorithm performance in an independent dataset, we used GTEx multi-tissue RNA-seq and WES dataset to predict NMD incompetency of 344 distinct frameshift variants available in GTEx. The frameshift variants predicted to be NMD+ by NMDEscPredictor have a significantly lower ratio of variant read count (VAR_COUNT) to the total read count (TOTAL_COUNT) compared to those frameshift variants predicted to be NMD. This is consistent with the hypothesis that NMD+ variants will lead to mRNA degradation. VAR_COUNT to TOTAL_COUNT values were extracted from allele-specific expression available in the GTEx dataset. Tissue abbreviations are denoted as follows: ADPSBQ, adipose, subcutaneous; ARTAORT, artery, aorta; ARTTBL, artery, tibial; BRNACC, brain, anterior cingulate cortex; BRNCTXA, brain, cortex; BRNCTXB, brain, frontal cortex; BRNHPT, brain, hypothalamus; BRNPTM, brain, putamen (basal ganglia); BRNSNG, brain, substantia nigra; ESPMCS, esophagus, mucosa; FIBRBLS, cells, transformed fibroblasts; HRTAA, heart, atrial appendage; HRTLV, heart, left ventricle; LUNG, lung; MSCLSK, muscle, skeletal; PNCREAS, pancreas; SKINS, skin, sun exposed (lower leg); WHLBLD, whole blood.
Figure 3
Figure 3
Distribution of the Boundary PTCs in All Ensemble Multi-exon Transcripts Above demarcates an individual transcript (horizontal rectangular structure) with exon junction and boundary PTC (lollipop with red filled diamond) shown as in Figure 1. Horizontal lines with double arrowheads demarcate NMD+ (pink) and NMD (purple) regions. Each transcript is partitioned into two separate regions, i.e., NMD+ and NMD, based on the location of the boundary PTCs. (A) The bar plots show the relative distribution of boundary PTCs per transcript (percentile). About 51.1% and 49.2% of all Ensemble multi-exon transcripts have their boundary PTCs located within 85% of the normalized transcript length in the −1 and +1 frame, respectively. However, there are still a quarter of transcripts that have their NMD regions encompassing more than a third of their coding sequence length. (B) The bar plots demonstrate the distribution of boundary PTC locations with regards to the distance to the final exon of a given transcript. About 35.3% and 33.4% of all Ensemble multi-exon transcripts have their boundary PTCs located upstream of their penultimate exon in the −1 and +1 frame, respectively.
Figure 4
Figure 4
Classification of Protein-Truncating Variants in ARIC, Baylor-CMG, and ExAC Databases Bar charts display the percentage of −1 frameshift, +1 frameshift, and stopgain variants as predicted to be NMD and NMD+ according to NMDEscPredictor in the (A) ARIC database, (B) Baylor-CMG database, and (C) ExAC database.
Figure 5
Figure 5
Features of the Top 5% Depleted Genes for NMD Variants in Control Databases (A) General structure of a transcript displaying NMD+ (pink) and NMD (purple) regions; lightning symbols represent variant location. Vertical black lines represent potential PTCs. (B and C) To identify genes that were depleted for truncating variants in NMD region compared to NMD+ region in control databases, we compared the expected to the observed number of NMD variants per gene (please see Material and Methods section) variants in the (B) ARIC database and (C) ExAC database. Genes depleted for NMD variants in both (ARIC and ExAC) were shown as orange filled dots; genes depleted for NMD variants only in ARIC database were shown as black filled dots; genes depleted for NMD variants only in ExAC database were shown as purple filled dots and genes not depleted for NMD variants in either control database were shown as dark green empty circles. (D) The Venn diagram shows 1,385 and 863 genes as the top 5% depleted genes for variants in NMD region in the ExAC and ARIC databases, respectively; 252 genes were common to both. (E) The violin plots show that genes depleted for NMD variants in both databases (ARIC and ExAC; filled yellow violin) do not significantly differ in number of exons from genes not depleted for NMD variants in either control database (neither ARIC or ExAC; open green violin). (F) Stacked bar plots indicate that genes depleted for NMD variants in both (n = 252) or either database (n = 611; n = 1,133) have significantly higher proportion of genes with pLI < 0.9 compared to genes not depleted for NMD variants in either control database (n = 14,425) with p values = 1.49e−25, 1.09e−46, and 2e−78, respectively. Orange bar shows the percentage of genes with pLI ≥ 0.9 and black bar shows the percentage of genes with pLI < 0.9.
Figure 6
Figure 6
Classification of Transcripts Based on Truncating Variant Density in NMD versus NMD+ Region in Control Databases Allows Development of NMD Escape Intolerance Score Transcripts were classified into four groups based on truncating variant density in the NMD versus NMD+ region in ARIC/ExAC control databases. Vertical black lines represent potential PTCs. Lightning symbols represent variant location. (A) Transcripts tolerant to frameshift(fs)/stopgain(sg) have truncating variant densities in NMD versus NMD+ regions that do not differ significantly from each other. Those transcripts mostly presented with low pLI scores. (B) NMD candidate transcripts: transcripts in this category present with a lower NMD region variant density compared to NMD+ region and often display low pLI scores < 0.9. The genes corresponding to those transcripts are candidates for causing disease through dominant-negative or GoF effects. (C) NMD+ candidate transcripts in this category present with a lower NMD+ region truncating variant density compared to NMD region and may present with high pLI scores. The genes corresponding to those transcripts are candidates for causing disease through haploinsufficiency. (D) Non-informative transcripts: this category of transcripts includes transcripts currently with no truncating variants in the control databases, therefore was considered non-informative.
Figure 7
Figure 7
Tissue Specificity and Protein Characterization of 1,996 Genes (Top 5%) Depleted for Truncating Variants in NMD Region in the Control Databases For all the genes analyzed in the genome (n = 16,411), genes depleted for truncating variants in NMD region in both databases (n = 252), in only ARIC database (n = 611), in only ExAC database (n = 1,133), LoF-intolerant genes (pLI ≥ 0.9) (n = 2,959) and LoF-tolerant genes (n = 98), we calculated the following. (A) Tissue specificity values using tau measure. The tau measure takes values between 0 and 1; when a gene’s tau measure is closer to 1, it is annotated as more tissue specific. The average tau measure of depleted genes for truncating variants in NMD region in either control database (N = 1,996) is significantly higher (0.744) compared to the genome average (0.719, Mann-Whitney U test p value = 5.89e−8) and compared to LoF-intolerant genes (0.651, Mann-Whitney U test p value = 7.45e−62). (B) To measure how connected a gene product is to its neighbors in a physical protein-protein interaction network, we calculated a degree centrality measure, i.e., the number of edges that a node has in a network, for each gene using the physical interactions network data provided by GeneMania in a R/Bioconductor package named SpidermiR. This analysis revealed that the genes predicted to be intolerant to truncating variants in NMD region in either control database by NMDEscPredictor (N = 1,996) are significantly less connected to their neighbors in the physical protein-protein interaction data compared to the genome average (Mann-Whitney U test p value = 1.67e−12). (C and D) Those genes were annotated with their PFAM protein domains and their structurally resolved interaction interfaces. Transcripts depleted for NMD variants show a higher fraction of their annotated PFAM protein domains (0.525) overlapping with their corresponding NMD regions compared to the average of all transcripts (0.483) with binomial test p value = 0.0003. In a similar way, these transcripts present a higher fraction of their structurally resolved interaction interfaces overlapping to the NMD regions (0.46) compared to the average of all transcripts (0.407) with binomial test p value = 0.045.

References

    1. Kervestin S., Jacobson A. NMD: a multifaceted response to premature translational termination. Nat. Rev. Mol. Cell Biol. 2012;13:700–712. - PMC - PubMed
    1. Kurosaki T., Maquat L.E. Nonsense-mediated mRNA decay in humans at a glance. J. Cell Sci. 2016;129:461–467. - PMC - PubMed
    1. Lykke-Andersen S., Jensen T.H. Nonsense-mediated mRNA decay: an intricate machinery that shapes transcriptomes. Nat. Rev. Mol. Cell Biol. 2015;16:665–677. - PubMed
    1. Le Hir H., Izaurralde E., Maquat L.E., Moore M.J. The spliceosome deposits multiple proteins 20-24 nucleotides upstream of mRNA exon-exon junctions. EMBO J. 2000;19:6860–6869. - PMC - PubMed
    1. Singh G., Kucukural A., Cenik C., Leszyk J.D., Shaffer S.A., Weng Z., Moore M.J. The cellular EJC interactome reveals higher-order mRNP structure and an EJC-SR protein nexus. Cell. 2012;151:750–764. - PMC - PubMed

Publication types

Substances

LinkOut - more resources