. 2018 Aug 8;99(3):525-539.e10.
doi: 10.1016/j.neuron.2018.06.036. Epub 2018 Jul 19.

Visual Experience-Dependent Expression of Fn14 Is Required for Retinogeniculate Refinement

Affiliations

Visual Experience-Dependent Expression of Fn14 Is Required for Retinogeniculate Refinement

Lucas Cheadle et al. Neuron. .

Abstract

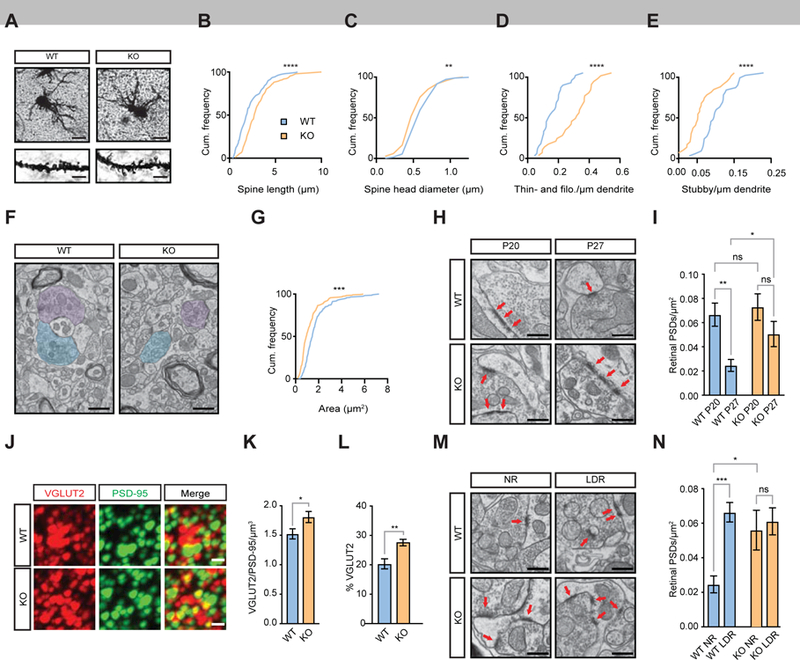
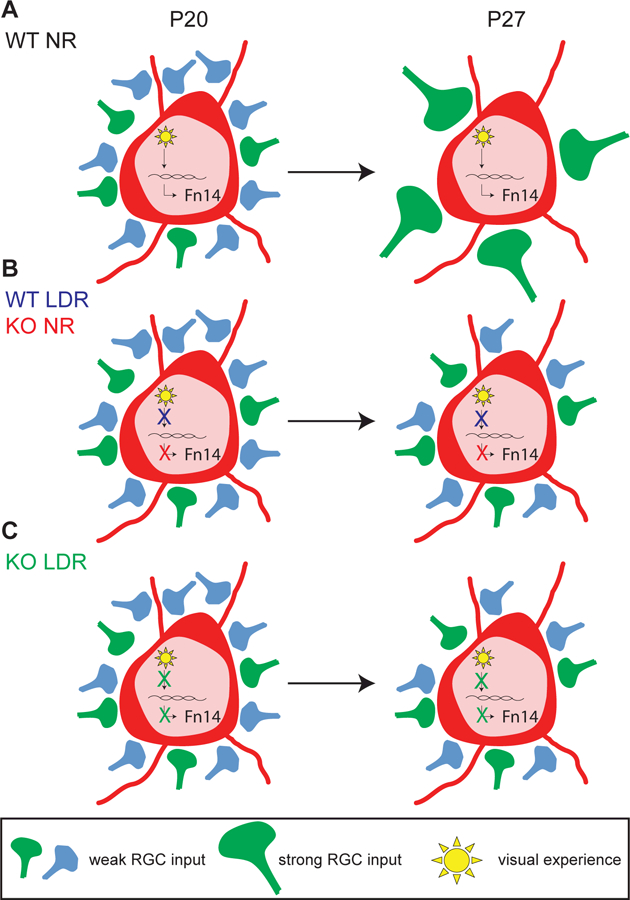
Sensory experience influences the establishment of neural connectivity through molecular mechanisms that remain unclear. Here, we employ single-nucleus RNA sequencing to investigate the contribution of sensory-driven gene expression to synaptic refinement in the dorsal lateral geniculate nucleus of the thalamus, a region of the brain that processes visual information. We find that visual experience induces the expression of the cytokine receptor Fn14 in excitatory thalamocortical neurons. By combining electrophysiological and structural techniques, we show that Fn14 is dispensable for early phases of refinement mediated by spontaneous activity but that Fn14 is essential for refinement during a later, experience-dependent period of development. Refinement deficits in mice lacking Fn14 are associated with functionally weaker and structurally smaller retinogeniculate inputs, indicating that Fn14 mediates both functional and anatomical rearrangements in response to sensory experience. These findings identify Fn14 as a molecular link between sensory-driven gene expression and vision-sensitive refinement in the brain.

Keywords: LGN; lateral geniculate nucleus; retinogeniculate; single-cell; single-nucleus; synapse; synapse elimination; synaptic refinement; visual thalamus.


Figures

Figure 1.
Figure 1.. Single-cell transcriptomics of the dLGN following visual stimulation.
(A) Schematic of the experimental paradigm in which mice were dark-reared during the vision-sensitive period of refinement then reexposed to light for zero, one, or eight hours. RNA from single cells of the dorsal LGN (dLGN) was sequenced via inDrops. (B) Confocal images of FISH on coronal dLGN sections from mice late-dark-reared between P20 and P27 then reexposed to light for zero or one hour. Sections were probed for the excitatory neuron marker Vglut1 (red) and the activity-dependent immediate early gene Fos (green). Scale bar, 5 μm. (C) Quantification of the number of individual Fos mRNA molecules per Vglut1-positive neuron, as shown in (B). Unpaired t-test. (D) Expression pattern of the excitatory neuron marker Slc17a6 across all cell clusters. Scale, 0 to 125 transcripts per cell (log2). (E) Expression pattern of the inhibitory neuron marker Gad1 across all cell clusters. Scale, 0 to 54 transcripts per cell (log2). (F) Bar graphs displaying the specificity of excitatory and inhibitory markers within each cell population. Left, expression of the excitatory marker Slc17a6. Right, expression of the inhibitory marker Gad1. Y-axis, normalized mean transcript count per cell. (G-J) Scatterplots comparing gene expression, displayed as log10 values of transcripts per cell, in neuronal subpopulations of mice stimulated for one or eight hours (y-axes) versus unstimulated zero hour controls (x-axes). (G) excitatory neurons at one hour; (H) inhibitory neurons at one hour; (I) excitatory neurons at eight hours (inset shows higher magnification for comparison of Fn14 induction with other genes); and (J) inhibitory neurons at eight hours. Genes up-regulated by at least 1.5-fold, FDR < 0.05 shown in red. Genes down-regulated by at least 1.5-fold, FDR < 0.05 shown in blue. **** = p < 0.0001. All error bars represent S.E.M. See also Figure S1 and Table S1.
Figure 2.
Figure 2.. Developmental and experience-dependent expression of Fn14 mRNA and protein.
(A) Validation by qPCR of Fn14 mRNA induction in the dLGN of mice reexposed to light following late-dark-rear (LDR), normalized to Gapdh expression. (B) Validation by qPCR of Fn14 mRNA expression in the dLGN across postnatal development in normally reared (NR) mice, normalized to Gapdh expression. (C) Western blot of dLGN lysates from mice following LDR and reexposure to light, probed for Fn14. GAPDH, loading control. (D) Quantification of Fn14 protein in the dLGN following reexposure to light, as shown in (E). (E) Western blot of dLGN lysates from NR and LDR mice at P27. Blot probed for Fn14. GAPDH, loading control. (F) Quantification of Fn14 protein in dLGN of NR and LDR mice. (G) Western blot of dLGN lysates from mice at multiple time points across postnatal development, probed for Fn14. GAPDH, loading control. (H) Quantification of Fn14 protein levels across postnatal development, as shown in (G). Statistical significance was assessed by one-way ANOVA with Dunnett’s test except for (F), which was determined by unpaired t-test. *= p < 0.05; **= p <0.01; ***= p < 0.001; ****= p < 0.0001. All error bars represent S.E.M. See also Figure S2.
Figure 3.
Figure 3.. Fn14 expression is enriched in excitatory TC neurons of the dLGN.
(A) Low magnification confocal images of Fn14 (green) and Vglut1 (red) mRNA expression, and DAPI (blue) in (a) dLGN (outlined), (b) visual cortex, (c) auditory cortex, and (d) hippocampus. Scale bar, 200 μm. (B) High magnification confocal images of FISH for Fn14 (green) and molecular markers for all major cell types in the dLGN (red). White squares = insets, below (left to right: molecular marker, Fn14, merge). (a) Vglut1; (b) Gad1; (c) Olig1; (d) P2ry12; (e) Cldn5; and (f) Aldh1l1. Scale bar, 10 μm. Inset scale bar, 4 μm. (C) Quantification of the percentage of Fn14-expressing cells labeled with listed cell type markers. (D) High magnification confocal images of individual TC neurons in the dLGN of wild type mice following LDR and reexposure to light, or unstimulated controls (zero hours). TC neurons express Vglut1 (red) along with increasing levels of Fn14 (green). Scale bar, 5 µm. (E) Quantification of Fn14 mRNA molecules per TC neuron at each time point. (F) Confocal images of FISH for Fn14 (green) and Vglut1 (red) in normally reared animals at P20 and P27, the time points flanking the vision-sensitive period. Scale bar, 10 µm. Statistical analyses, one-way ANOVA with Dunnett’s test. *** = p < 0.001; **** = p < .0001. All error bars represent S.E.M.
Figure 4.
Figure 4.. Fn14 regulates pre- and postsynaptic morphology.
(A) Brightfield images of Golgi-stained dLGN neurons. Scale bar, 25 µm. Inset scale bar, 3.5 µm. (B) Cumulative frequency distribution of spine length in WT and Fn14 KO neurons at P27. WT = blue; KO = orange. (C) Cumulative frequency distribution of spine head diameter in WT and Fn14 KO neurons at P27. (D) Cumulative frequency distribution of filopodia and thin spine density in WT and Fn14 KO neurons at P27. (E) Cumulative frequency distribution of stubby spine density in WT and Fn14 KO neurons at P27. (F) Electron micrographs of dLGN sections from WT and Fn14 KO mice at P27. Retinogeniculate boutons are shaded in blue and purple. Scale bar, 500 nm. (G) Cumulative frequency distribution graph of bouton area (µm2) at P27. (H) Electron micrographs of retinogeniculate boutons and associated PSDs at P20 and P27 in WT and Fn14 KO mice. Arrows, individual PSDs adjacent to morphologically identified retinogeniculate boutons. Scale bar, 500 nm. (I) Quantification of retinal PSDs per µm2 in WT and Fn14 KO mice at P20 and P27. Fn14 KO dLGNs contain 39% more PSDs than WT at P27. 2-way ANOVA and Bonferroni correction. (J) Confocal images of the dLGN following array tomography for the retinogeniculate presynaptic marker VGLUT2 and the postsynaptic marker PSD-95. Scale bar, 200 nm. (K) Fn14 KO mice maintain significantly more colocalized synaptic puncta than WT mice. Unpaired t-test. (L) A greater percentage of VGLUT2 puncta in the KO is associated with PSD-95. Unpaired t-test. (M) Electron micrographs of the LGN of WT and Fn14 KO mice at P27 after normal rearing (NR) or late-dark-rearing (LDR). Arrows, individual PSDs of retinogeniculate synapses. Scale bar, 500 nm. (N) Retinal PSD densities per µm2 across all conditions. 2-way ANOVA and Bonferroni correction. Statistical significance of differences between cumulative frequency distributions determined by Kolmogorov-Smirnov test, other statistical analyses given above. * = p < 0.05; ** = p < 0.01; *** = p < 0.001; **** = p < .0001. Error bars represent S.E.M. See also Figures S3 and S4 and Tables S3 and S4.
Figure 5.
Figure 5.. Retinogeniculate synaptic connectivity is normal in P13 Fn14 KO mice.
(A) Example recordings from P13 WT (top) and P13 Fn14 KO (bottom) mice demonstrating appropriate synaptic connectivity in Fn14 KO mice. Recordings show overlaid AMPAR-mediated inward currents recorded at −70 mV and AMPAR- and NMDAR-mediated outward currents recorded at +40 mV from the same cell. EPSCs were evoked with incremental increases in optic tract stimulation, and their peak amplitudes are plotted to the right of each recording. Arrows, single fibers. Y-axis, current (nA). X-axis, stimulus intensity (µA). (B) AMPAR- and NMDAR-mediated single fiber strengths (top), and maximal EPSC amplitudes (bottom) are not significantly different between WT and Fn14 KO mice. Mann-Whitney U test, p > 0.05. (C-E) AMPAR/NMDAR ratio (C), fiber fraction (D), and decay kinetics of the EPSC at - 70 mV (E, left and middle), and at +40 mV (E, right) are also not significantly different in P12-P15 WT and Fn14 KO mice. For (B), n (WT) = 31 single fibers from 5 mice; n (KO) = 33 single fibers from 8 mice. For (B-E), n (WT) = 24 cells from 5 mice; n (KO) = 30 cells from 8 mice. ns: p > 0.05, Mann-Whitney two-tailed test. Box, 25%−75% interquartile range; whiskers, 10%−90% interquartile range. See also Figure S5 and Table S2.
Figure 6.
Figure 6.. Fn14 is required for refinement of the retinogeniculate synapse during the vision-sensitive period.
(A) Cumulative probability plots of AMPAR-mediated single fiber EPSCs show a significant shift toward stronger retinal inputs from P20 to P27 in WT mice (left), but no shift in strength of retinal inputs from P20 to P27 in Fn14 KO mice (right). Mann-Whitney two-tailed test. (B) Significant strengthening of AMPAR-mediated single fiber EPSCs from P20 to P27 in WT, but not Fn14 KO mice. Kruskal-Wallis, Dunn’s multiple comparisons test. (C) AMPAR-mediated maximal EPSCs at −70 mV do not differ across development in WT and Fn14 KO mice, Kruskal-Wallis, Dunn’s multiple comparisons test. n (AMPAR) = P20 WT: 28 cells from 9 mice; P27 WT: 39 cells from 15 mice; P20 KO: 32 cells from 9 mice; P27 KO: 45 cells from 14 mice. (D) The degree of retinal convergence for each TC neuron significantly decreased from P20 to P27 in WT mice, shown by the significant increase in the FF, whereas the FF did not significantly increase from P20 to P27 in Fn14 KO mice. The P27 KO FF is significantly lower than that of P27 WT mice. n = P20 WT: 21 cells from 9 mice; P27 WT: 29 cells from 15 mice; P20 KO: 21 cells from 9 mice; P27 KO: 28 cells from 14 mice; Kruskal-Wallis, Dunn’s multiple comparisons test. For (B-D), Box, 25%−75% interquartile range; whiskers, 10%−90% interquartile range. (E) Representative recordings of evoked quantal events from P27 WT and Fn14 KO mice in an extracellular solution containing 4 mM SrCl2 and 1 mM MgCl2. The stimulus artifact is blanked and the synchronous EPSC is abridged for clarity. Arrows, time of optic tract stimulation. (F) Representative recordings of paired-pulse depression at −70 mV from P27 WT and Fn14 KO mice measured at 50, 100, 250, and 500 ms inter-stimulus intervals (ISIs). Stimulus artifacts are blanked for clarity. (G) Cumulative probability distributions of quantal amplitudes from P27 WT and Fn14 KO mice revealed a ~15% larger median evoked mEPSC amplitude in Fn14 KO mice (18.7 pA) relative to WT mice (16.3 pA). WT: n = 2464 events from 4 cells; KO: n = 2473 events from 4 cells, Mann-Whitney two-tailed test. (H) Paired pulse ratio (PPR = A2/A1) did not significantly differ between WT and KO mice at P27 at all ISIs (∆t) tested, p > 0.05, Kruskal-Wallis, Dunn’s multiple comparisons test. A1 and A2 correspond to the peak amplitudes of the first and second EPSC, respectively. WT: n=15 cells from 3 mice; KO: n=15 cells from 3 mice. ns = p > 0.05; * = p < 0.05; *** = p < 0.001; **** = p < 0.001. See also Figure S6 and Table S2.
Figure 7.
Figure 7.. Fn14-dependent refinement is driven by sensory experience.
(A) Example recordings from P27 normally reared WT mice (NR WT, Left) and late dark-reared WT mice (LDR WT mice, Right) demonstrating failure of synaptic refinement after LDR. Incremental increases in optic tract stimulation evoked EPSCs of varying amplitudes, which are plotted below each recording. Stimulus artifacts are blanked for clarity. Arrows, single fibers. (B) Example recordings from P27 NR Fn14 KO (KO NR, Left), and LDR KO mice (KOLDR, Right) and accompanying current by stimulus intensity plots showing no change in connectivity following visual deprivation. Arrows, single fibers. KO NR traces in this example display a small input that is activated at stimulus intensities higher than 50 µA. Such asynchrony in these doublets and triplets are rare, but do occur in both WT and KO mice. (C) The degree of retinal convergence for each TC neuron is significantly lower in LDR WT mice than in normally reared P27 WT mice, shown by the significant difference in the FF, whereas the FF was not significantly different between normally reared Fn14 KO mice and LDR KO mice. (D) Ratio of maximal AMPAR EPSC amplitude to maximal NMDAR EPSC amplitude is significantly lower in LDR WT mice than P27 normally reared WT mice, but not in LDR KO mice and P27 normally reared KO mice. (E) Increased maximal NMDAR-mediated EPSC amplitudes in LDR WT mice relative to P27 NR WT mice, but not in LDR KO mice vs. P27 NR KO mice. (F) Increased NMDAR decay 𝝉 values (ms) in LDR WT mice relative to P27 NR WT mice, but not in LDR KO mice and P27 NR KO mice. For (C-F), Box, 25%−75% interquartile range; whiskers, 10%−90% interquartile range. n = P27 WT: 29 cells from 15 mice; LDR WT: 24 cells from 9 mice; P27 KO: 28 cells from 14 mice; LDR KO: 28 cells from 6 mice;* = p < 0.05, ns = p > 0.05, ** = p < 0.01, *** = p < 0.001, Kruskal-Wallis, Dunn’s multiple comparisons test. Details provided in Table S2.
Figure 8.
Figure 8.. Model of Fn14-dependent vision-sensitive refinement.
(A) In NR WT mice, visual experience induces the expression of Fn14 to drive strengthening of retinogeniculate connections and concomitant elimination of weak inputs. These aspects of experience-dependent refinement are impaired in the absence of Fn14 (B, red), visual experience (B, blue), or both (C). See also Figure S7.

Similar articles

Cited by

References

    1. Andreae LC, and Burrone J (2017). The role of spontaneous neurotransmission in synapse and circuit development. J Neurosci Res - PMC - PubMed
    1. Arnoux I, and Audinat E (2015). Fractalkine Signaling and Microglia Functions in the Developing Brain. Neural Plast 2015, 689404. - PMC - PubMed
    1. Berry KP, and Nedivi E (2017). Spine Dynamics: Are They All the Same? Neuron 96, 43–55. - PMC - PubMed
    1. Bloodgood BL, Sharma N, Browne HA, Trepman AZ, and Greenberg ME (2013). The activity-dependent transcription factor NPAS4 regulates domain-specific inhibition. Nature 503, 121–125. - PMC - PubMed
    1. Brown SA, Richards CM, Hanscom HN, Feng SL, and Winkles JA (2003). The Fn14 cytoplasmic tail binds tumour-necrosis-factor-receptor-associated factors 1, 2, 3 and 5 and mediates nuclear factor-kappaB activation. Biochem J 371, 395–403. - PMC - PubMed

Publication types