. 2018 Jul 26;174(3):521-535.e13.
doi: 10.1016/j.cell.2018.06.005. Epub 2018 Jul 19.

Reactivation of Dormant Relay Pathways in Injured Spinal Cord by KCC2 Manipulations

Affiliations

Reactivation of Dormant Relay Pathways in Injured Spinal Cord by KCC2 Manipulations

Bo Chen et al. Cell. .

Erratum in

Abstract

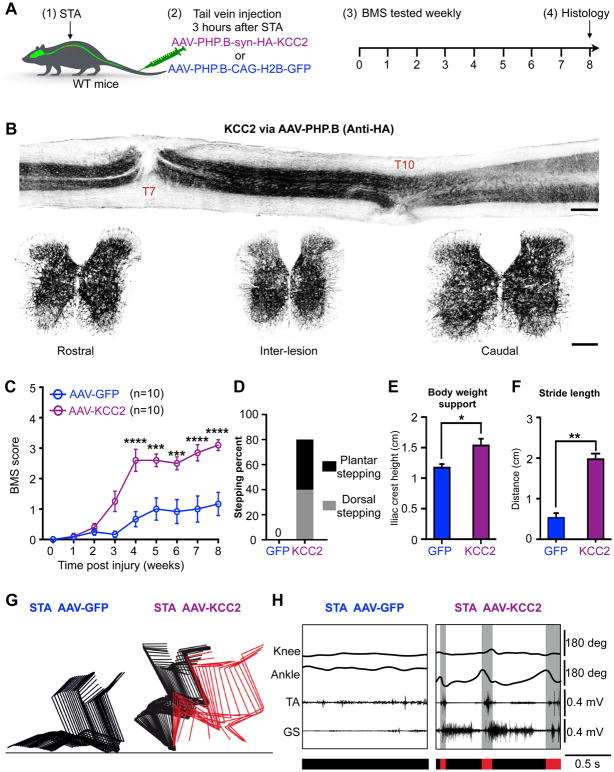
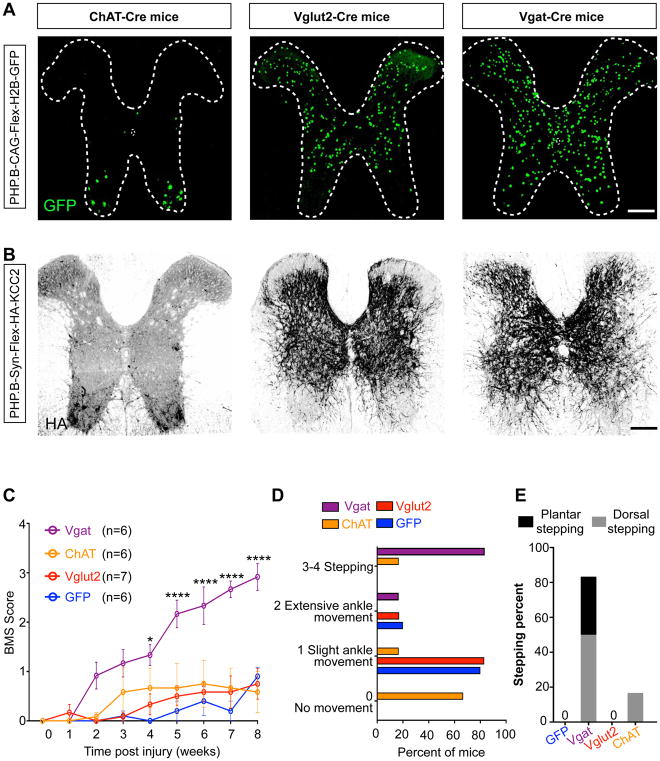
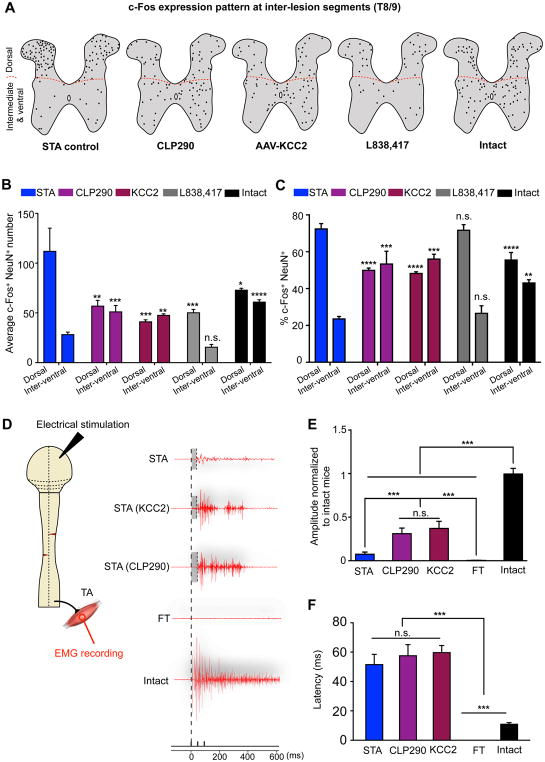
Many human spinal cord injuries are anatomically incomplete but exhibit complete paralysis. It is unknown why spared axons fail to mediate functional recovery in these cases. To investigate this, we undertook a small-molecule screen in mice with staggered bilateral hemisections in which the lumbar spinal cord is deprived of all direct brain-derived innervation, but dormant relay circuits remain. We discovered that a KCC2 agonist restored stepping ability, which could be mimicked by selective expression of KCC2, or hyperpolarizing DREADDs, in the inhibitory interneurons between and around the staggered spinal lesions. Mechanistically, these treatments transformed this injury-induced dysfunctional spinal circuit to a functional state, facilitating the relay of brain-derived commands toward the lumbar spinal cord. Thus, our results identify spinal inhibitory interneurons as a roadblock limiting the integration of descending inputs into relay circuits after injury and suggest KCC2 agonists as promising treatments for promoting functional recovery after spinal cord injury.

Keywords: KCC2; excitability; excitation/inhibition balance; inhibitory neurons; propriospinal pathways; spinal cord injury.


Conflict of interest statement

DECLARATION OF INTERESTS

The authors declare no competing interests.

Figures

Figure 1
Figure 1. Identification of CLP290 as a compound leading to functional recovery in mice with staggered lesions
(A) Schematic of staggered lateral hemisections at T7 and T10. Arrowheads indicate lesions, L = left, R = right. (B) Representative image of an anti-GFAP stained spinal cord section 10 weeks after over-stagger lesion. Dashed line indicates midline. Scale bar: 500 μm. (C) Representative image stacks of anti-5HT-stained transverse sections from T5 (rostral to lesions), T8 (between lesions), and L2 (caudal to lesions) of mice at 2 weeks after staggered lesions. Scale bar: 100 μm. (D) Experimental scheme. Each BMS test was performed 24 hr prior to daily compound treatment. (E) BMS scores in injured mice with continuous treatment of CLP290 (35mg/kg) and vehicle solution. Two-way repeated-measures ANOVA followed by post hoc Bonferroni correction. Both groups started as n = 10, and at week 9 (the termination time point) n = 8, and 10 for vehicle and CLP290 respectively. *P<0.05; ****P<0.0001. Error bars: SEM. (F) Percentage of mice that reached stepping. CLP290 versus vehicle at 9 weeks post staggered injury (n = 8 and 10 for vehicle and CLP290 group respectively). (G). Sustained behavioral improvements after CLP290 withdrawal in mice with 10-week treatment. BMS was tested on Day 1, 2, 3, 7 and 14 after compound withdrawal (n = 7). Two-way repeated-measure ANOVA followed by post hoc Bonferroni correction. **p < 0.01. Error bars: SEM. (H) Color-coded stick view decomposition of mouse right hindlimb movements during swing, stance (Intact group), dragging (Vehicle group) and stepping (CLP290 group). (I and J). Quantification of bodyweight support (I) and stride length (J) of mice at 9 weeks post staggered injury (n = 8 and 10 for vehicle and CLP290 group respectively). Student’s t-test (two-tailed, unpaired). *p < 0.05; **p < 0.01. Error bars: SEM. (K) Representative right hindlimb knee and ankle angle oscillation trace and simultaneous EMG recording from tibias anterior (TA) and gastrocnemius medialis (GS) muscle. Black bars, swing and stepping; red bars, stance and dragging. See also Figure S1, S2, S3 and Supplementary Movie.
Figure 2
Figure 2. Widespread KCC2 expression mimics the effects of CLP290 to promote functional recovery
(A) Experimental scheme. (B) Representative image stacks of longitudinal (upper) and transverse (lower) spinal cord sections, taken from the mice at 8 weeks after staggered injury, stained with anti-HA (to detect the HA-KCC2 protein). Scale bar: 500 μm (upper) and 100 μm (lower). (C) BMS performance in experimental (AAV-PHP.B-HA-KCC2) and control (AAV-PHP.B-H2B-GFP) groups. Two-way repeated-measures ANOVA followed by post hoc Bonferroni correction. *p < 0.05. (D) Percentage of mice that reached stepping at 8 weeks after injury. (E and F) Quantification of bodyweight support (E) and stride length (F) at 8 weeks (n = 10 per group). Student’s t-test (two-tailed, unpaired) was applied. *p < 0.05; **p < 0.01. Error bars: SEM. (G) Color-coded stick view decomposition of mouse right hindlimb movement during dragging (AAV-PHP.B-H2B-GFP group) and stepping (AAV-PHP.B-HA-KCC2 group). (H) Representative right hindlimb knee and ankle angle oscillation trace and simultaneous EMG recording of mice at 8 weeks after injury. Red bars, swing and stepping; black bars, stance and dragging. See also Figure S4 and Supplementary Movie.
Figure 3
Figure 3. KCC2 expression in inhibitory neurons leads to functional recovery
(A, B) Representative image stacks showing expression of GFP (A) or HA-KCC2 (B) in T8 spinal cord of indicated transgenic mice with tail-vein injection of AAV-PHP.B-CAG-Flex-H2B-GFP (A) or AAV-PHP.B-Syn-Flex-HA-KCC2 (B). Scale bar: 100 μm. (C) BMS performance in indicated groups. Two-way repeated-measure ANOVA followed by post hoc Bonferroni correction. *p < 0.05; ****p < 0.0001. Error bars: SEM. (D) Breakdown of BMS scores for indicated treatment groups at 8 weeks after injury. (E) Percentage of mice that reached plantar or dorsal stepping at 8 weeks after injury.
Figure 4
Figure 4. KCC2 acts on inhibitory neurons in the spinal cord segments between and around the lesions
(A) Experimental scheme for B–D. (B) Representative images of anti-HA-stained transverse sections of the thoracic and lumbar spinal cord at 8 weeks. Scale bar: 100 μm. (C and D) Left, BMS performance in different treatment groups in wild type mice (C), and Vgat-Cre mice (D). Right, percentage of mice that reached stepping in WT mice (C) and Vgat-Cre mice (D). ANOVA followed by post hoc Bonferroni correction. Error bars: SEM. (E) Experimental scheme for F–H. (F) Representative images of anti-HA-stained transverse sections of the thoracic and lumbar spinal cord at 8 weeks after injury. Scale bar: 100 μm. (G and H) Left, BMS performance in experimental and control groups in WT mice (G), and Vgat-Cre mice (H). Right, percentage of mice that reached stepping in WT mice (G) and Vgat-Cre mice (H). ANOVA followed by post hoc Bonferroni correction. *p < 0.05. Error bars: SEM. See also Figure S4
Figure 5
Figure 5. Altered neuronal activation patterns and relay formation facilitated by CLP290/KCC2
(A) Schematics of transverse spinal cord sections showing c-Fos expression patterns in T8/9 segments after 1 hour of continuous locomotion in intact mice and injured mice with treatment of vehicle, CLP290, AAV-PHP.B-syn-HA-KCC2 or L838,417. Each spot represents a cell positively stained with both c-Fos and NeuN. Representative raw images are shown in Figure S5A. (B) Average number of c-Fos+ neurons per section in the dorsal zone or the intermediate and ventral zones in all groups. One-way ANOVA followed by Bonferroni post hoc test (c-Fos+ NeuN+ numbers of the dorsal or intermediate/ventral zones in the Vehicle, CLP290, AAV-PHP.B-syn-HA-KCC2 or L838,417 treated groups were compared to that of the intact group, respectively). n = 3 sections per mouse, n = 3 mice per group. *p < 0.05; ***P<0.001; ****P < 0.0001; n.s. not significant. Error bars: SEM. (C) Average percentage of c-Fos+ neurons per section in Laminae 1–5 (Dorsal) or in Laminae 6–10 (Inter-ventral) in all groups One-way ANOVA followed by Bonferroni post hoc test (c-Fos+ NeuN+ percentages of the dorsal or intermediate/ventral zones in the Vehicle, CLP290, AAV-PHP.B-syn-HA-KCC2 or L838,417 treated groups were compared to that of the intact group, respectively). n = 3 sections per mouse, n = 3 mice per group, *p < 0.05; **P< 0.01; ***P<0.001; n.s. not significant. Error bars: SEM. (D) Left, schematic of cortical stimulation and TA muscle EMG experiments. Right, representative responses in the right TA muscle evoked by a train of epidural motor cortex stimulations in STA control, AAV-PHP.B-syn-HA-KCC2, CLP290 treated, full transection, and intact groups. (E) Right TA muscle EMG response amplitude from indicated groups. One-way ANOVA followed by Bonferroni post hoc test. n = 3 attempts per mouse, n = 3 mice per group, ***p < 0.001; n.s. not significant; error bars, SEM. (F) Right TA muscle EMG response latency from indicated groups. One-way ANOVA followed by Bonferroni post hoc test. n = 3 attempts per mouse, n = 3 mice per group, ***p < 0.001; n.s. not significant. Error bars: SEM. See also Figure S5
Figure 6
Figure 6. Gi-DREADD expression in inhibitory interneurons between and around the lesion mimics the effects of KCC2/CLP290
(A) Experimental scheme. (B) Representative images of transverse sections of the thoracic and lumbar spinal cord at 8 weeks post-SCI immunostained with anti-RFP to indicate hM4Di DREADD expression. Scale bar: 100 μm. (C) BMS performance over time after SCI and virus injections in Gi-DREADD and GFP groups in Vgat-Cre mice. ANOVA followed by post hoc Bonferroni correction. **p < 0.001, ****p < 0.0001, error bars, SEM. (D). Schematic of transverse spinal cord sections showing c-Fos positive neurons in T8/9 segments after 1 hour of continuous locomotion in AAV-9-Syn-Gi-DREADD treated mice (dorsal/plantar stepping) and AAV-9-Syn-GFP mice group (dragging). (E) Average numbers of c-Fos+ neurons (all laminae) per section in indicated groups. Student’s t-test (two-tailed, unpaired). n = 3 sections per mouse, n = 3 mice per group. n.s. not significant. Error bars: SEM. (F) Percentage of c-Fos+ neurons in Laminae 1–5 or Laminae 6–10 in indicated groups. Sudent’s t-test (two-tailed, unpaired). n = 9 sample slides per group, n = 3 mice per group. **P < 0.01; n.s. not significant. Error bars: SEM. See also Figure S6

Comment in

References

    1. Angeli CA, Edgerton VR, Gerasimenko YP, Harkema SJ. Altering spinal cord excitability enables voluntary movements after chronic complete paralysis in humans. Brain. 2014;137:1394–1409. - PMC - PubMed
    1. Arber S. Motor circuits in action: specification, connectivity, and function. Neuron. 2012;74:975–989. - PubMed
    1. Ballermann M, Fouad K. Spontaneous locomotor recovery in spinal cord injured rats is accompanied by anatomical plasticity of reticulospinal fibers. Eur J Neurosci. 2006;23:1988–1996. - PubMed
    1. Bareyre FM, Kerschensteiner M, Raineteau O, Mettenleiter TC, Weinmann O, Schwab ME. The injured spinal cord spontaneously forms a new intraspinal circuit in adult rats. Nat Neurosci. 2004;7:269–277. - PubMed
    1. Basso DM, Fisher LC, Anderson AJ, Jakeman LB, McTigue DM, Popovich PG. Basso Mouse Scale for locomotion detects differences in recovery after spinal cord injury in five common mouse strains. J Neurotrauma. 2006;23:635–659. - PubMed

Publication types