. 2019 Jan;69(1):376-393.
doi: 10.1002/hep.30190. Epub 2018 Dec 22.

Inhibition of Cyclin-Dependent Kinase 5: A Strategy to Improve Sorafenib Response in Hepatocellular Carcinoma Therapy

Affiliations

Inhibition of Cyclin-Dependent Kinase 5: A Strategy to Improve Sorafenib Response in Hepatocellular Carcinoma Therapy

Maximilian A Ardelt et al. Hepatology. 2019 Jan.

Abstract

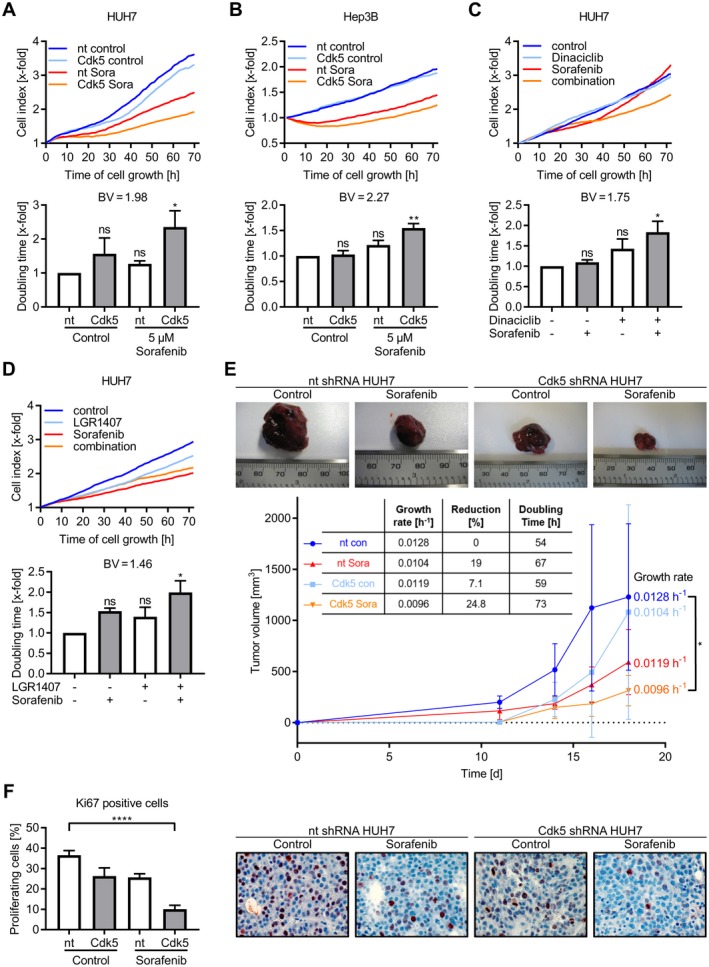
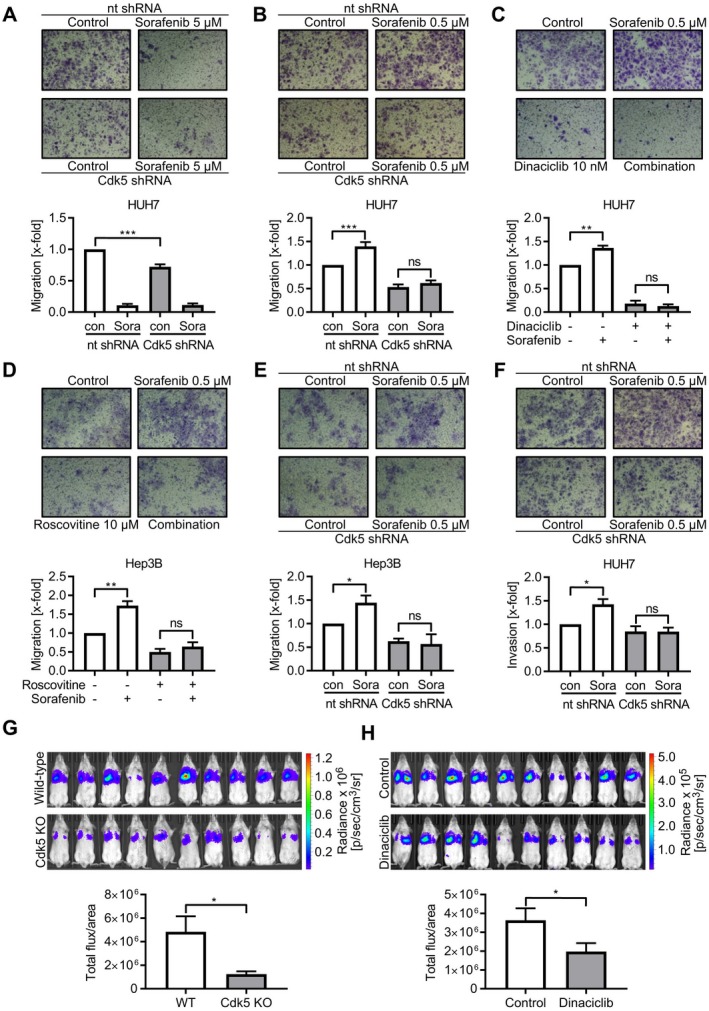
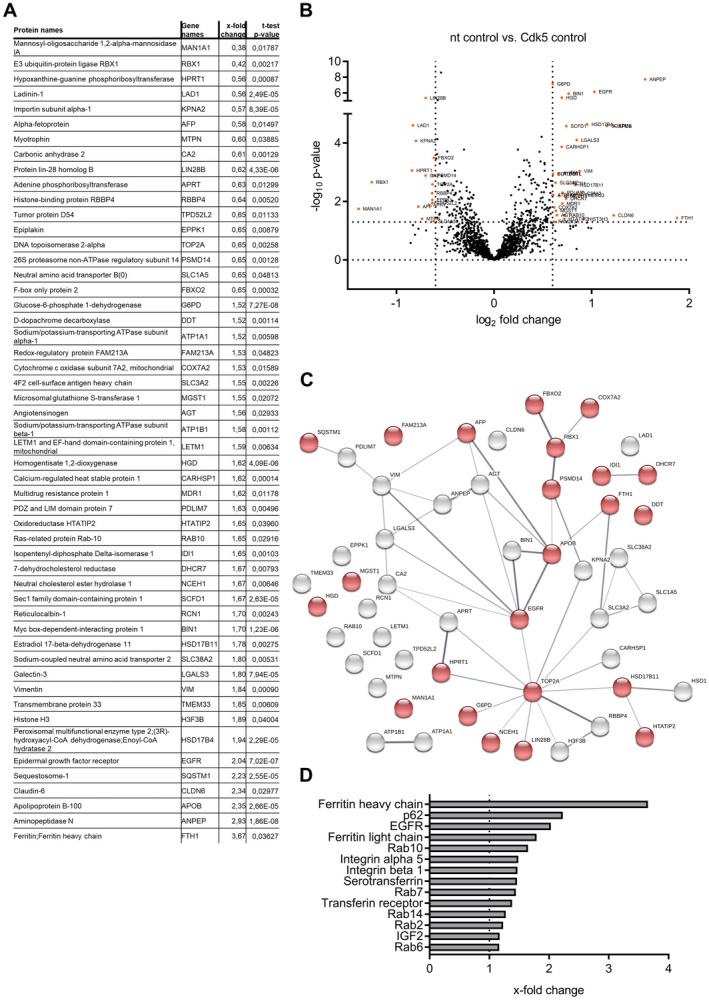
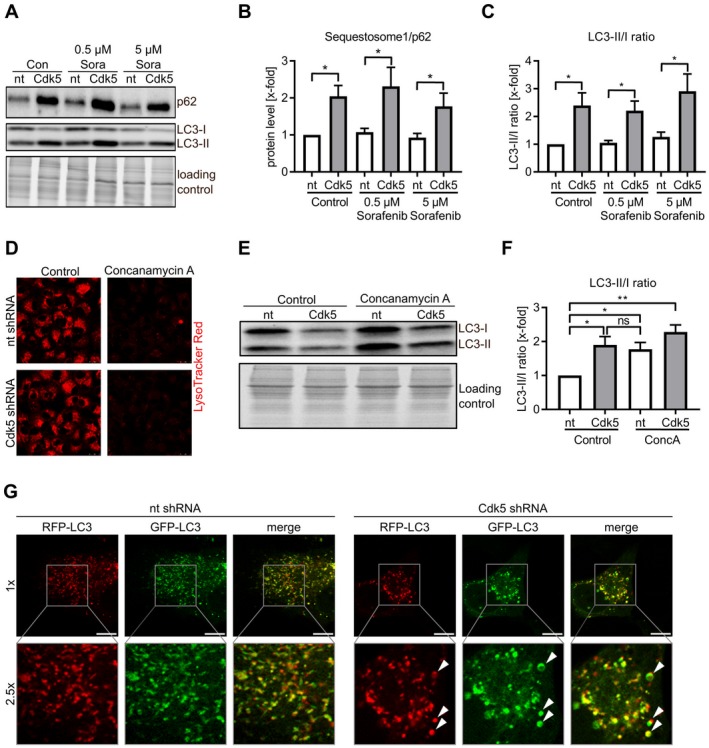
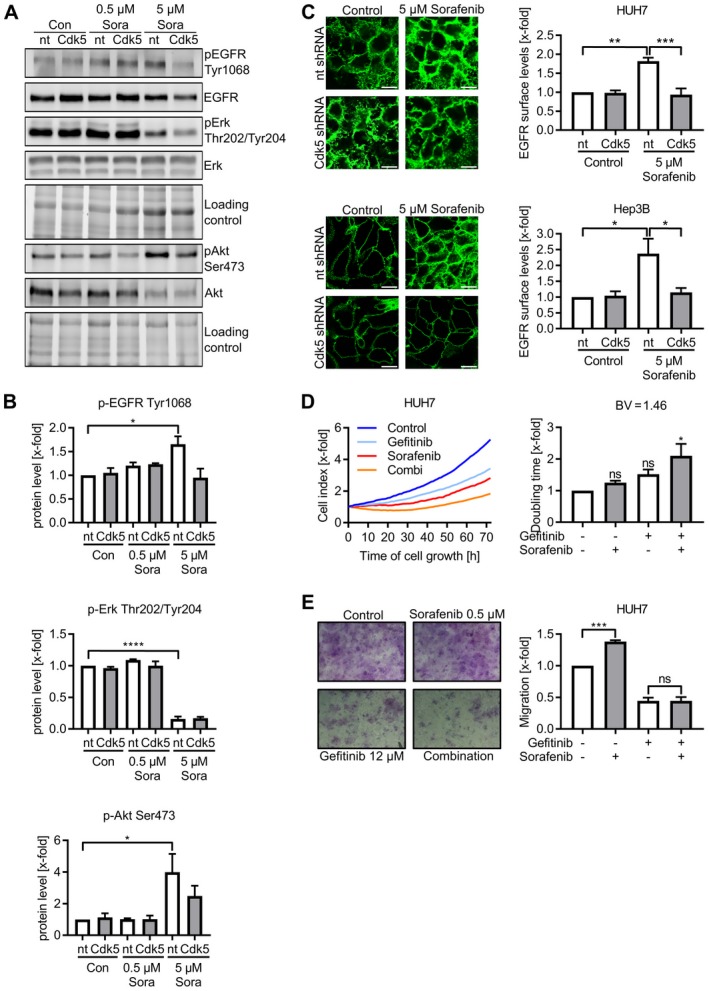
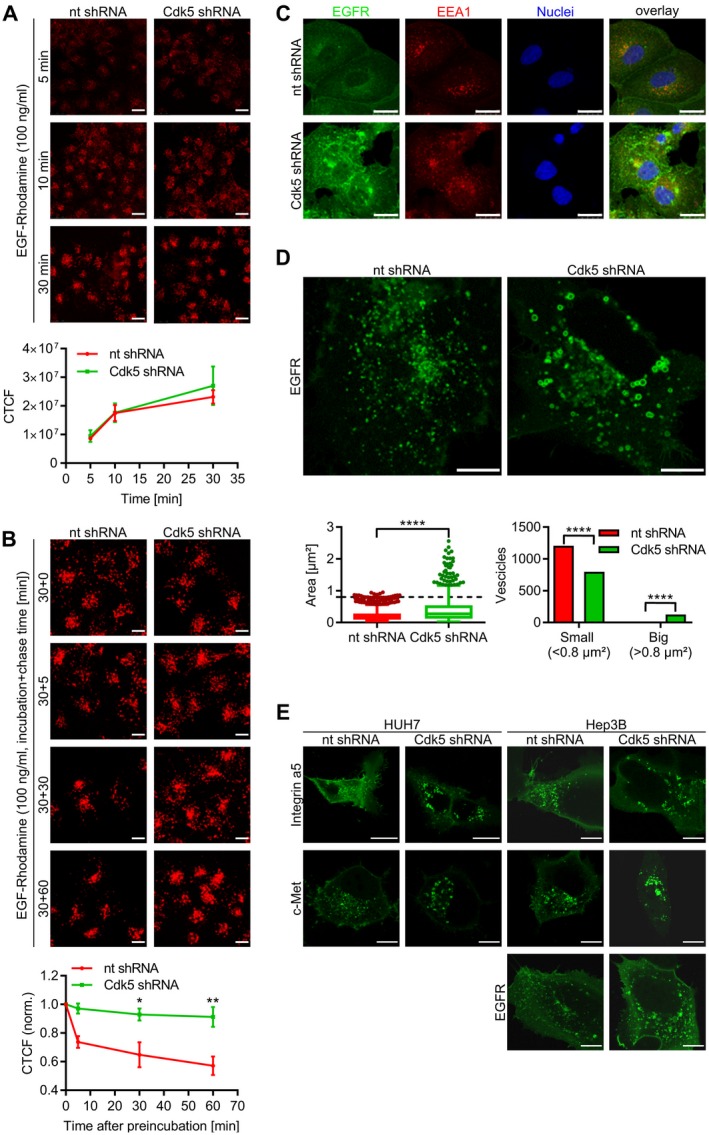
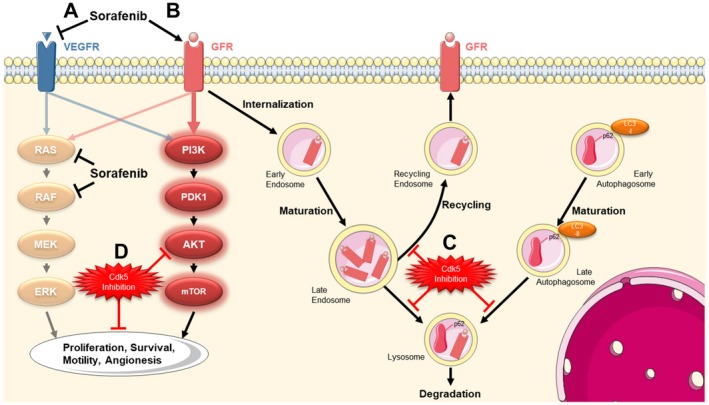
Therapeutic options for patients with advanced-stage hepatocellular carcinoma (HCC) are very limited. The only approved first-line treatment is the multi-tyrosine kinase inhibitor sorafenib, which shows low response rates and severe side effects. In particular, the compensatory activation of growth factor receptors leads to chemoresistance and limits the clinical impact of sorafenib. However, combination approaches to improve sorafenib have failed. Here we investigate the inhibition of cyclin-dependent kinase 5 (Cdk5) as a promising combination strategy to improve sorafenib response in HCC. Combination of sorafenib with Cdk5 inhibition (genetic knockdown by short hairpin RNA or CRISPR/Cas9 and pharmacologic inhibition) synergistically impaired HCC progression in vitro and in vivo by inhibiting both tumor cell proliferation and migration. Importantly, these effects were mediated by a mechanism for Cdk5: A liquid chromatography-tandem mass spectrometry-based proteomic approach revealed that Cdk5 inhibition interferes with intracellular trafficking, a process crucial for cellular homeostasis and growth factor receptor signaling. Cdk5 inhibition resulted in an accumulation of enlarged vesicles and respective cargos in the perinuclear region, considerably impairing the extent and quality of growth factor receptor signaling. Thereby, Cdk5 inhibition offers a comprehensive approach to globally disturb growth factor receptor signaling that is superior to specific inhibition of individual growth factor receptors. Conclusion: Cdk5 inhibition represents an effective approach to improve sorafenib response and to prevent sorafenib treatment escape in HCC. Notably, Cdk5 is an addressable target frequently overexpressed in HCC, and with Dinaciclib, a clinically tested Cdk5 inhibitor is readily available. Thus, our study provides evidence for clinically evaluating the combination of sorafenib and Dinaciclib to improve the therapeutic situation for patients with advanced-stage HCC.


Conflict of interest statement

Nothing to report.

Figures

Figure 1
Figure 1
Combination of Cdk5 inhibition and sorafenib impairs HCC growth in vitro and in vivo. (A) Proliferation of nt and Cdk5 shRNA HUH7 cells after treatment with sorafenib (5 µM) is shown. Corresponding doubling time is shown. One‐way analysis of variance (ANOVA), Tukey *P < 0.05, n = 3. Bliss Value = 1.98. (B) Proliferation of nt and Cdk5 shRNA Hep3B cells treated with sorafenib (5 µM) is shown. Corresponding doubling time is shown. One‐way ANOVA, Tukey **P < 0.01, n = 3. Bliss Value = 2.27. (C) Proliferation of HUH7 cells treated with sorafenib (5 µM), dinaciclib (10 nM), or a combination of both is shown. Corresponding doubling time is shown. One‐way ANOVA, Tukey *P < 0.05, n = 3. Bliss Value = 1.75. (D) Proliferation of HUH7 cells treated with sorafenib (5 µM), LGR1407 (7.5 µM), or a combination of both is shown. Corresponding doubling time is shown. One‐way ANOVA, Tukey *P < 0.05, n = 3. Bliss Value = 1.46. (A‐D) Upper panel: one representative graph (out of three independent experiments) showing cell index over time. Lower panel: Bar diagram showing the statistical analysis of cell index (upper panel) expressed as doubling time. (E) Tumors of nt and Cdk5 shRNA HUH7 cells grown in SCID mice that were treated with either sorafenib or solvent are shown (n = 6). Tumor volume over the treatment period of 18 days is shown. The table shows the statistical evaluation of growth rates that were determined from tumor volumes by applying an exponential tumor growth model, which showed a significantly reduced tumor growth rate by combining Cdk5 inhibition with sorafenib (*P < 0.05). (F) Immunostaining of respective tumors from E for Ki67 (red) and hematoxylin (nuclei, blue) is shown. The bar graph indicates proliferating cells evaluated by counting Ki67‐positive cells. One‐way ANOVA, Tukey ****P < 0.0001, n = 6.
Figure 2
Figure 2
Cdk5 inhibition prevents sorafenib‐induced HCC cell migration. (A‐E) Transwell migration of nt and Cdk5 shRNA HUH7 (A,B), wild‐type HUH7 cells (C), wild‐type Hep3B cells (D) and nt and Cdk5 shRNA Hep3B cells (E) that were pretreated with the respective compounds in the indicated concentrations is shown. (F) Invasion of nt and Cdk5 shRNA HUH7 cells that were pretreated with sorafenib is shown. (A‐F) Bar graphs indicate the number of migrated cells normalized to control. One‐way analysis of variance (ANOVA), Tukey *P < 0.05, **P < 0.01, ***P < 0.001, n = 3. (G) Noninvasive images of tumor bearing mice injected with either RIL175 wild‐type cells or RIL175 Cdk5 knockout cells are shown. The bar graph shows corresponding signal intensities. t test, *P < 0.05, n = 10. (H) Noninvasive images of tumor‐bearing mice treated with either Dinaciclib or solvent are shown. The bar graph shows corresponding signal intensities. t test, *P < 0.05, n = 10. Abbreviations: Cdk5 KO, Cdk5 knockout; WT, wild‐type.
Figure 3
Figure 3
Proteomic analysis of Cdk5 knockdown cells. (A) Table of proteins showing alterations of protein abundance (P < 0.05; log2‐fold change > 0.6) between nt and Cdk5 shRNA HUH7 cells together with their respective gene names, x‐fold changes (nt shRNA HUH7 versus Cdk5 shRNA HUH7) and P Values. (B) Volcano Plot visualizing the protein hits given in table A. (C) Protein interaction map of protein hits given in table A created with string‐db.org (protein–protein interaction enrichment P Value: 0.0016). Proteins involved in metabolic processes, autophagy, and EGFR signaling are highlighted in red (false discovery rate: 0.0125). (D) The graph shows proteins associated with or regulated by endocytosis that were modulated by Cdk5 knockdown (x‐fold change compared with nt shRNA is displayed).
Figure 4
Figure 4
Cdk5 inhibition influences autophagic flux. (A) Immunoblots from nt and Cdk5 shRNA HUH7 cells treated with sorafenib probed with antibodies for p62/Sequestosome1 and LC3 are shown. (B) Quantitative evaluation of p62/Sequestosome1 from A is shown. One‐way analysis of variance (ANOVA), Holm‐Sidak *P < 0.05, n = 3. (C) Ratio of LC3‐II to LC3‐I after quantitative evaluation from A is shown. One‐way ANOVA, Holm‐Sidak *P < 0.05, n = 3. (D) LysoTracker Red staining of nt and Cdk5 shRNA HUH7 cells after treatment with concanamycin A (1 µM) is shown. (E) Immunoblot from nt and Cdk5 shRNA HUH7 cells treated with concanamycin A (1 µM) and probed with an antibody for LC3 is shown. (F) Ratio of LC3‐II/I is shown after quantitative evaluation of immunoblots from E. One‐way ANOVA, Newman‐Keuls *P < 0.05, **P < 0.01, n = 3. (G) Single frames from live cell imaging videos of nt and Cdk5 shRNA HUH7 cells expressing eGFP‐eRFP‐LC3. Scale bar 10 µm (1×).
Figure 5
Figure 5
Cdk5 inhibition prevents compensatory activation of EGFR. (A) Immunoblots from nt and Cdk5 shRNA HUH7 cells treated with sorafenib probed with antibodies for pEGFR, EGFR, pErk, Erk, pAkt, and Akt are shown. (B) Quantitative evaluations of pEGFR, pErk and pAkt from A are shown. One‐way analysis of variance (ANOVA), Tukey *P < 0.05, ****P < 0.0001, n = 3. (C) Immunostaining for EGFR with an antibody specific to the extracellular domain in nt and Cdk5 shRNA HUH7 (upper panel) and Hep3B (lower panel) cells after sorafenib treatment is shown. Scale bar 20 µm. Relative evaluation of fluorescence intensity is shown. One‐way ANOVA, Tukey *P < 0.05, **P < 0.01, ***P < 0.001, n = 3. (D) Proliferation of HUH7 cells treated with sorafenib, gefitinib, or combination of both is shown. Corresponding doubling time is shown. One‐way ANOVA, Tukey *P < 0.05, n = 3. Left panel: One representative graph (out of three independent experiments) shows the cell index over time. Right panel: Bar diagram shows the statistical analysis of cell index expressed as doubling time. (E) Transwell migration of wild‐type HUH7 cells that were pretreated with the respective compounds in the indicated concentrations is shown. Representative pictures of migrated cells are shown together with bar diagrams showing the number of migrated cells normalized to the control. One‐way ANOVA, Tukey ***P < 0.001, n = 3. Abbreviations: pAKT, phosphorylated AKT; pEGFR, phosphorylated EGFR; pErk, phosphorylated Erk.
Figure 6
Figure 6
Cdk5 influences endosomal trafficking. (A) EGF‐uptake: Images display nt and Cdk5 shRNA HUH7 cells that were treated with EGF‐Rhodamine for various time points and analyzed by confocal microscopy. Scale bar 25 µm. Quantitative evaluation of CTCF is shown. For each condition, 30 cells were analyzed. (B) EGF‐elimination: Images show nt and Cdk5 shRNA HUH7 cells that were incubated with EGF‐Rhodamine (30 minutes) before EGF‐Rhodamine was removed and cells were chased for the given time points (0, 5, 30, and 60 minutes). Scale bar 25 µm. Quantitative evaluation of CTCF is indicated. One‐way analysis of variance, Tukey *P < 0.05, **P < 0.01, n = 3. (C) Immunostaining for EGFR (green), EEA1 (red), and Hoechst33342 (blue, nuclei) from nt and Cdk5 shRNA HUH7 cells is shown. Scale bar 25 µm. (D) Single frames from live cell imaging videos of nt and Cdk5 shRNA cells expressing eGFP‐EGFR are shown. Scale bar 10 µm. Box plot diagram and bar graph show the distribution of vesicle size comparing nt and Cdk5 shRNA. Mann‐Whitney, ****P < 0.0001, chi‐squared test, ****P < 0.0001. (E) Single frames from live cell imaging videos of nt and Cdk5 shRNA HUH7 and Hep3B cells expressing either eGFP‐Integrin‐α5, eGFP‐cMet, or eGFP‐EGFR are shown. Scale bar 25 µm (HUH7: integrin α5), 10 µm (HUH7: c‐Met, EGFR; Hep3B: integrin α5, EGFR, c‐Met). Abbreviation: CTCF, corrected total cell fluorescence.
Figure 7
Figure 7
Summary. (A) The treatment of HCC cells with sorafenib causes an inhibition of VEGFR and its downstream targets RAS and RAF. (B) In turn, this leads to the compensatory activation of growth factor receptor signaling, which allows tumor cells to maintain proliferation and migration, mediated via the PI3K/AKT pathway. After activation, growth factor receptors have to be trafficked via the endosomal system and are either degraded via lysosomes or recycled via endosomes. (C) We uncovered that Cdk5 inhibition interferes with intracellular trafficking leading to an increase in vesicle size and an accumulation of respective cargos. (D) Thereby an inhibition of Cdk5 prevents the sorafenib‐induced compensatory activation of growth factor receptors and respective downstream targets and enhances the antitumor effects of sorafenib.

References

    1. Jemal A, Bray F, Center MM, Ferlay J, Ward E, Forman D. Global cancer statistics. CA Cancer J Clin 2011;61:69‐90. - PubMed
    1. Bruix J, Gores GJ, Mazzaferro V. Hepatocellular carcinoma: clinical frontiers and perspectives. Gut 2014;63:844‐855. - PMC - PubMed
    1. Forner A, Gilabert M, Bruix J, Raoul JL. Treatment of intermediate‐stage hepatocellular carcinoma. Nat Rev Clin Oncol 2014;11:525‐535. - PubMed
    1. Llovet JM, Ricci S, Mazzaferro V, Hilgard P, Gane E, Blanc JF, et al. Sorafenib in advanced hepatocellular carcinoma. N Engl J Med 2008;359:378‐390. - PubMed
    1. Nishida N, Kitano M, Sakurai T, Kudo M. Molecular mechanism and prediction of sorafenib chemoresistance in human hepatocellular carcinoma. Dig Dis 2015;33:771‐779. - PubMed

Publication types