. 2018 Sep 17;63(18):185019.
doi: 10.1088/1361-6560/aad513.

A full-scale clinical prototype for proton range verification using prompt gamma-ray spectroscopy

Affiliations

A full-scale clinical prototype for proton range verification using prompt gamma-ray spectroscopy

Fernando Hueso-González et al. Phys Med Biol. .

Abstract

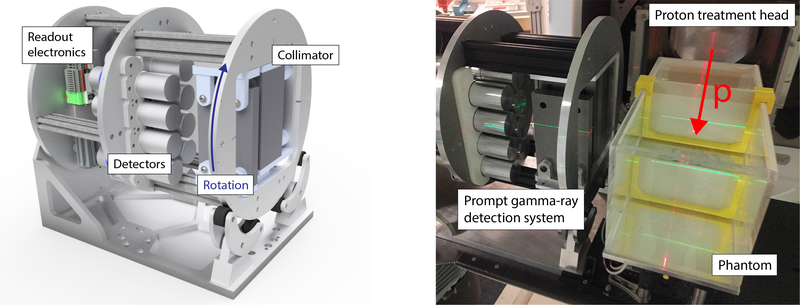
We present a full-scale clinical prototype system for in vivo range verification of proton pencil-beams using the prompt gamma-ray spectroscopy method. The detection system consists of eight LaBr3 scintillators and a tungsten collimator, mounted on a rotating frame. Custom electronics and calibration algorithms have been developed for the measurement of energy- and time-resolved gamma-ray spectra during proton irradiation at a clinical dose rate. Using experimentally determined nuclear reaction cross sections and a GPU-accelerated Monte Carlo simulation, a detailed model of the expected gamma-ray emissions is created for each individual pencil-beam. The absolute range of the proton pencil-beams is determined by minimizing the discrepancy between the measurement and this model, leaving the absolute range of the beam and the elemental concentrations of the irradiated matter as free parameters. The system was characterized in a clinical-like situation by irradiating different phantoms with a scanning pencil-beam. A dose of 0.9 Gy was delivered to a [Formula: see text] cm3 target with a beam current of 2 nA incident on the phantom. Different range shifters and materials were used to test the robustness of the verification method and to calculate the accuracy of the detected range. The absolute proton range was determined for each spot of the distal energy layer with a mean statistical precision of 1.1 mm at a 95% confidence level and a mean systematic deviation of 0.5 mm, when aggregating pencil-beam spots within a cylindrical region of 10 mm radius and 10 mm depth. Small range errors that we introduced were successfully detected and even large differences in the elemental composition do not affect the range verification accuracy. These results show that our system is suitable for range verification during patient treatments in our upcoming clinical study.


Figures

Figure 1:
Figure 1:
Left: 3D model of the clinical prototype system, which can rotate around its axis according to the beam incidence angle. The tungsten collimator is visible on the front plane, the eight scintillation detectors in the middle and the readout electronics on the back plate. Right: photo of the system in the gantry treatment room. The red arrow shows the proton beam incidence direction.
Figure 2:
Figure 2:
Simplified workflow chart visualizing the prompt gamma-ray detection model generation based on the CT scan of the patient, the treatment plan, the detector geometry, the tabulated nuclear cross sections and the XCOM database. GPU and TOPAS Monte Carlo simulations, as well as analytical ray tracing are performed. The mathematical symbols are described in table 2.
Figure 3:
Figure 3:
Sketch of the detector FOV from the perspective of the beam (a) and of an observer behind the detector (b). The collimator slabs (gray), the eight detectors (green) are overlaid. A patient or phantom (blue) is shown as an example, which could be located anywhere within the FOV. The x axis is parallel to the beam axis (red), the y axis is parallel to the slit, and the z axis completes the right-handed triad, pointing towards the detectors. The x axis origin is on the center of the standalone collimator slab at a distance |x0| from the upstream edge of the phantom or patient, whereas the y axis is centered on the proximal collimator block. The z axis origin is at 160 mm normal to the front plane (orange line) of the collimator and at a lateral distance |ziso| of the central beam axis. The FOV covers a region of 120×320×320mm3.
Figure 4:
Figure 4:
Schematic of the experimental setups to assess the range verification performance (top view, dimensions are in mm). Protons (red arrow) irradiate the water phantom (blue: water, light gray: walls), where x0 = −174mm and ziso = −40 mm. The FOV coordinate system is defined in figure 3. The black dash-dotted lines intersect at isocenter. The dashed red rectangle is the target volume (5.3×10×10 cm3). The prompt gamma-rays are collimated (gray) and measured with scintillation detectors (green). (a) Reference case in water with no range error. (b) Solid water block (brown) cover half of the field. (c) 2.2 mm or a 5.2 mm water equivalent range shifter (brown) covering half of the field. (d) 5 mm thick slab (orange) of inner or SB3 cortical bone is inserted in the middle of the field.
Figure 5:
Figure 5:
Visualization of the planning images and pencil-beam positions in the treatment plan, superimposed with the modeled 6.1 MeV prompt gamma-ray emission density Nγc=8,s=101,v,l=6,t=0/(1×2×2mm3) for the central spot of the distal layer, see equation (4). Relative to the field of view (figure 3), the top view is at slice y = 0 mm, the beam perspective is at slice x = 31 mm, and the detector perspective is at slice z = −40 mm (white cross-hair lines). The phantom setup corresponds to figure 4a, placed at x0 = −174mm and ziso = −40 mm. The pencil-beam spot scanning pattern is overlaid in the beam’s eye view, as red spots. The green cylinder (circle or rectangle in the projections) indicates a 10 mm merging radius and a 10 mm depth, enclosing spots from the two distal energy layers, as explained in sections §2.10 and 3.8. The dashed blue rectangles represent the target region of the treatment plan. The red lines mark the nominal ranges R80 of the pencil-beam energy layers (table 4).
Figure 6:
Figure 6:
From left to right: measured 2D spectrum of the energy deposit over trigger time with respect to the cyclotron radiofrequency; the neutron- and proton-continuum background estimated by our algorithm; resolved neutron-induced and proton-induced lines. This measurement was performed during the irradiation of a water phantom with 2 nA beam current. These spectra were measured by detector row r = 1 during the cross section optimization experiment (section §3.9), where a high dose was delivered. Piled-up or coincident events have been excluded.
Figure 7:
Figure 7:
Range verification of the distal layer of a proton pencil-beam field delivering 0.9 Gy to a 5.3×10×10cm3 region. The Y and Z axis correspond to the y and zziso axes of figure 3. The proton range error εs with respect to the model prediction is depicted. Shown are the experiments without range shifter (a), with a solid water insert on the left half of the field (b), with a 2.2 mm (c) and 5.2 mm (d) range shifter on the left half of the field, and with the inner (e) and SB3 cortical (f) bone inserts. Each spot contains information from a cylindrical merging region of 10 mm depth and 10 mm radius (figure 5). The histograms show the range errors with a bin width of 0.4 mm, in which a dashed black vertical line marks the theoretically introduced range shift. Where relevant, the histograms are shown separately for the left (Z < −20 mm) and right (Z > 20 mm) parts of the field.
Figure 8:
Figure 8:
Elemental composition determination for the same pencil-beam field as in figure 7. The oxygen and carbon concentrations by mass ρst are shown in the left and right columns. The reference case (a) is compared with the solid water insert in the left half of the field (b). Each spot contains information from a cylindrical merging region of 10 mm depth and 10 mm radius.
Figure 9:
Figure 9:
Planning images superimposed with the reconstructed proton dose based on the measurements of figure 7. The pencil-beams are simulated with the GPU based on the measured proton range. Axes are in mm and correspond to the FOV definition (figure 3). The red dashed rectangle shows the target region of 5.3 cm × 10 cm covered uniformly with 0.9 Gy. The image corresponds to slice y = 0 mm. Isodose lines at 95%, 80%, 60%, 40% and 20% levels of the target dose are shown.
Figure 10:
Figure 10:
Illustration of the gantry, proton treatment head, patient, top x-ray flat panel and our prototype range verification system. The detector frame can rotate according to the gantry angle, and is mounted on a positioning robot, consisting of six actuators. The robot stands on a platform on wheels that is moved into the treatment room.

References

    1. Albertini F, Hug EB, and Lomax AJ. Is it necessary to plan with safety margins for actively scanned proton therapy? Phys. Med. Biol 5614 (2011), p. 4399 URL: 10.1088/0031-9155/56/14/011. - DOI - PubMed
    1. Aldawood S et al. Development of a Compton camera for prompt-gamma medical imaging. Radiat. Phys. Chem 140Suppl C (2017), pp. 190–197. URL: 10.1016/j.radphyschem.2017.01.024. - DOI
    1. Allison J et al. Recent developments in Geant4. Nucl. Instrum. Methods Phys. Res., Sect A 835 (2016), pp. 186–225. URL: 10.1016/j.nima.2016.06.125. - DOI
    1. Amanatides J and Woo A. A fast voxel traversal algorithm for ray tracing. In: Eurographics. Vol. 87 3 1987, pp. 3–10. URL: https://diglib.eg.org/handle/10.2312/egtp19871000?show=full. - DOI
    1. Andreo P. On the clinical spatial resolution achievable with protons and heavier charged particle radiotherapy beams. Phys. Med. Biol 54.11 (2009), N205 URL: 10.1088/0031-9155/54/11/N01. - DOI - PubMed

Publication types

LinkOut - more resources