A Supernova at 50 pc: Effects on the Earth's Atmosphere and Biota
- PMID: 30034016
- PMCID: PMC6052450
- DOI: 10.3847/1538-4357/aa6c57
A Supernova at 50 pc: Effects on the Earth's Atmosphere and Biota
Abstract
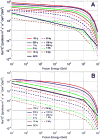
Recent 60Fe results have suggested that the estimated distances of supernovae in the last few million years should be reduced from ∼100 to ∼50 pc. Two events or series of events are suggested, one about 2.7 million years to 1.7 million years ago, and another about 6.5-8.7 million years ago. We ask what effects such supernovae are expected to have on the terrestrial atmosphere and biota. Assuming that the Local Bubble was formed before the event being considered, and that the supernova and the Earth were both inside a weak, disordered magnetic field at that time, TeV-PeV cosmic rays (CRs) at Earth will increase by a factor of a few hundred. Tropospheric ionization will increase proportionately, and the overall muon radiation load on terrestrial organisms will increase by a factor of ∼150. All return to pre-burst levels within 10 kyr. In the case of an ordered magnetic field, effects depend strongly on the field orientation. The upper bound in this case is with a largely coherent field aligned along the line of sight to the supernova, in which case, TeV-PeV CR flux increases are ∼104; in the case of a transverse field they are below current levels. We suggest a substantial increase in the extended effects of supernovae on Earth and in the "lethal distance" estimate; though more work is needed. This paper is an explicit follow-up to Thomas et al. We also provide more detail on the computational procedures used in both works.
Keywords: astrobiology; cosmic rays; stars: supernovae: general.
Figures


References
-
- Aguilar M, Ali Cavasonza L, Ambrosi G, et al. PhRvL. 2016;117:231102. - PubMed
-
- Alberts WG, Bartlett DT, Chartier JL, et al. J Int Committee Radiat Units. 2001;1:17.
-
- Atri D, Melott AL. RaPC. 2011;81:701.
-
- Atri D, Melott AL, Thomas BC. JCAP. 2010;2010:008.
Grants and funding
LinkOut - more resources
Full Text Sources
Other Literature Sources
