

doi: 10.1007/s11214-017-0415-z.
Epub 2017 Oct 2.
SAMI3 ICON: MODEL OF THE IONOSPHERE/PLASMASPHERE SYSTEM
Affiliations
- PMID: 30034036
- PMCID: PMC6052452
- DOI: 10.1007/s11214-017-0415-z
Item in Clipboard
SAMI3 ICON: MODEL OF THE IONOSPHERE/PLASMASPHERE SYSTEM
Space Sci Rev.
2017 Oct.
Abstract
The NRL ionosphere/plasmasphere model SAMI3 has been modified to support the NASA ICON mission. Specifically, SAMI3 ICON has been modified to import the thermospheric composition, temperature, and winds from TIEGCM-ICON and the high-latitude potential from AMIE data. The codes will be run on a daily basis during the ICON mission to provide ionosphere and thermosphere properties to the science community. SAMI3 ICON will provide ionospheric and plasmaspheric parameters such as the electron and ion densities, temperatures, and velocities, as well as the total electron content (TEC), peak ionospheric electron density (NmF2) and height of the F layer at NmF2 (hmF2).
Figures

The solar wind magnetic field Bz and Dst as a function of time (UT) for May 7–9, 2005 (days 127,128,129)

Global plot of log10(TECU) for May 7, 2005 (day 127) at 18:00 UT: GPS data (top) and SAMI3 ICON results (bottom). The potential contours are in the range −95 kV to 49 kV.

Global plot of log10(TECU) for May 8, 2005 (day 128) at 06:00 UT: GPS data (top) and SAMI3 ICON results (bottom). The potential contours are in the range −75 kV to 68 kV.

Global plot of log10(TECU) for May 8, 2005 (day 128) at 18:00 UT: GPS data (top) and SAMI3 ICON results (bottom). The potential contours are in the range −75 kV to 68 kV.

Global plot of log10(TECU) for May 9, 2005 (day 129) at 06:00 UT: GPS data (top) and SAMI3 ICON results (bottom). The potential contours are in the range −59 kV to 32 kV.
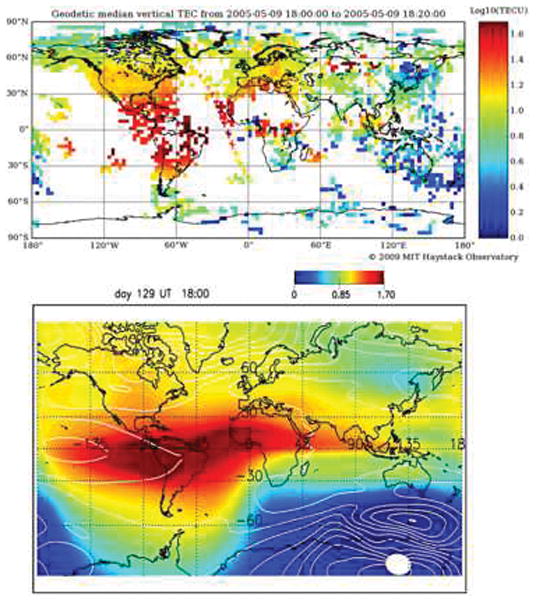
Global plot of log10(TECU) for May 9, 2005 (day 129) at 18:00 UT: GPS data (top) and SAMI3 ICON results (bottom). The potential contours are in the range −59 kV to 32 kV.
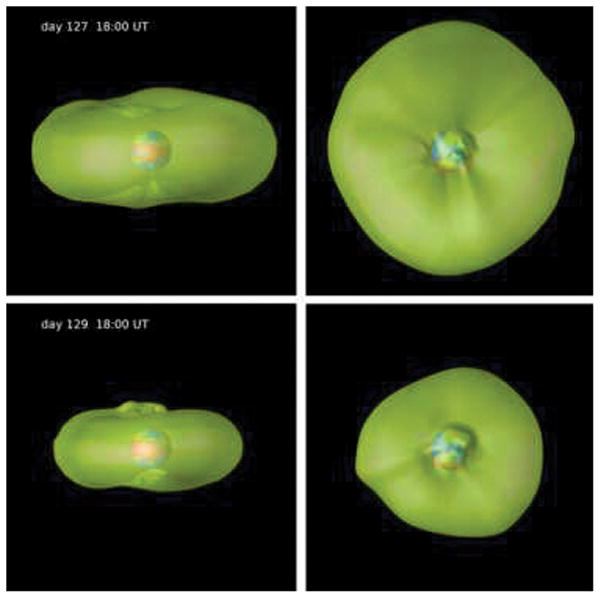
Isocontours of the electron density in the plasmasphere at times 18:00 UT (day 127) and 18:00 UT (day 129). The green contour is at ne = 102 cm−3 and the orange contour is at ne = 106 cm−3. In the left panels the view is from the sun, while in the right panels the sun is at the bottom.
References
-
- Qian L, Burns AG, Emery BA, Foster B, Lu G, Maute A, Richmond AD, Roble RG, Solomon SC, Wang W. The NCAR TIEGCM. In: Huba J, Schunk R, Khazanov G, editors. Modeling the Ionosphere-Thermosphere System. ch7. John Wiley & Sons, Ltd; Chichester, UK: 2014. - DOI
-
- Richmond AD, Maute A. Ionospheric Electrodynamics Modeling. In: Huba J, Schunk R, Khazanov G, editors. Modeling the Ionosphere-Thermosphere System. ch6. John Wiley & Sons, Ltd; Chichester, UK: 2014. - DOI
-
- Richmond AD, Ridley EC, Roble RG. A thermosphere/ionosphere general circulation model with coupled electrodynamics. Geophys Res Lett. 1992;19:601.
-
- Crowley G, Hackert CL. Quantification of high latitude electric field variability. Geophys Res Lett. 2001;28:2783.
-
- Huba JD, Joyce G, Fedder JA. Sami2 is Another Model of the Ionosphere (SAMI2): A new low-latitude ionosphere model. J Geophys Res. 2000;105:23,035.
Grants and funding
LinkOut - more resources
Full Text Sources
Other Literature Sources