. 2018 May 17;9(7):768-772.
doi: 10.1021/acsmedchemlett.8b00091. eCollection 2018 Jul 12.

Using Tumor Explants for Imaging Mass Spectrometry Visualization of Unlabeled Peptides and Small Molecules

Affiliations

Using Tumor Explants for Imaging Mass Spectrometry Visualization of Unlabeled Peptides and Small Molecules

Brian P David et al. ACS Med Chem Lett. .

Abstract

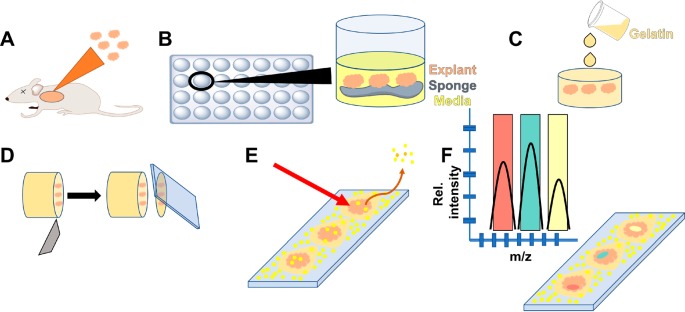
Matrix assisted laser desorption ionization time-of-flight (MALDI-TOF) imaging mass spectrometry has emerged as a powerful, label-free technique to visualize penetration of small molecules in vivo and in vitro, including in 3D cell culture spheroids; however, some spheroids do not grow sufficiently large to provide enough area for imaging mass spectrometry. Here, we describe an ex vivo method for visualizing unlabeled peptides and small molecules in tumor explants, which can be divided into pieces of desired size, thus circumventing the size limitations of many spheroids. As proof-of-concept, a small molecule drug (4-hydroxytamoxifen), as well as a peptide drug (cyclosporin A) and peptide chemical probe, can be visualized after in vitro incubation with tumor explants so that this technique may provide a solution to robing cell penetration by unlabeled peptides.


Conflict of interest statement

The authors declare no competing financial interest.

Figures

Figure 1
Figure 1
Workflow of explant-based imaging mass spectrometry. (A) Xenograft tumors are harvested from mammary glands of mice. (B) Tumors are trimmed, divided into explants of desired size, and treated. (C) Treated explants are embedded into gelatin. (D) Embedded explants are cryosectioned into 6–12 μm thick sections and thaw-mounted onto indium tin oxide slides. (E) MALDI matrix is applied, and the slide is inserted into the MALDI-TOF mass spectrometer, in which the laser is guided to hit a region of interest in the sample. (F) Once data are generated, peaks of interest can be extracted and viewed in the sample to generate an image.
Figure 2
Figure 2
(A) Structure of macrocyclic peptide drug, cyclosporin A. (B) MALDI-TOF imaging mass spectrometry color image of CspA (m/z 1224.7 ± 0.2 Da and subsequent isotopic peaks [M + Na]+, data were normalized between 2–28% to reflect 0–100% intensity scale) mass peaks detected in explant compared to explant treated with DMSO (scale bar = 1 mm). (C) Box-and-whiskers plot of m/z signal 1224.8 in CspA-treated explant and DMSO-treated explant. (D) Structure of α-helical peptide, SRC2-SP4. (E) MALDI imaging mass spectrometry color image of SRC2-SP4 (m/z 1424.9 ± 0.2 Da and subsequent isotopic peaks [M + H]+, data were normalized between 10–60% to reflect 0–100% intensity scale) mass peaks detected in explant compared to explant treated with DMSO (scale bar = 1 mm). (F) Box-and-whiskers plots of m/z signal 1424.8 in SRC2-SP4-treated explant and DMSO-treated explant. ****p < 0.0001; **p < 0.01.
Figure 3
Figure 3
(A) Structure of the selective estrogen receptor modulator 4-OHT. (B) MALDI-TOF image showing the extracted mass signal of 4-OHT (388 m/z ± 0.2 Da and subsequent isotopic peaks, [M + H]+, data were normalized between 2–28% to reflect 0–100% intensity scale) from a MALDI-TOF (scale bar = 1 mm). (C) High-resolution images acquired on MALDI-FT-ICR of samples treated for 24 h with 1 μM 4-OHT (scale bar = 1 mm). When resolved, a difference can be seen from the extracted, localized mass of 388.039 m/z (±0.005 Da) (top) and the extracted, localized mass of 388.2285 m/z (±0.005 Da) (bottom), the latter of which corresponds to the exact mass of 4-OHT (m/z = 388.2277). (D) Statistical analysis of m/z signal of 388.2285 in 4-OHT treated explant and DMSO treated explant. ****p < 0.0001.

References

    1. Vorm O; Roepstorff P.; Mann M. Imrpoved Resolution and Very High Sensitivity in MALDI TOF of Matrix Surfaces Made by Fast Evaporation. Anal. Chem. 1994, 66 (19), 3281–3287. 10.1021/ac00091a044. - DOI
    1. Cole L. M.; Clench M. R. Mass spectrometry imaging for the proteomic study of clinical tissue. Proteomics: Clin. Appl. 2015, 9 (3–4), 335–41. 10.1002/prca.201400103. - DOI - PubMed
    1. Caprioli R. M.; Farmer T. B.; Gile J. Molecular imaging of biological samples: localization of peptides and proteins using MALDI-TOF MS. Anal. Chem. 1997, 69 (23), 4751–60. 10.1021/ac970888i. - DOI - PubMed
    1. Ahlf Wheatcraft D. R.; Liu X.; Hummon A. B. Sample preparation strategies for mass spectrometry imaging of 3D cell culture models. J. Visualized Exp. 2014, (94), e52313.10.3791/52313. - DOI - PMC - PubMed
    1. Liu X.; Hummon A. B. Mass spectrometry imaging of therapeutics from animal models to three-dimensional cell cultures. Anal. Chem. 2015, 87 (19), 9508–19. 10.1021/acs.analchem.5b00419. - DOI - PMC - PubMed