. 2016 Sep 1;7(9):5786-5797.
doi: 10.1039/c6sc01567k. Epub 2016 Jun 8.

Metallacarboranes as tunable redox potential electrochemical indicators for screening of gene mutation

Affiliations

Metallacarboranes as tunable redox potential electrochemical indicators for screening of gene mutation

Tania García-Mendiola et al. Chem Sci. .

Abstract

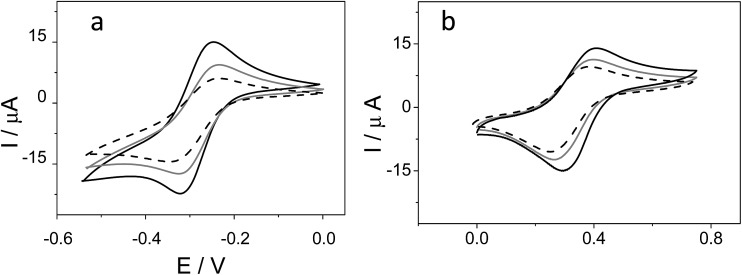
The substitution of hydrogen with chlorine in the metallacarborane [3,3-Fe(1,2-closo-C2B9H11)2]- cluster modulates the formal potential of the Fe3+/Fe2+ redox couple, shifting it to a more positive value. Hence, very similar redox probes with a wide range of formal potentials, ranging from negative to positive values, are available. Thus, we have achieved the synthesis and studied the electrochemical behaviour of the sodium salt of [3,3-Fe(8,9,12-Cl3-1,2-closo-C2B9H8)2]- in aqueous media. This strategy allows tuning of the redox potential of the [3,3-Fe(1,2-closo-C2B9H11)2]- framework with a minor change in its shape and dimensions. We also describe the interaction of the prepared [3,3-Fe(8,9,12-Cl3-1,2-closo-C2B9H8)2]- and the pristine [3,3-Fe(1,2-closo-C2B9H11)2]- with DNA. These studies have been carried out not only with DNA in solution but also with DNA immobilized on screen-printed gold electrodes. The results obtained point to a strong interaction between the metallacarboranes and DNA, to a different extent with single stranded DNA (ssDNA) compared to double stranded DNA (dsDNA). This property makes them selective and wide-ranging potential electrochemical indicators of hybridization. The suitability of these new redox indicators for selective DNA biosensor development has been probed by the direct detection of two different mutations associated with cystic fibrosis in PCR amplicons extracted from blood cells.


Figures

Fig. 1
Fig. 1. Chemical structures of the anionic metallacarboranes [3,3′-Fe(1,2-closo-C2B9H11)2] (a) and [3,3′-Fe(8,9,12-Cl3-1,2-closo-C2B9H8)2] (b) with their cluster vertex numbering; neutral ferrocene (c).
Fig. 2
Fig. 2. (a) Cyclic voltammograms of 1.0 mM Na[FESANE] in 0.1 M PB pH 7.0 solution at a bare AuSPE (black curve), a calf thymus double stranded DNA AuSPE (CT-dsDNA/AuSPE; grey curve) and a calf thymus single stranded DNA AuSPE (CT-ssDNA/AuSPE; dashed curve). (b) The same experiments for Na[Cl6-FESANE].
Fig. 3
Fig. 3. (a) Melting curves of CT-dsDNA (80 μM) in the absence (black curve) and in the presence of 8 μM Na[FESANE] (grey curve) and Na[Cl6-FESANE] (dashed curve). (b) Circular dichroism spectra of CT-dsDNA (80 μM) in the absence (black curve) and in the presence of 8 μM Na[FESANE] (grey curve) and Na[Cl6-FESANE] (dashed curve).
Fig. 4
Fig. 4. Absorption spectra of 1.0 mM (a) Na[FESANE] and (b) Na[Cl6-FESANE] in 0.1 M PB pH 7.0 solution in the absence (grey curve) and in the presence of increasing amounts of CT-dsDNA (from 0 to 200 μM). Inset: absorbance vs. [DNA]/Na[FESANE] and absorbance vs. [DNA]/Na[Cl6-FESANE] plots.
Fig. 5
Fig. 5. Differential pulse voltammograms of 1.0 mM of Na[FESANE] (a) and Na[Cl6-FESANE] (b) in the absence and in the presence of increasing amounts of CT-dsDNA (from 0 to 500 μM). Inset: Ipvs. [DNA]/Na[FESANE] and Ipvs. [DNA]/Na[Cl6-FESANE] plots.
Scheme 1
Scheme 1. Square scheme of the general process.
Scheme 2
Scheme 2. Scheme of the biosensor development.
Fig. 6
Fig. 6. Differential pulse voltammograms of 1.0 mM Na[FESANE] (a) and Na[Cl6-FESANE] (b) accumulated on a SH-HP1/AuSPE before (black curve) and after hybridization with a complementary HP2C (dashed curve), non complementary HP2NC (grey curve) and Single Nucleotide Polymorphism (SNP) sequence HP2SNP (dotted curve). Inset: peak current and error bar diagrams of the biosensor response (N = 5, RSD less than 5% for all measurements).
Fig. 7
Fig. 7. Peak current bar diagrams of the biosensor response before and after hybridization with a solution containing: the control sequence (WT) and mutated sequences, SNPG542X and MUTF508del, using [FESANE] (a, b) or [Cl6-FESANE] (c, d) as the redox indicator.

References

    1. Palaska P., Aritzoglou E., Girousi S. Talanta. 2007;72:1119–1206. - PubMed
    1. Erdem A. Talanta. 2007;74:318–325. - PubMed
    1. Wang J. Trends Anal. Chem. 2002;21:226–232.
    1. Shabani A., Mak A. W. H., Gerges I., Cuccia L. A., Lawrence M. F. Talanta. 2006;70:615–623. - PubMed
    1. Lin X. H., Wu P., Chen W., Zhang Y. F., Xia X. H. Talanta. 2007;72:468–471. - PubMed