. 2016 Sep 1;7(9):5900-5907.
doi: 10.1039/c6sc01147k. Epub 2016 May 19.

β-Glutamine-mediated self-association of transmembrane β-peptides within lipid bilayers

Affiliations

β-Glutamine-mediated self-association of transmembrane β-peptides within lipid bilayers

U Rost et al. Chem Sci. .

Abstract

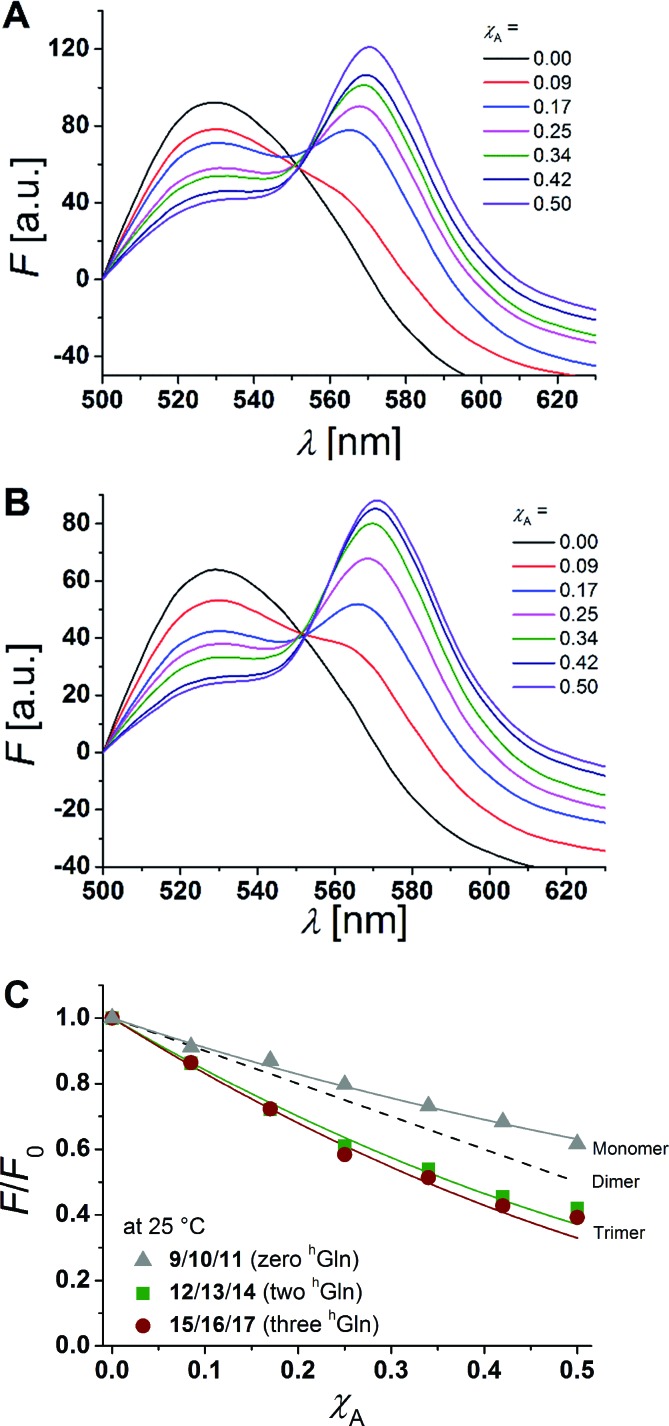
Transmembrane β-peptide helices and their association in lipid membranes are still widely unexplored. We designed and synthesized transmembrane β-peptides harboring different numbers of d-β3-glutamine residues (hGln) by solid phase peptide synthesis. By means of circular dichroism spectroscopic measurements, the secondary structure of the β-peptides reconstituted into unilamellar vesicles was determined to be similar to a right-handed 314-helix. Fluorescence spectroscopy using d-β3-tryptophan residues strongly suggested a transmembrane orientation. Two or three hGln served as recognition units between the helices to allow helix-helix assembly driven by hydrogen bond formation. The association state of the transmembrane β-peptides as a function of the number of hGln residues was investigated by fluorescence resonance energy transfer (FRET). Therefore, two fluorescence probes (NBD, TAMRA) were covalently attached to the side chains of the transmembrane β-peptide helices. The results clearly demonstrate that only β-peptides with hGln as recognition units assemble into oligomers, presumably trimers. Temperature dependent FRET experiments further show that the strength of the helix-helix association is a function of the number of hGln residues in the helix.


Figures

Fig. 1
Fig. 1. Schematic illustration of hydrogen bond formation of d3-glutamine residues.
Fig. 2
Fig. 2. Basic structure of the designed β-peptides (H-hLys2-hTrp2-hVal19-hTrp2-hLys2-NH2).
Fig. 3
Fig. 3. Schematic view on two 314-helical β-peptides oriented in an antiparallel fashion with three amino acids forming one turn and zero hGln (9/10/11, left), two hGln (12/13/14, middle) and three hGln (15/16/17, right) recognition units. The β-peptides were acetylated or labelled with NBD and TAMRA for FRET-analysis and synthesized from N- to C-terminus.
Fig. 4
Fig. 4. CD-spectra of 9, 12 and 15 in DOPC LUVs (peptides concentration: 38 μm, P/L-ratio = 1/20, 25 °C).
Fig. 5
Fig. 5. Fluorescence spectra of equimolar mixtures of 10/11, 13/14 and 16/17 in DOPC LUVs (peptide concentration: 12 μm, P/L-ratio = 1/500, 25 °C).
Fig. 6
Fig. 6. (A + B) Fluorescence emission spectra of NBD-labelled β-peptides (donor, 6.0 μm) and varying amounts of TAMRA-labelled species from χA = 0–0.5 determined at 25 °C. The non-labelled compound was added to keep the total peptide concentration constant (12 μm) and the P/L-ratio at 1/500 (DOPC). (A) 12/13/14 with two hGln and (B) 15/16/17 with three hGln. (C) Relative changes in NBD-fluorescence emission (F/F0) as a function of increasing acceptor concentration (χA) are plotted for all three cases at 25 °C (9/10/11 with zero hGln, 12/13/14 with two hGln and 15/16/17 with three hGln). The grey solid line is the result of a model according to Wolber et al., by taking only statistical occurrence of FRET in vesicles without the formation of aggregates into account., A monomer–dimer equilibrium does not explain the data. Even the assumption of a pure dimer (dashed black line) does not explain the observed plots. The solid lines are results of the global fit analysis, which takes a monomer–trimer equilibrium into account with KD = (17.2 ± 7.0) × 10–8 MF2 (two hGln) and KD = (4.4 ± 4.3) × 10–8 MF2 (three hGln).
Fig. 7
Fig. 7. Relative changes in NBD-fluorescence emission (F/F0) as a function of increasing acceptor concentration (χA) are plotted for 12/13/14 with two hGln (A) and 15/16/17 with three hGln (B) as recognition units at 25 °C and 60 °C. The grey solid line is the result of a model according to Wolber et al., taking only statistical occurrence of FRET in vesicles without the formation of aggregates into account., The black solid lines are the results of a global fit analysis which takes a monomer–trimer equilibrium into account with KD = (17.2 ± 7.0) × 10–8 MF2 (two hGln) and KD = (4.4 ± 4.3) × 10–8 MF2 (three hGln).

References

    1. Rueping M., Mahajan Y. R., Jaun B., Seebach D. Chem.–Eur. J. 2004;10:1607–1615. - PubMed
    1. Koert U. Angew. Chem., Int. Ed. Engl. 1997;36:1836–1837.
    1. Brückner A. M., Chakraborty P., Gellman S. H., Diederichsen U. Angew. Chem., Int. Ed. 2003;42:4395–4399. - PubMed
    1. Chakraborty P., Diederichsen U. Chem.–Eur. J. 2005;11:3207–3216. - PubMed
    1. Naarmann N., Bilgiçer B., Meng H., Kumar K., Steinem C. Angew. Chem., Int. Ed. 2006;45:2588–2591. - PubMed

LinkOut - more resources