. 2018 Apr 4:19:47-55.
doi: 10.1016/j.nicl.2018.04.006. eCollection 2018.

High field imaging of large-scale neurotransmitter networks: Proof of concept and initial application to epilepsy

Affiliations

High field imaging of large-scale neurotransmitter networks: Proof of concept and initial application to epilepsy

Tamar M van Veenendaal et al. Neuroimage Clin. .

Abstract

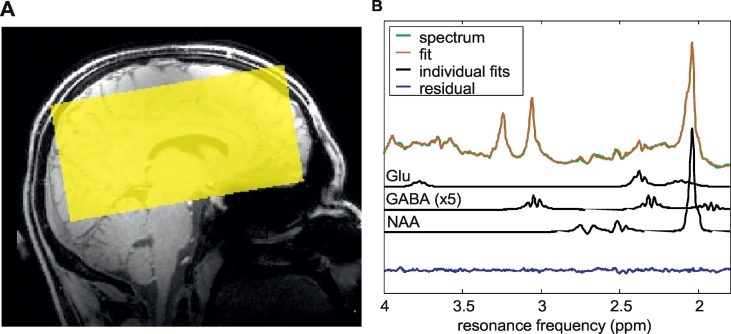
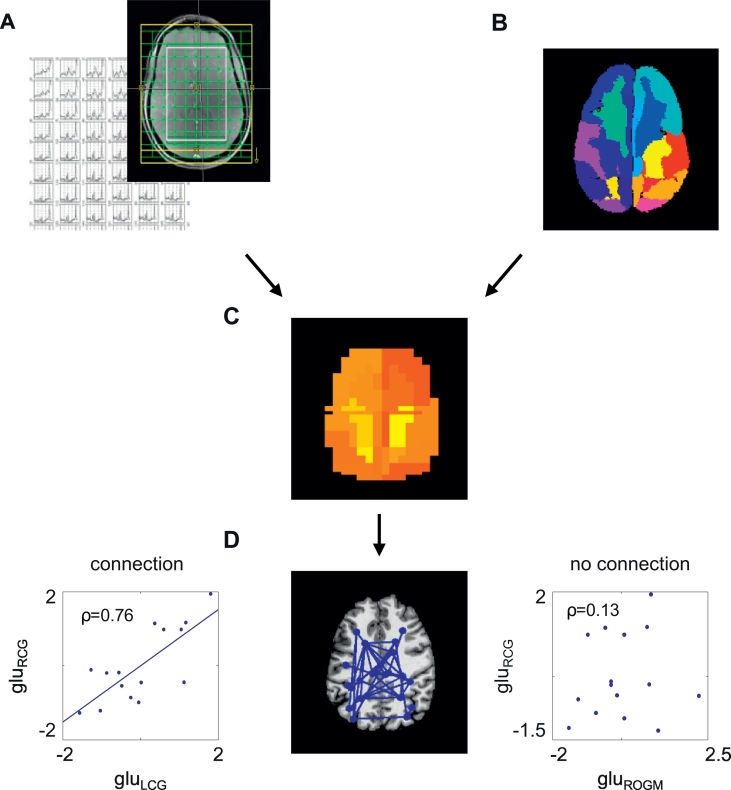
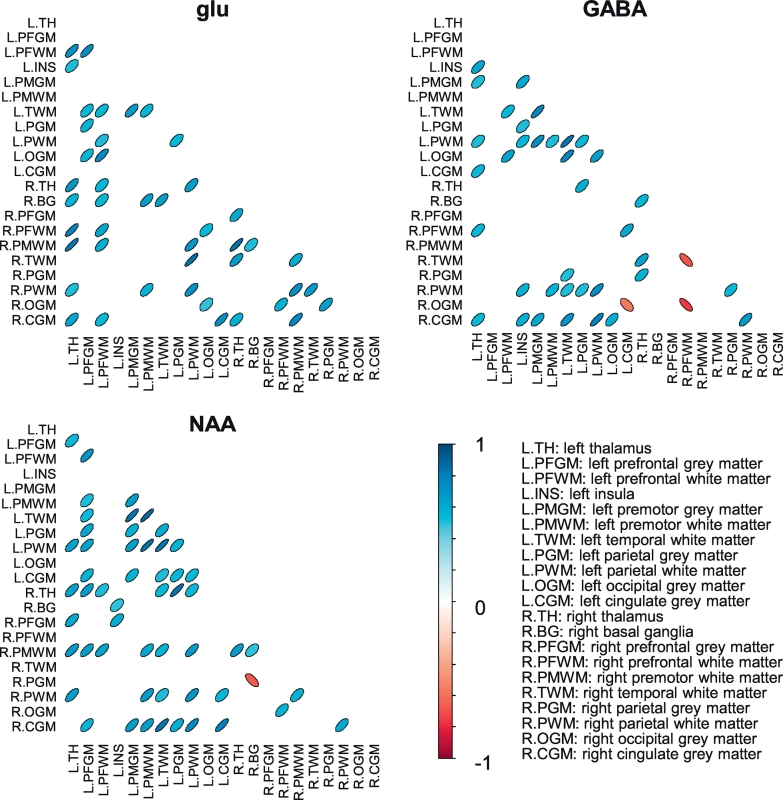
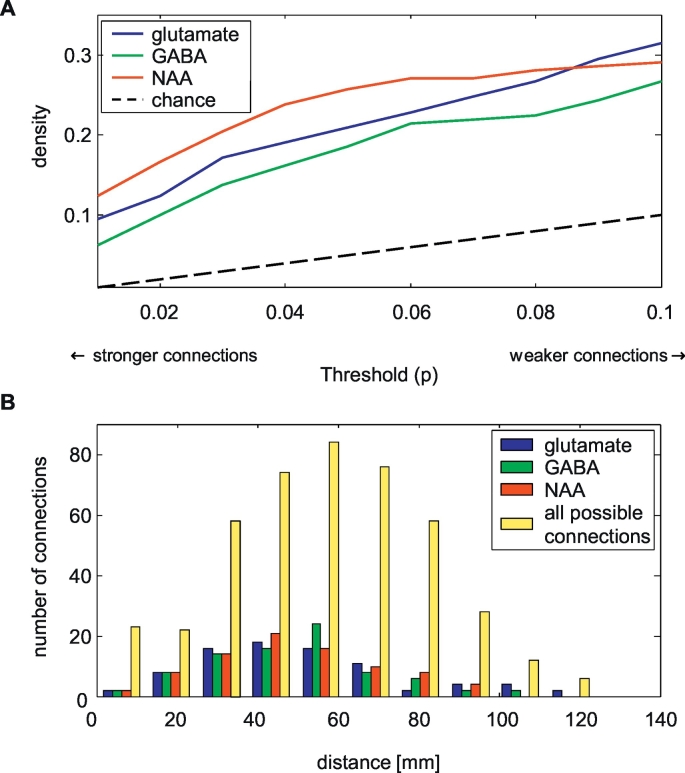
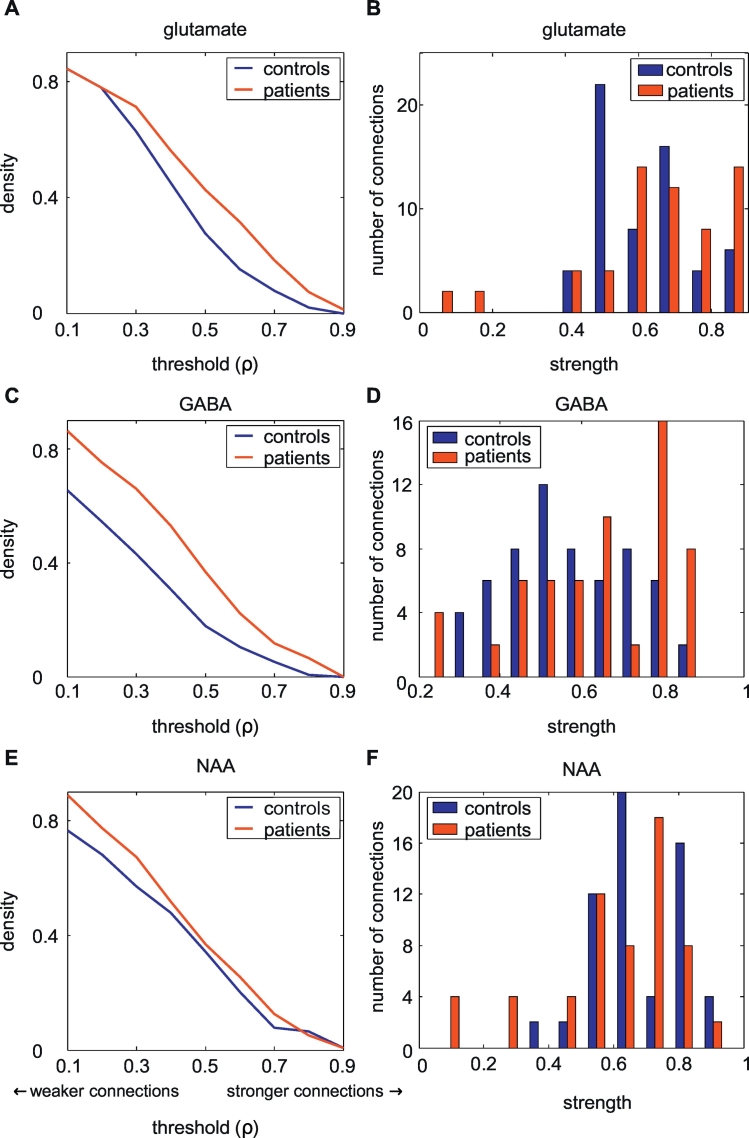
The brain can be considered a network, existing of multiple interconnected areas with various functions. MRI provides opportunities to map the large-scale network organization of the brain. We tap into the neurobiochemical dimension of these networks, as neuronal functioning and signal trafficking across distributed brain regions relies on the release and presence of neurotransmitters. Using high-field MR spectroscopic imaging at 7.0 T, we obtained a non-invasive snapshot of the spatial distribution of the neurotransmitters GABA and glutamate, and investigated interregional associations of these neurotransmitters. We demonstrate that interregional correlations of glutamate and GABA concentrations can be conceptualized as networks. Furthermore, patients with epilepsy display an increased number of glutamate and GABA connections and increased average strength of the GABA network. The increased glutamate and GABA connectivity in epilepsy might indicate a disrupted neurotransmitter balance. In addition to epilepsy, the 'neurotransmitter networks' concept might also provide new insights for other neurological diseases.

Keywords: 7T; GABA; Glutamate; MR spectroscopic imaging; Networks.


Figures

Fig. 1
Fig. 1
A. Field-of-view of the MRSI image. B. Typical example of a measured spectrum with the quantitative (LCModel) fit, and individual glutamate (glu), GABA and N-acetylaspartate (NAA) fits.
Fig. 2
Fig. 2
Analysis of the metabolite networks. The spectra were first analyzed in LCModel (A) and aligned with the structural image (B), and mean metabolite concentrations were calculated per area (C). Connections between areas were defined as correlated neurometabolite concentrations (D). Glu: standardized glutamate concentration; RCG: right cingulate gyrus; LCG: left cingulate gyrus; ROGM: right occipital grey matter.
Fig. 3
Fig. 3
Correlation matrices of the glutamate (glu), GABA and N-acetylaspartate (NAA) networks in healthy participants. The shape and color of the ovals indicate the correlations coefficient (ρ) between each pair of areas, i.e. the strength of the connections between those areas and the sign of the correlations (red: negative, blue: positive). Only connections with a p < 0.05 are displayed. Figures were created in R version 3.2.2 (Team, 2015; Wright, 2016). (For interpretation of the references to color in this figure legend, the reader is referred to the web version of this article.)
Fig. 4
Fig. 4
Characteristics of the neurometabolite networks. In A, the density of the networks is displayed at different thresholds (i.e. the p-value of the correlation). It can be observed that the density of the networks is much higher than would be expected by chance only. B displays the distribution of distances between the nodes, including the distances between all possible connections. The neurometabolite networks include both long- and short distance connections. The density of networks was set to 0.2 for all three metabolites.
Fig. 5
Fig. 5
Network density in the healthy-subject group and patient group (A, C, E). In both glutamate and GABA networks, the density in patients is higher than that of the healthy participants. B, D, and F show how the distributions of connection strengths of both groups in the glutamate, GABA, and NAA networks. While the glutamate and NAA networks show similar strength distributions, the GABA network shows increased connection strengths in patients with epilepsy.

References

    1. Amunts K., Lenzen M., Friederici A.D., Schleicher A., Morosan P., Palomero-Gallagher N., Zilles K. Broca's region: novel organizational principles and multiple receptor mapping. PLoS Biol. 2010;8 - PMC - PubMed
    1. Andersson J.L., Jenkinson M., Smith S. FMRIB Analysis Group of the University of Oxford 2. 2007. Non-linear registration, aka spatial normalisation FMRIB technical report TR07JA2.
    1. Ansari-Lari M. Binomial distribution and estimation of the true prevalence of infected animals when pooled samples are used. Can. Vet. J. 2004;45:719. (author reply 720) - PMC - PubMed
    1. Bassett D.S., Bullmore E., Verchinski B.A., Mattay V.S., Weinberger D.R., Meyer-Lindenberg A. Hierarchical organization of human cortical networks in health and schizophrenia. J. Neurosci. 2008;28:9239–9248. - PMC - PubMed
    1. Bernhardt B.C., Hong S., Bernasconi A., Bernasconi N. Imaging structural and functional brain networks in temporal lobe epilepsy. Front. Hum. Neurosci. 2013;7:624. - PMC - PubMed

Publication types