. 2018 Mar 28:19:232-239.
doi: 10.1016/j.nicl.2018.03.034. eCollection 2018.

Progressive brain rich-club network disruption from clinically isolated syndrome towards multiple sclerosis

Affiliations

Progressive brain rich-club network disruption from clinically isolated syndrome towards multiple sclerosis

Ni Shu et al. Neuroimage Clin. .

Abstract

Objective: To investigate the rich-club organization in clinically isolated syndrome (CIS) and multiple sclerosis (MS), and to characterize its relationships with physical disabilities and cognitive impairments.

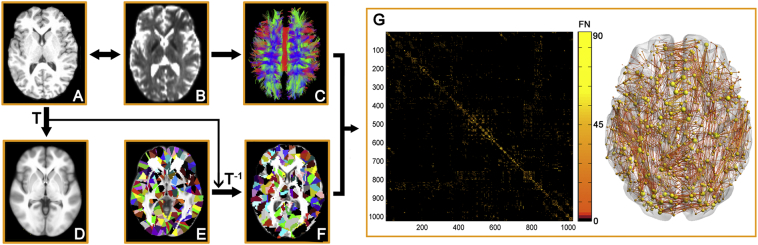
Methods: We constructed high-resolution white matter (WM) structural networks in 41 CIS, 32 MS and 35 healthy controls (HCs) using diffusion MRI and deterministic tractography. Group differences in rich-club organization, global and local network metrics were investigated. The relationship between the altered network metrics, brain lesions and clinical variables including EDSS, MMSE, PASAT, disease duration were calculated. Additionally, reproducibility analysis was performed using different parcellation schemes.

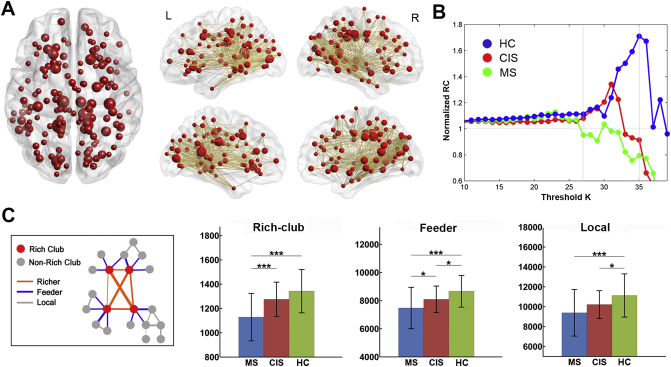
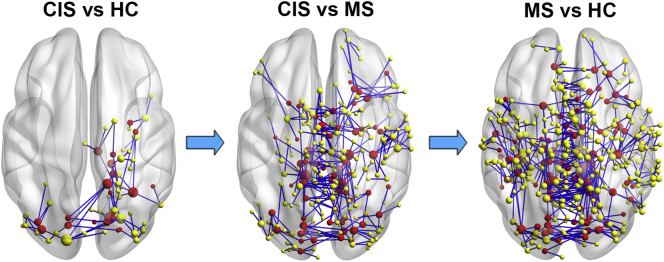
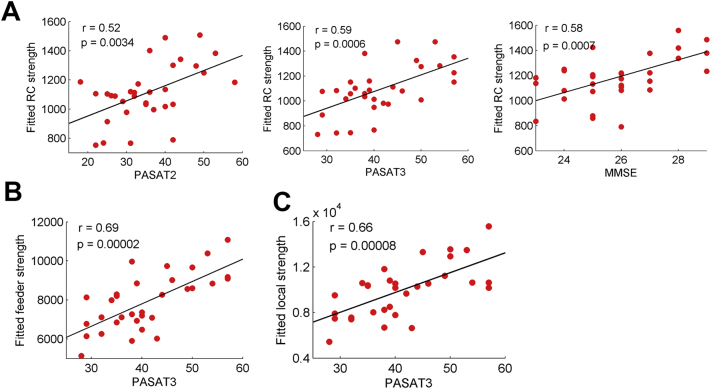
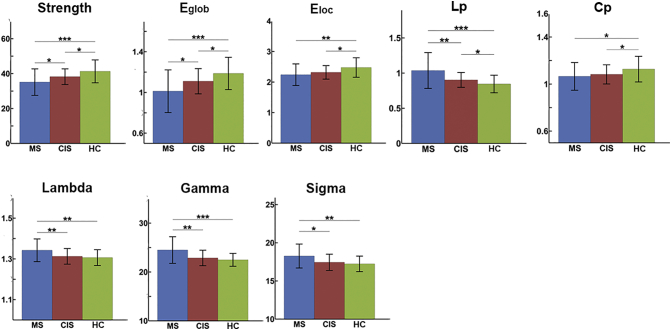
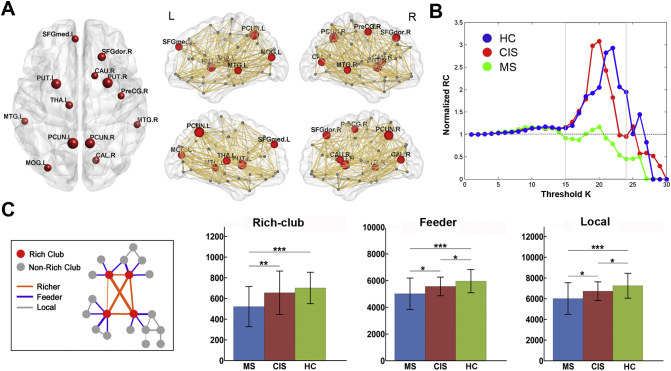
Results: Compared with HCs, MS patients exhibited a decreased strength in all types of connections (rich-club: p < 0.0001; feeder: p = 0.0004; and local: p = 0.0026). CIS patients showed intermediate values between MS patients and HCs and exhibited a decreased strength in feeder and local connections (feeder: p = 0.019; and local: p = 0.031) but not in rich-club connections. Compared with CIS patients, MS patients showed significant reductions in rich-club connections (p = 0.0004). The reduced strength of rich-club and feeder connections was correlated with cognitive impairments in the MS group. These results were independent of lesion distribution and reproducible across different brain parcellation schemes.

Conclusion: The rich-club organization was disrupted in MS patients and relatively preserved in CIS. The disrupted rich-club connectivity was correlated with cognitive impairment in MS. These findings suggest that impaired rich-club connectivity is an essential feature of progressive structural network disruption, heralding the development of clinical disability in MS.

Keywords: Brain network; CIS, clinically isolated syndrome; Clinically isolated syndrome; DTI, diffusion tensor imaging; Diffusion MRI; EDSS, expanded disability status scale; Graph theory; MMSE, mini-mental state examination; MRI, magnetic resonance imaging; MS, multiple sclerosis; Multiple sclerosis; PASAT, paced auditory serial attention test; Rich-club.


Figures

Fig. 1
Fig. 1
The flowchart of structural network construction. (A) Individual T1 images and H-1024 template were used for automatic parcellation of the brain into 1024 regions, forming the nodes of the individual brain networks. (B) Streamline tractography was applied to the diffusion MRI data to reconstruct the white matter pathways. From the set of reconstructed streamlines, the streamlines that interconnected regions i and j from the set of 1024 regions were taken as an edge between nodes i and j in the structural brain network. The streamline count represents the weight of the connection and was aggregated into a structural connectivity (SC) matrix (C). (D) The matrices and 3D representations (lateral view) of the structural networks of a representative healthy subject are shown in the right panel. The nodes are located according to their centroid stereotaxic coordinates, and the edges are coded according to their connection weights. For details, see the Materials and Methods section.
Fig. 2
Fig. 2
Rich-club organization of high-resolution brain structural connectome. (A) Hub distribution of structural backbone network across all subjects. Network hubs are represented as nodes in red, with nodal size indicating the degree of the regions. (B) The mean normalized RC coefficient curve under a series of thresholds k for each group. (C) Group differences in the strength of the rich-club, feeder and local connections. The bars and error bars represent the mean values and standard deviations of the connection strength in each group after removing the effects of age and gender. *: p < 0.05; **: p < 0.01; ***: p < 0.005.
Fig. 3
Fig. 3
Disrupted structural connectivity in CIS and MS patients. Connected components showing decreased structural connectivity were identified between CIS vs. controls, MS vs. CIS and MS vs. controls (HC) (p < 0.05, corrected). The nodes and connections were mapped onto the cortical surfaces using in-house BrainNet viewer software. The nodes in red represent the hub regions of the backbone network.
Fig. 4
Fig. 4
Correlations between the rich-club metrics and clinical variables in patients with MS. (A) Plots showing the linear correlation between altered rich-club connection strength with PASAT2, PASAT3 and MMSE scores in MS patients (all p < 0.05, corrected). (B) Plots showing the linear correlation between altered feeder connection strength with PASAT3 score in MS patients. (C) Plots showing the linear correlation between altered local connection strength with PASAT3 score in MS patients. The red dots represent the adjusted values of MS patients after controlling for age and gender.
Fig. S1
Fig. S1
Group differences in the global network metrics. The bars and error bars represent the mean values and standard deviations of the network properties in each group after removing the effects of age and gender. Significantly reduced strength, global efficiency, local efficiency, clustering and increased shortest path length of the structural networks were observed in both CIS and MS patients relative to the controls (HC). *: p < 0.05; **: p < 0.01; ***: p < 0.005.
Fig. S2
Fig. S2
Reproducibility of the rich-club organization in L-AAL network. (A) Hub distribution of structural backbone network across all subjects. Network hubs are represented with nodes in red, with nodal size indicating the degree of the regions. (B) Mean normalized RC coefficient curve under a series of thresholds k for each group. (C) Group differences in the strength of the rich-club, feeder and local connections. The bars and error bars represent the mean values and standard deviations of the connection strength in each group after removing the effects of age and gender. *: p < 0.05; **: p < 0.01; ***: p < 0.005.

References

    1. Bai F., Shu N., Yuan Y., Shi Y., Yu H., Wu D., Wang J., Xia M., He Y., Zhang Z. Topologically convergent and divergent structural connectivity patterns between patients with remitted geriatric depression and amnestic mild cognitive impairment. J. Neurosci. 2012;32:4307–4318. - PMC - PubMed
    1. Basser P.J., Pierpaoli C. Microstructural and physiological features of tissues elucidated by quantitative-diffusion-tensor MRI. J. Magn. Reson. B. 1996;111:209–219. - PubMed
    1. Basser P.J., Mattiello J., LeBihan D. MR diffusion tensor spectroscopy and imaging. Biophys. J. 1994;66:259–267. - PMC - PubMed
    1. Bullmore E., Sporns O. Complex brain networks: graph theoretical analysis of structural and functional systems. Nat. Rev. Neurosci. 2009;10:186–198. - PubMed
    1. Calabrese M., Magliozzi R., Ciccarelli O., Geurts J.J., Reynolds R., Martin R. Exploring the origins of grey matter damage in multiple sclerosis. Nat. Rev. Neurosci. 2015;16:147–158. - PubMed

Publication types