. 2018 Jul;5(3):035001.
doi: 10.1117/1.NPh.5.3.035001. Epub 2018 Jul 12.

FNIRS activity in the prefrontal cortex and motivational intensity: impact of working memory load, financial reward, and correlation-based signal improvement

Affiliations

FNIRS activity in the prefrontal cortex and motivational intensity: impact of working memory load, financial reward, and correlation-based signal improvement

Stephen H Fairclough et al. Neurophotonics. 2018 Jul.

Abstract

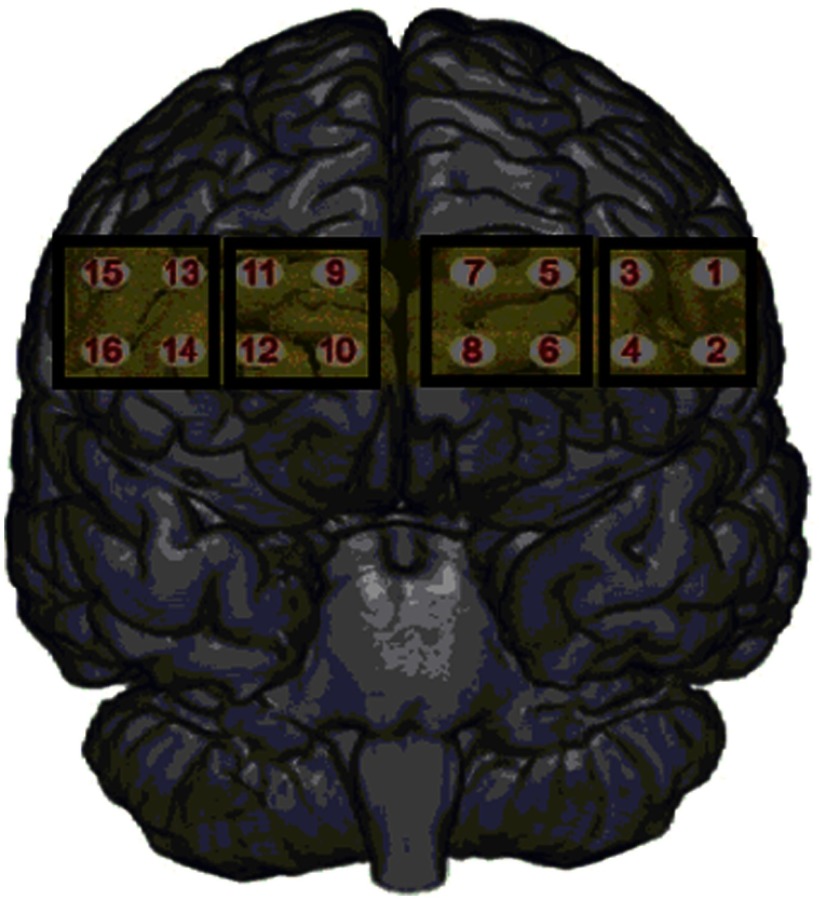
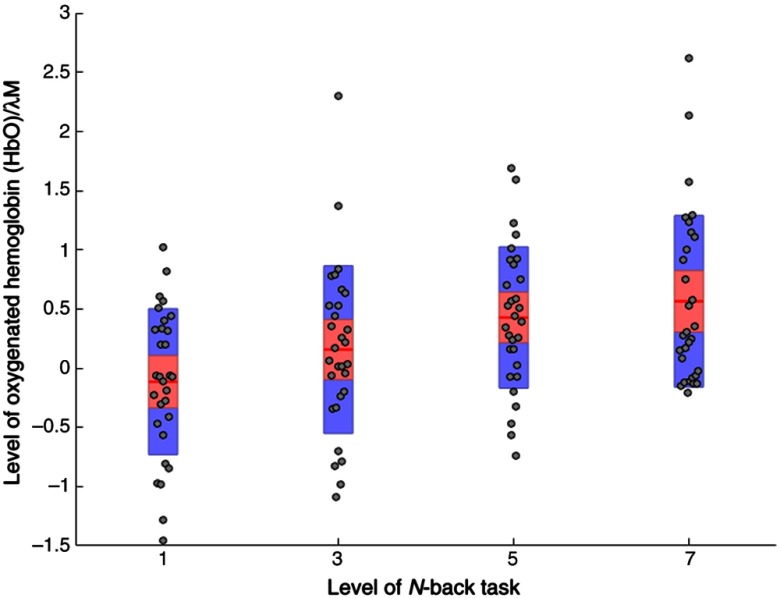
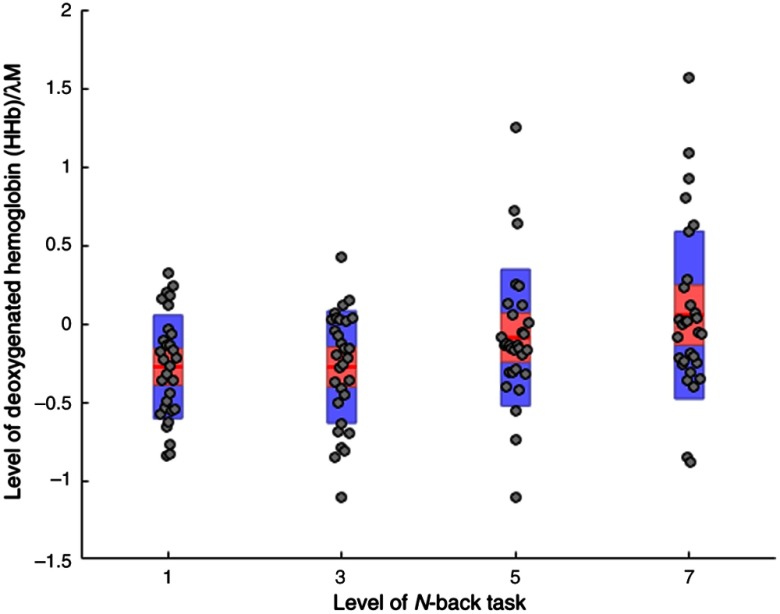
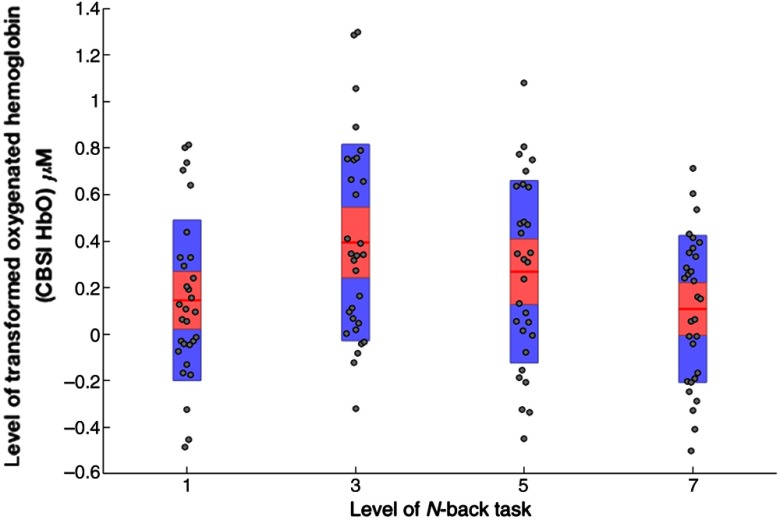
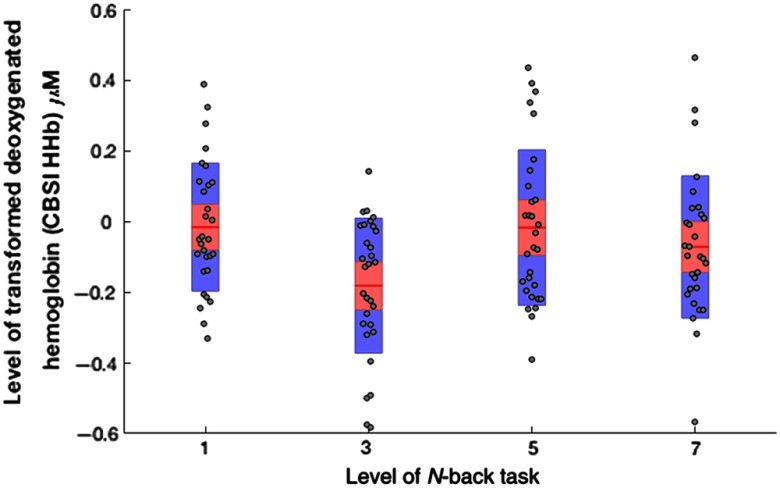
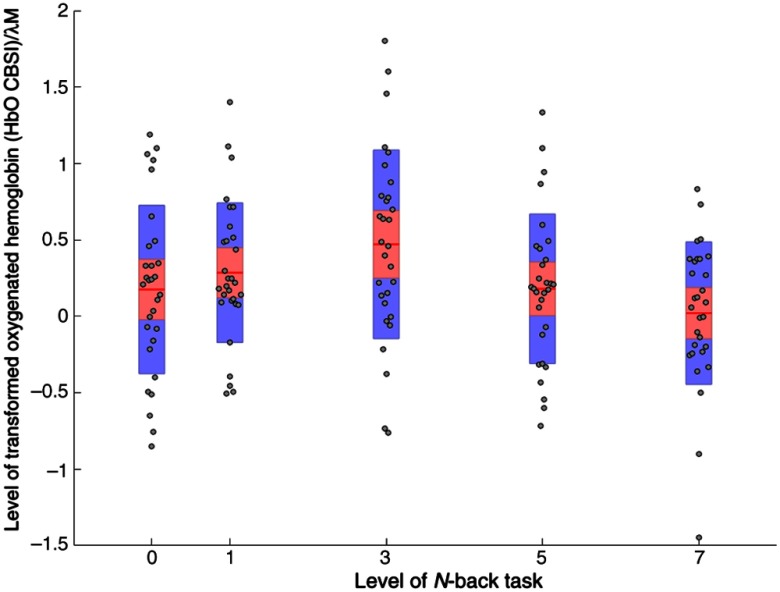
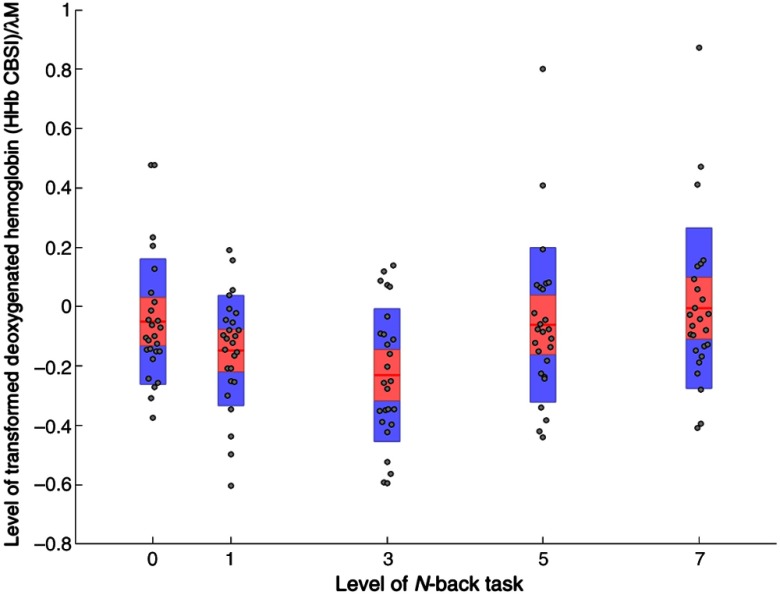
Previous research has demonstrated changes in neurovascular activation of the prefrontal cortex to increased working memory load. The primary purpose of the current paper was to investigate overload of working memory capacity using functional near-infrared spectroscopy (fNIRS) within the framework of motivational intensity theory. A secondary goal was to explore the influence of the correlation-based signal improvement (CBSI) as a method for correcting the influence of systemic variables. In study one, 30 participants (15 female, mean age = 21.09 years, s.d. = 2.9 years) performed a verbal version of the n -back working memory task under four levels of demand (easy, hard, very hard, and impossible). In contrast to the raw data, CBSI-transformed fNIRS data indicated that neurovascular coupling was highest at hard demand when the task was challenging but success was possible. The second study ( N=30 ; 15 female, mean age = 22.4 years, s.d. = 5.3) replicated the working memory manipulation with the addition of low versus high levels of financial reward. Analyses of CBSI-transformed levels of oxygenated (HbO) and deoxygenated (HHb) hemoglobin replicated the first study at right lateral regions of the prefrontal cortex (BA46). HHb_CBSI data were significantly reduced at impossible demand for participants receiving the higher level of financial reward. The study is the first to support predictions from the motivational intensity model using neurovascular data. In addition, the application of CBSI to fNIRS data was found to improve the sensitivity of HbO and Hbb to the independent variables.

Keywords: functional near-infrared spectroscopy; motivation; prefrontal cortex; reward; signal processing; working memory.


Figures

Fig. 1
Fig. 1
Placement of fNIRS device and approximate location of 16 channels categorized as four regions of interest.
Fig. 2
Fig. 2
Levels of HbO across all four levels of working memory demand (1-back, 3-back, 5-back, and 7-back) at ROI 3 (N=30). Note: red line = mean, red area = standard deviation, blue bars = 95% confidence intervals, and gray circles = actual values.
Fig. 3
Fig. 3
Levels of HHb across all four levels of working memory demand (1-back, 3-back, 5-back, and 7-back) at ROI 3 (N=30). Note: red line = mean, red area = standard deviation, blue bars = 95% confidence intervals, and gray circles = actual values.
Fig. 4
Fig. 4
Levels of HbO_CBSI across all four levels of working memory demand (1-back, 3-back, 5-back, and 7-back) at ROI 4 (N=30). Note: red line = mean, red area = standard deviation, blue bars = 95% confidence intervals, and gray circles = actual values.
Fig. 5
Fig. 5
Levels of HHb_CBSI across all four levels of working memory demand (1-back, 3-back, 5-back, and 7-back) at ROI 4 (N=30). Note: red line = mean, red area = standard deviation, blue bars = 95% confidence intervals, and gray circles = actual values.
Fig. 6
Fig. 6
Mean level of HbO_CBSI at channel 12 across all levels of working memory demand (N=30). Note: red line = mean, red area = standard deviation, blue bars = 95% confidence intervals, and gray circles = actual values.
Fig. 7
Fig. 7
Mean level of HHb_CBSI at ROI4 across all levels of working memory demand (N=30). Note: red line = mean, red area = standard deviation, blue bars = 95% confidence intervals, and gray circles = actual values.

References

    1. Ferrari M., Quaresima V., “A brief review on the history of human functional near-infrared spectroscopy (fNIRS) development and fields of application,” Neuroimage 63(2), 921–935 (2012).NEIMEF10.1016/j.neuroimage.2012.03.049 - DOI - PubMed
    1. Strangman G. E., Li Z., Zhang Q., “Depth sensitivity and source-detector separations for near infrared spectroscopy based on the Colin27 brain template,” PLoS One 8(8), e66319 (2013).POLNCL10.1371/journal.pone.0066319 - DOI - PMC - PubMed
    1. Ramnani N., Owen A. M., “Anterior prefrontal cortex: insights into function from anatomy and neuroimaging,” Nat. Rev. Neurosci. 5, 184–194 (2004).NRNAAN10.1038/nrn1343 - DOI - PubMed
    1. Ayaz H., et al. , “Optical brain monitoring for operator training and mental workload assessment,” Neuroimage 59(1), 36–47 (2012).NEIMEF10.1016/j.neuroimage.2011.06.023 - DOI - PubMed
    1. Herff C., et al. , “Mental workload during n-back task—quantified in the prefrontal cortex using fNIRS,” Front. Hum. Neurosci. 7, 935 (2014).10.3389/fnhum.2013.00935 - DOI - PMC - PubMed