. 2018 Jul 18;4(7):eaao6030.
doi: 10.1126/sciadv.aao6030. eCollection 2018 Jul.

Unpacking the polarization of workplace skills

Affiliations

Unpacking the polarization of workplace skills

Ahmad Alabdulkareem et al. Sci Adv. .

Abstract

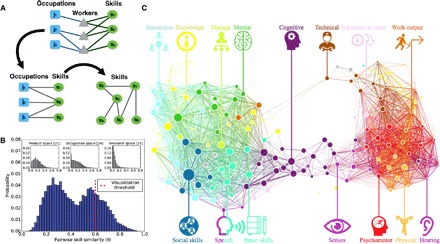
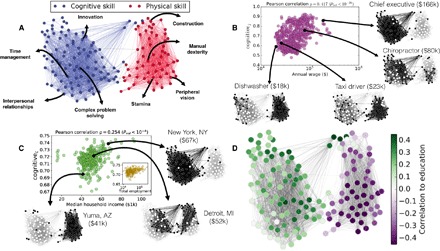
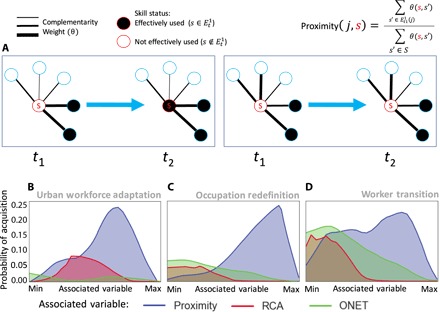
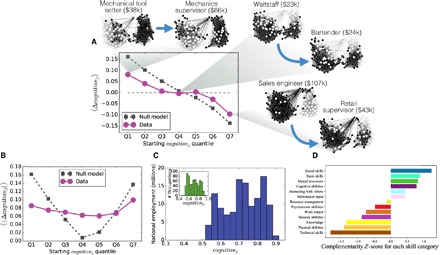
Economic inequality is one of the biggest challenges facing society today. Inequality has been recently exacerbated by growth in high- and low-wage occupations at the expense of middle-wage occupations, leading to a "hollowing" of the middle class. Yet, our understanding of how workplace skills drive this process is limited. Specifically, how do skill requirements distinguish high- and low-wage occupations, and does this distinction constrain the mobility of individuals and urban labor markets? Using unsupervised clustering techniques from network science, we show that skills exhibit a striking polarization into two clusters that highlight the specific social-cognitive skills and sensory-physical skills of high- and low-wage occupations, respectively. The connections between skills explain various dynamics: how workers transition between occupations, how cities acquire comparative advantage in new skills, and how individual occupations change their skill requirements. We also show that the polarized skill topology constrains the career mobility of individual workers, with low-skill workers "stuck" relying on the low-wage skill set. Together, these results provide a new explanation for the persistence of occupational polarization and inform strategies to mitigate the negative effects of automation and offshoring of employment. In addition to our analysis, we provide an online tool for the public and policy makers to explore the skill network: skillscape.mit.edu.


Figures

Fig. 1
Fig. 1. Constructing the Skillscape.
(A) An occupation is identified through the skills of workers of that occupation. The bipartite network connecting occupations to required skills is a result of an underlying tripartite network containing workers as a conduit between occupations and skills. Relationships between skills are determined from their co-occuring importance across occupations. (B) Unlike previous applications of RCA (insets), the Skillscape contains a bimodal distribution of pairwise skill complementarity. (C) The Skillscape thresholded according to a minimum skill similarity (that is, θ > 0.6) visibly reveals two communities of complementary skills and respects expertly derived O*NET categories (colors). Node sizes reflect the total skill similarity shared between that skill and all other skills.
Fig. 2
Fig. 2. The polarized Skillscape explains occupational wage polarization and economic well-being of urban workforces.
(A) Community detection on the complete Skillscape network (that is, no minimum θ) reveals two communities of complementary skills: sociocognitive skills (blue) and sensory-physical skills (red). The displayed network is filtered (θ > 0.6) for visualization purposes. (B) Occupations relying on sociocognitive skills tend to make higher annual salaries. (C) Larger cities rely more strongly on sociocognitive skills (inset), yielding higher median household income by comparison to smaller cities. In (B) and (C), example occupations (cities), along with their annual wages (median household income), are projected onto the Skillscape using black nodes for effectively used skills. (D) The skill network colored by correlation between onet(j, s) and the average educational degree requirement across occupations.
Fig. 3
Fig. 3. Reliance on cognitive skills predicts increased annual wages according to OLS regression.
As a baseline, we consider the relative importance of routine labor using routine O*NET variables from (38). In addition to cognitive skill fraction (cognitivej), we calculate the total skill content [∑s onet(j, s)] of each occupation. Each educational variable represents the total employment in that occupation whose highest educational degree is a high school diploma, a bachelor’s degree, etc. All variables were standardized before regression. SEs are reported in parentheses, and asterisks indicate the statistical significance of coefficient approximations. We perform out-of-sample testing for each model through 1000 trails of randomly selecting 75% of the occupations as training data and measuring the root mean square error of the resulting model applied to the remaining 25% of occupations. We represent the resulting model performance as box plots. Red lines represent median error, while triangles represent the mean error. GED, General Education Diploma.
Fig. 4
Fig. 4. Skill proximity predicts worker transitions between occupations, skill redefinition of occupations, and skill acquisition in cities.
(A) An example demonstrating Skillscape proximity [that is, proximity(j, s)] as a proxy for the connections between effectively used skills and other skills. (B) Skills with high proximity to the effectively used skills of an urban labor market in 2010 are more likely to be effectively used by that workforce in 2015. (C) Skills with high proximity to the effectively used skills of an occupation in 2010 are more likely to be effectively used by that occupation in 2015. (D) The effectively used skills of a worker’s occupation in 2015 are more likely to be effectively used by the workers’ next occupation in 2016. We provide bar plots including 95% confidence intervals for these probabilities in section S7.4, and we consider an alternative receiver operator curve analysis in section S7.
Fig. 5
Fig. 5. The polarized skill network constrains worker mobility.
Binning by the cognitivej of the worker’s occupation in 2014 reveals the (A) expected cognitive change and the (B) expected magnitude of cognitive change when workers change occupations. Random occupation selection is considered as a null model (gray). SE bars are provided but are small. Actual occupational transitions are provided as examples in (A). (C) The national distribution of employment by cognitivej with the distribution of individual occupations as an inset. (D) The average complementarity strength that skills possess in each skill category; this measure corresponds to worker mobility because skill proximity is indicative of skill acquisition.

References

    1. R. Kochhar, R. Fry, M. Rohal, The American Middle Class is Losing Ground (Pew Research Center, 2015).
    1. R. Chetty, D. Grusky, M. Hell, N. Hendren, R. Manduca, J. Narang, “The fading American dream: Trends in absolute income mobility since 1940” (Technical Report, National Bureau of Economic Research, 2016). - PubMed
    1. R. D. Putnam, Our Kids: The American Dream in Crisis (Simon and Schuster, 2016).
    1. H. B. Johnson, The American Dream and the Power of Wealth: Choosing Schools and Inheriting Inequality in The Land of Opportunity (Routledge, 2014).
    1. “America’s shrinking middle class: A close look at changes within metropolitan areas” (Technical Report, Pew Research Center, 2016).

Publication types

LinkOut - more resources