. 2018 Aug 1;128(8):3517-3534.
doi: 10.1172/JCI120316. Epub 2018 Jul 23.

Mosaic-variegated aneuploidy syndrome mutation or haploinsufficiency in Cep57 impairs tumor suppression

Affiliations

Mosaic-variegated aneuploidy syndrome mutation or haploinsufficiency in Cep57 impairs tumor suppression

Khaled Aziz et al. J Clin Invest. .

Abstract

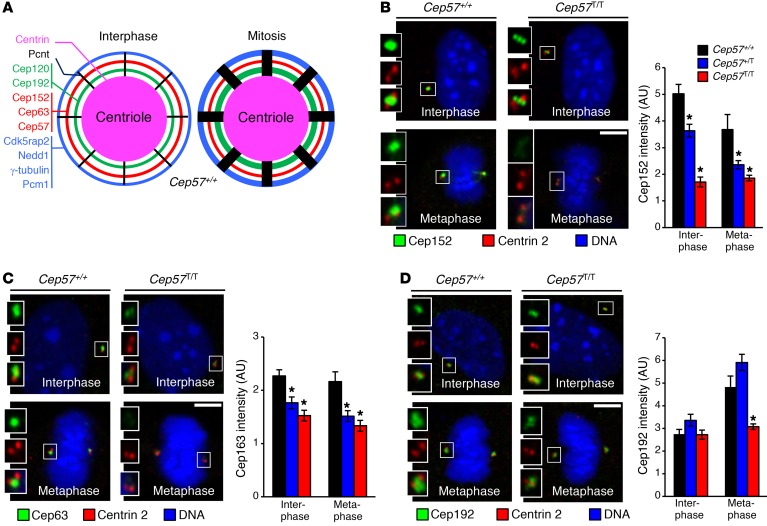
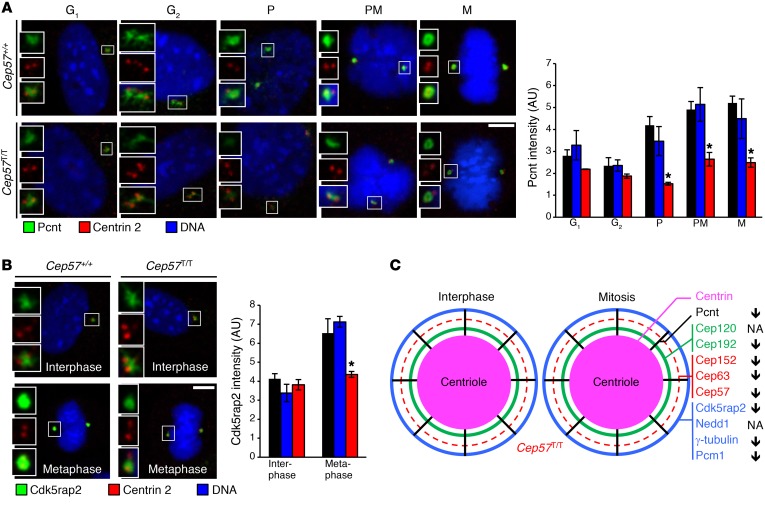
A homozygous truncating frameshift mutation in CEP57 (CEP57T/T) has been identified in a subset of mosaic-variegated aneuploidy (MVA) patients; however, the physiological roles of the centrosome-associated protein CEP57 that contribute to disease are unknown. To investigate these, we have generated a mouse model mimicking this disease mutation. Cep57T/T mice died within 24 hours after birth with short, curly tails and severely impaired vertebral ossification. Osteoblasts in lumbosacral vertebrae of Cep57T/T mice were deficient for Fgf2, a Cep57 binding partner implicated in diverse biological processes, including bone formation. Furthermore, a broad spectrum of tissues of Cep57T/T mice had severe aneuploidy at birth, consistent with the MVA patient phenotype. Cep57T/T mouse embryonic fibroblasts and patient-derived skin fibroblasts failed to undergo centrosome maturation in G2 phase, causing premature centriole disjunction, centrosome amplification, aberrant spindle formation, and high rates of chromosome missegregation. Mice heterozygous for the truncating frameshift mutation or a Cep57-null allele were overtly indistinguishable from WT mice despite reduced Cep57 protein levels, yet prone to aneuploidization and cancer, with tumors lacking evidence for loss of heterozygosity. This study identifies Cep57 as a haploinsufficient tumor suppressor with biologically diverse roles in centrosome maturation and Fgf2-mediated bone formation.

Keywords: Bone development; Cell Biology; Genetic diseases; Oncology.


Conflict of interest statement

Conflict of interest: The authors have declared that no conflict of interest exists.

Figures

Figure 1
Figure 1. Cep57 controls Fgf2-mediated bone development.
(A) Gene targeting approach used to mimic the CEP57T patient mutation. Shown are the relevant portion of the murine Cep57 locus (top), the targeting vector (the 11-bp duplication is highlighted in red) with the recombined hypomorphic allele (middle), and the final Cep57T allele following Cre-mediated excision of the neomycin (NEO) selection cassette. (B) Images of pups several hours after birth (arrowhead marks the short curly tail). Scale bars: 5 mm. (C) H&E-stained sagittal sections of 1-day-old pups. Arrowheads indicate the degree of spinal cord curvature. Scale bars: 1 mm. High magnification of the areas marked by red and green boxes are shown to the right. Scale bars: 100 μm. (D) Images of alizarin red– and Alcian blue–stained bone (red) and cartilage (blue) tissue of 1-day-old pups. Indicated are lumbar vertebra 4 (L4), sacral vertebra 1 (S1), and caudal vertebra 1 and 8 (Ct1 and Ct8) landmarks. Inset (yellow box) shows defective (bifid) vertebral body ossification. Scale bars: 1 mm. (E) Western blot analysis of brain and lung lysates of 1-day-old Cep57+/+, Cep57+/T, and Cep57T/T mice. Ponceau (PonS) served as loading control. (F) Representative images of sagittal sections from thoracic and lumbosacral vertebral regions of 1-day-old pups immunostained for Fgf2. Arrowheads indicate regions with Fgf2 expression. Scale bars: 100 μm. (G) Analysis of Fgf2 subcellular localization using immunofluorescence in paraffin sections of the lumbosacral region of 1-day-old pups labeled for Fgf2. Nuclei were visualized with Hoechst. Scale bar: 5 μm. (H) Western blots of tissue lysates probed for Fgf2. Shown are the 35-kDa (full-length) and 18-kDa isoforms of Fgf2. PonS served as the loading control. Western blots are representative of 3 independent experiments.
Figure 2
Figure 2. Cep57 is undetectable in Cep57T/T MEFs and CEP57T/T patient fibroblasts.
(A) Western blots of MEF lysates comparing Cep57 expression levels among various genotypes as well as normal human fibroblasts and CEP57T/T MVA patient fibroblasts. The red arrowhead indicates the predicted size of the truncated Cep57T product (40 kDa). Ponceau (PonS) served as loading control. (B) Quantitative reverse transcriptase PCR analysis of Cep57 transcript expression in MEFs of indicated genotypes. Three independent lines were evaluated per genotype, and quantitative PCR run in triplicate. (C) Representative images of interphase and metaphase MEFs, and normal human and MVA patient fibroblasts labeled for Cep57 and centrin 2. Insets display magnified images of centrosomes. Scale bars: 5 μm. (D) Quantification of Cep57 intensity as seen in C. (E) Quantification of centrin 2 intensity as seen in C. Analyses in B, D, and E were performed on at least 3 independent lines per genotype (20 cells per line). Data represent the mean ± SEM. Western blots are representative of 3 independent experiments. Statistical significance in B and E was determined using 1-way ANOVA followed by Tukey’s multiple-comparisons test; statistical analysis in D was performed using a 2-tailed unpaired t test. *P < 0.05, **P < 0.01, ***P < 0.001.
Figure 3
Figure 3. Cep57 loss or truncation leads to supernumerary centrosomes.
(A) Representative images of interphase and metaphase MEFs and MVA patient fibroblasts with centrosome amplification labeled for Cep57 and centrin 2. Insets display magnified images of centrioles. Scale bar: 5 μm. (B) Quantification of the percentage of MEFs with centriole amplification. (C) Quantification of human fibroblasts of indicated genotypes with centriole amplification. (D) Subcategorization of cells with amplified centrioles by severity of amplification (number of extra centrioles per metaphase cell). (E) Quantification of number of centrioles (centrin 2) per centrosome (γ-tubulin foci). (F) Intensity of γ-tubulin quantified in MEFs. Analyses in B and DF were performed on at least 5 independent lines per genotype (10 cells per line). Analysis in C was performed on 1 cell line. At least 25 cells were scored. Experiment was repeated 3 times. Data represent mean ± SEM. Statistical significance in B and DF was determined using 1-way ANOVA followed by Tukey’s multiple-comparisons test; statistical analysis in C was performed using a 2-tailed unpaired t test. *P < 0.05, **P < 0.01, ***P < 0.001.
Figure 4
Figure 4. Cep57 truncation impairs recruitment of binding partners.
(A) Schematic representation of PCM organization in interphase and mitotic WT cells. Thickness of rings correlates with the amount of PCM component. (B) Representative images from interphase and metaphase MEFs labeled for Cep152 and centrin 2. Quantification of Cep152 signal intensity is shown on the right. (C) Representative images from interphase and metaphase MEFs labeled for Cep63 and centrin 2. Quantification of Cep63 signal intensity is shown on the right. (D) Representative images from interphase and metaphase MEFs labeled for Cep192 and centrin 2. Quantification of Cep192 signal intensity is shown on the right. Data represent mean ± SEM. Statistical significance in BF was determined using 1-way ANOVA followed by Tukey’s multiple-comparisons test. *P < 0.05, **P < 0.01, ***P < 0.001. Scale bars: 5 μm.
Figure 5
Figure 5. Cep57 truncation perturbs centrosome maturation.
(A) Representative images from MEFs in G1, G2, prophase (P), prometaphase (PM), and metaphase (M) phases of the cell cycle labeled for pericentrin (PCNT) and centrin 2. Quantification of PCNT signal intensity is shown on the right. (B) Representative images from interphase and metaphase MEFs labeled for Cdk5rap2 and centrin 2. Quantification of Cdk5rap2 signal intensity is shown on the right. (C) Schematic representation of PCM organization in interphase and mitotic Cep57T/T cells. Thickness of rings correlates to the amount of PCM component. Arrows on the right indicate increase or decrease of PCM component in Cep57T/T cells compared with WT cells. Dashed line indicates reduction in accumulation of Cep57, Cep63, and Cep152. NA, not applicable. Data represent mean ± SEM. Statistical significance was determined using 1-way ANOVA followed by Tukey’s multiple-comparisons test. *P < 0.05, **P < 0.01, ***P < 0.001. Scale bars: 5 μm.
Figure 6
Figure 6. Cep57 controls the timing of centriole disengagement in mitosis.
(A) Representative images of MEFs labeled for centrin 2 to measure intercentriolar distance. Scale bar: 5 μm. (B) Dot plot of metaphase intercentriolar distance measurements in MEFs of indicated genotypes. Twelve data points for Cep57T/T are outside the range shown. (C) Dot plot of metaphase intercentriolar distance measurements in human fibroblasts of indicated genotypes. One data point (CEP57T/T) is outside the range shown. (D) Dot plot of metaphase intercentriolar distance measurements in WT MEFs transduced with indicated shRNAs. (E) Quantification of the percentage of cells with centrosome amplification after knockdown using indicated shRNAs. Analyses in B, D, and E were performed on at least 3 independent lines per genotype (20 cells per line). Analysis in C was performed on 1 line per genotype (at least 20 cells per line). The experiment was repeated 3 times. Data in E represent the mean ± SEM. Statistical significance in B was determined using 1-way ANOVA followed by Tukey’s multiple-comparisons test. Statistical significance in CE was determined using a 2-tailed unpaired t test. *P < 0.05, **P < 0.01, ***P < 0.001.
Figure 7
Figure 7. Cep57 truncation leads to aberrant spindles that missegregate chromosomes.
(A) Representative images of metaphase microtubule configurations and intensity in MEFs. Right: Quantification of spindle abnormalities. (B) Quantification of spindle intensities as seen in A. (C) Quantification of spindle α-tubulin intensity in human fibroblasts of indicated genotypes. (D) Microtubule regrowth assay on Cep57-insufficient cells. Left: Images of mitotic MEFs of the indicated genotypes placed on ice for 40 minutes and stained for α- and γ-tubulin after the indicated recovery times at 37°C. Right: Quantification of α-tubulin signals in MEFs of the indicated genotypes. (E) Measurement of metaphase plate width in MEFs of indicated genotypes/subgroups. (F) Percentage of cells undergoing indicated chromosome missegregation error determined by live-cell imaging on MEFs expressing H2B-mRFP. (G) Percentage of cells observed to form micronuclei after a chromosome missegregation event, per analyses performed in E. (H) Percentage of P5 MEFs with abnormal number of chromosomes counted on metaphase spreads. Polyploid cells were excluded. Analyses in A, B, and D were performed on at least 3 independent lines per genotype (20 cells per line). Analysis in C was performed on 1 cell line per genotype (20 cells analyzed per line). The experiment was repeated 3 times. Analyses in E and F were performed on at least 3 independent lines per genotype (at least 25 cells per line). Analysis in G was performed on at least 3 lines per genotype (50 cells per line). Data in AH represent the mean ± SEM. Statistical significance in A, E, and H was determined using 1-way ANOVA followed by Tukey’s multiple-comparisons test. Statistical significance in C, D, F, and G was determined using a 2-tailed unpaired t test, and in B using a 1-tailed unpaired t test. *P < 0.05, **P < 0.01, ***P < 0.001. Scale bars: 5 μm.
Figure 8
Figure 8. MVA patient–mimetic mice have widespread aneuploidy in vivo.
(A) Percentage of single cells isolated from specified tissues with aneuploidy as determined by FISH using probes for chromosomes 4 and 7. One-day-old animals were used for the analysis. (B) Karyotyping performed on metaphase spreads of cells isolated from the livers of 1-day-old animals. (C) Karyotyping performed on metaphase spreads of cells isolated from the spleens of 5-month-old animals. (D) Images of p-HH3–positive cells with supernumerary centrosomes of the indicated tissues of 1-day-old Cep57T/T mice. Scale bar: 5 μm. (E) Quantification of mitotic cells with amplified centrosomes in tissues of 1-day-old mice of the indicated genotypes. Analyses in AC and E were performed on at least 3 animals per genotype. One hundred cells per animal were counted in A for each tissue. At least 50 cells per animal were counted in B and C. Analyses in E were performed on at least 50 cells per tissue per animal. Data in AC and E represent the mean ± SEM. Statistical significance in AC was determined using a 2-tailed unpaired t test, and in E using a 1-tailed unpaired t test. *P < 0.05, **P < 0.01, ***P < 0.001.
Figure 9
Figure 9. Cep57-insufficient mice are tumor prone.
(A) Spontaneous tumor incidence in 16-month-old mice (17 Cep57+/T and 17 Cep57+/+ mice were used). Representative histological image of a lung adenoma from a Cep57+/T mouse. Scale bar: 1 mm. (B) DMBA-induced tumor incidence in 4-month-old mice. Sample sizes of 21 Cep57+/T and 20 Cep57+/+ mice were used. (C) Spontaneous tumor incidence in 16-month-old mice. Sample sizes of 32 Cep57+/– and 24 Cep57+/+ mice were used. (D) Karyotyping performed on metaphase spreads of cells isolated from the spleens of 5-month-old mice. n = 3 mice used per genotype. Fifty cells were counted per animal. (E) Western blot analysis comparing Cep57 expression between lung adenomas (T) and paired adjacent normal lung tissue (N) lysates from 16-month-old mice of the indicated genotypes to assess Cep57 loss of heterozygosity. CEP57T/T (T/T) lung tissue (at P1) was loaded as a control for complete loss of WT Cep57 protein. *Nonspecific band present in some samples. PonS served as loading control. (F) Image of a tissue section of a spontaneous lung adenoma with flanking normal tissue from a CEP57+/T mouse immunolabeled for Cep57 (red) and γ-tubulin (green). Nuclei were visualized with Hoechst. Dotted yellow line marks the tumor. Insets show colocalization of centrosomal Cep57 and γ-tubulin in both normal (red box) and tumor (yellow box) regions. Statistical significance in AD was determined using a 2-tailed Fisher’s exact test. *P < 0.05, ***P < 0.001. Scale bar: 100 μm; inset, 5 μm.

References

    1. Hanks S, et al. Constitutional aneuploidy and cancer predisposition caused by biallelic mutations in BUB1B. Nat Genet. 2004;36(11):1159–1161. doi: 10.1038/ng1449. - DOI - PubMed
    1. Sir JH, et al. A primary microcephaly protein complex forms a ring around parental centrioles. Nat Genet. 2011;43(11):1147–1153. doi: 10.1038/ng.971. - DOI - PMC - PubMed
    1. Yost S, et al. Biallelic TRIP13 mutations predispose to Wilms tumor and chromosome missegregation. Nat Genet. 2017;49(7):1148–1151. doi: 10.1038/ng.3883. - DOI - PMC - PubMed
    1. Martin CA, et al. Mutations in PLK4, encoding a master regulator of centriole biogenesis, cause microcephaly, growth failure and retinopathy. Nat Genet. 2014;46(12):1283–1292. doi: 10.1038/ng.3122. - DOI - PMC - PubMed
    1. Kalay E, et al. CEP152 is a genome maintenance protein disrupted in Seckel syndrome. Nat Genet. 2011;43(1):23–26. doi: 10.1038/ng.725. - DOI - PMC - PubMed

Publication types

MeSH terms

Supplementary concepts